Tag

borrower advisory

34 insights

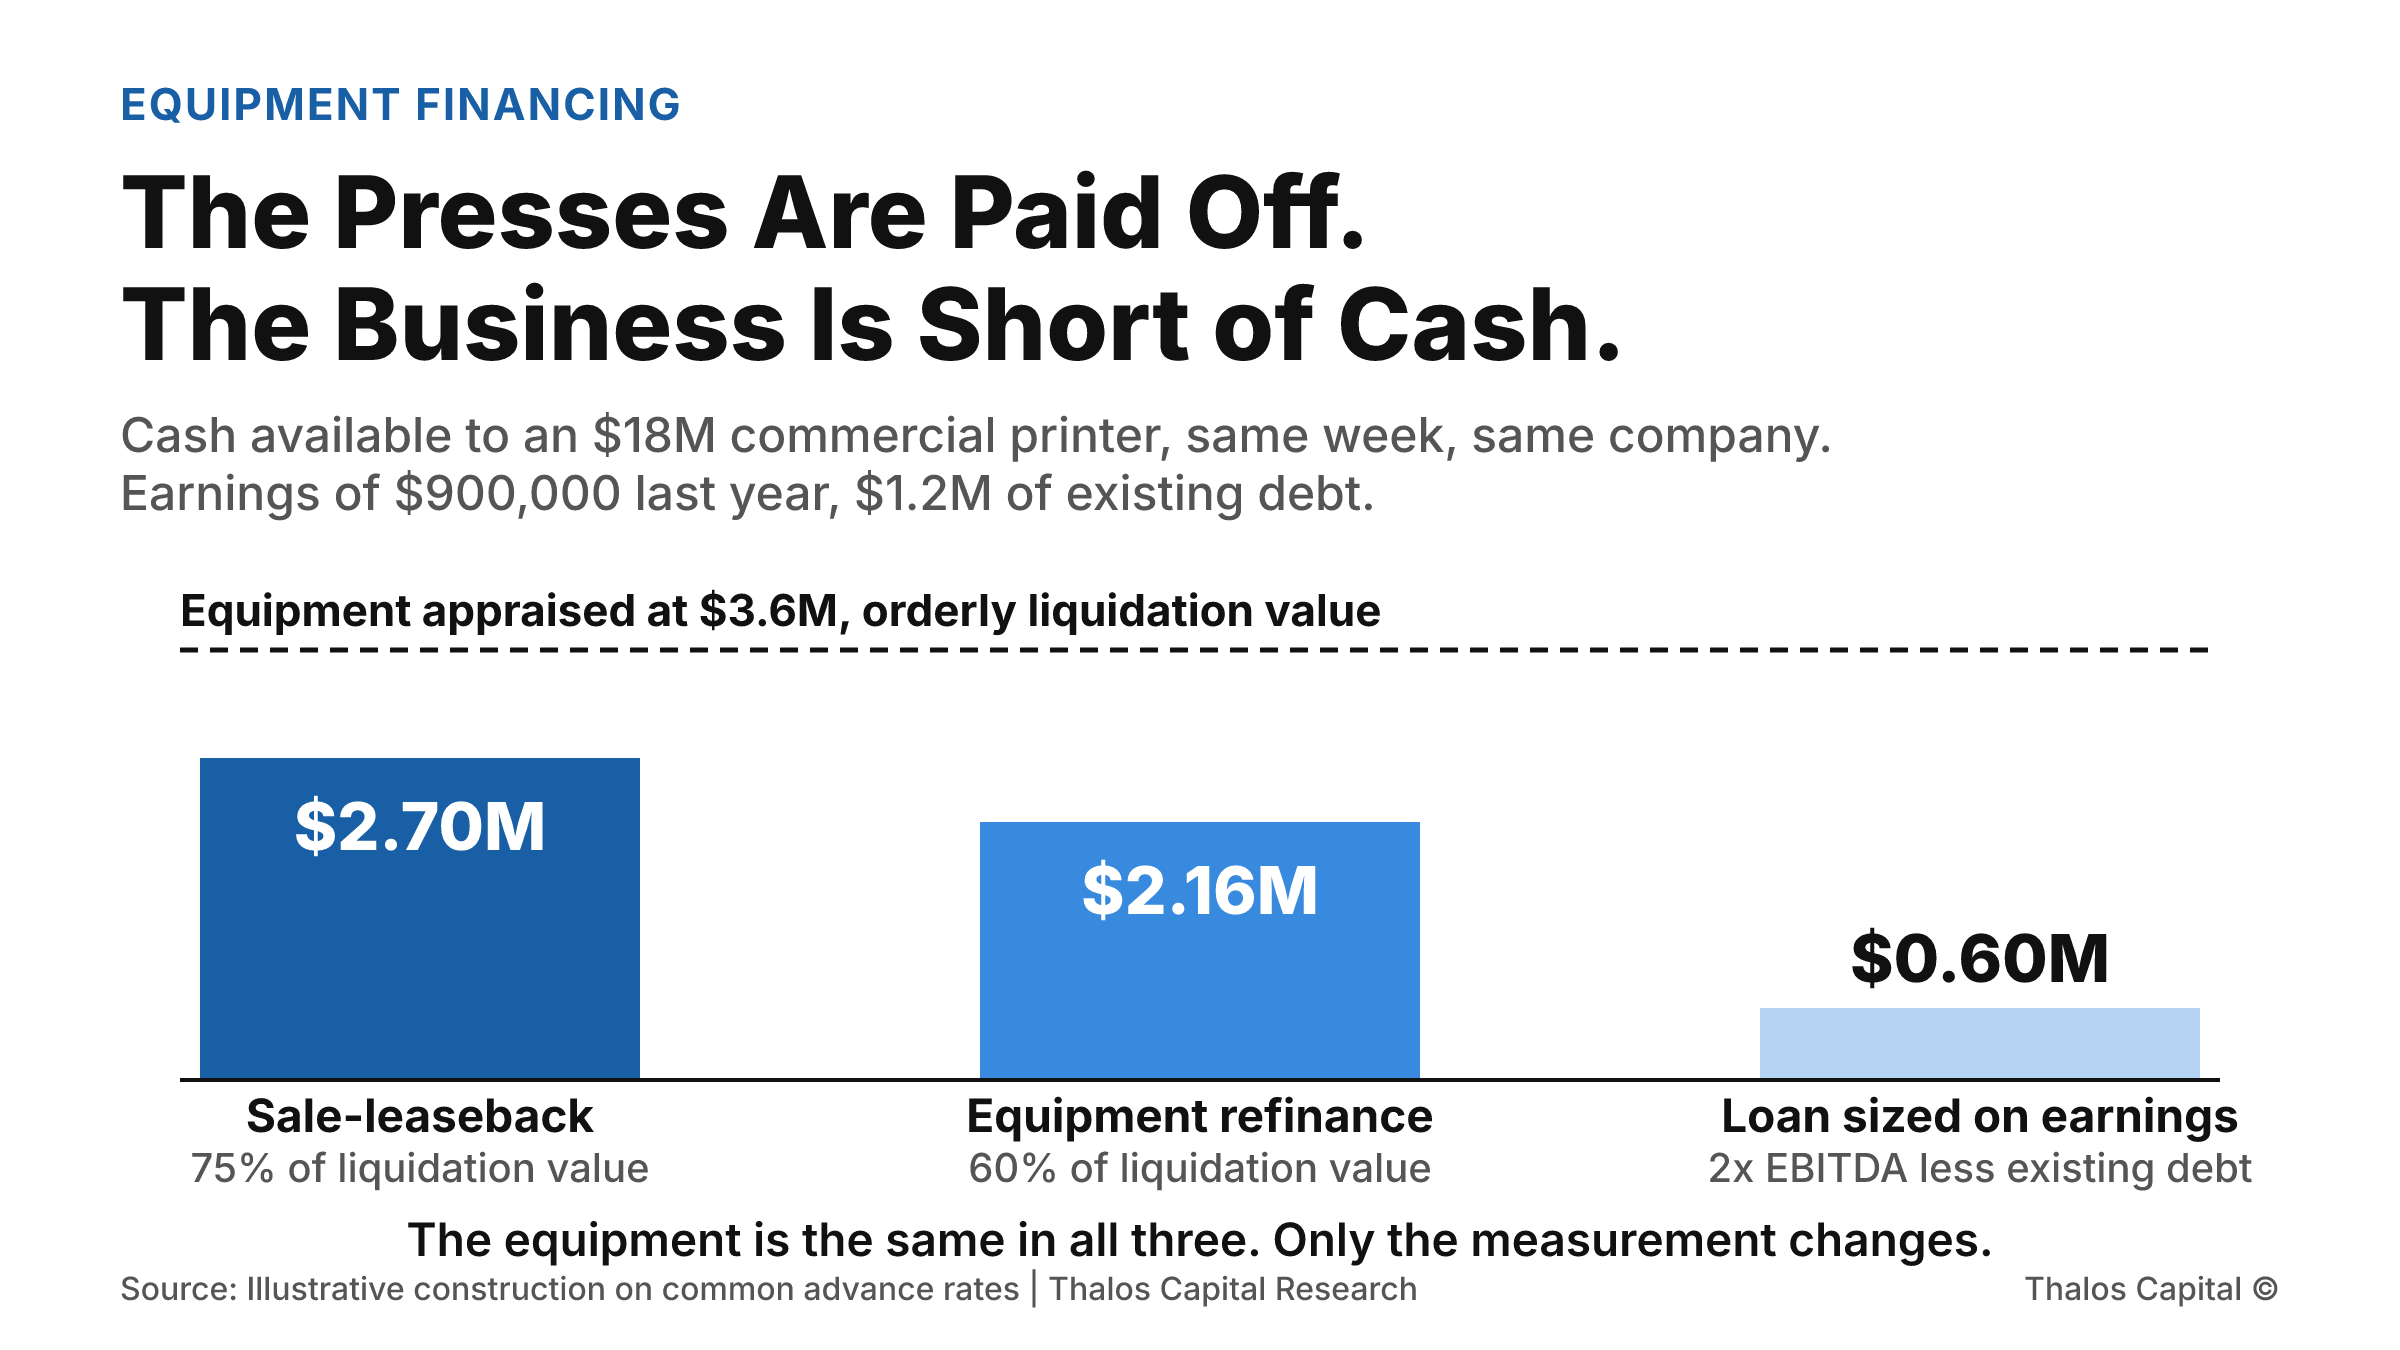
Three columns of cash available to a commercial printer. A sale-leaseback of owned presses raises $2.70 million, an equipment-secured refinance raises $2.16 million, and a loan sized on last year's earnings raises $600,000, against equipment appraised at $3.6 million.

The Presses Are Paid Off. The Business Is Short of Cash.

A commercial printer owns $3.6 million of appraised equipment and can borrow $600,000 on last year's earnings. A sale-leaseback on the same presses raises $2.7 million, at $69,800 a month and $650,000 of total cost.
Read More
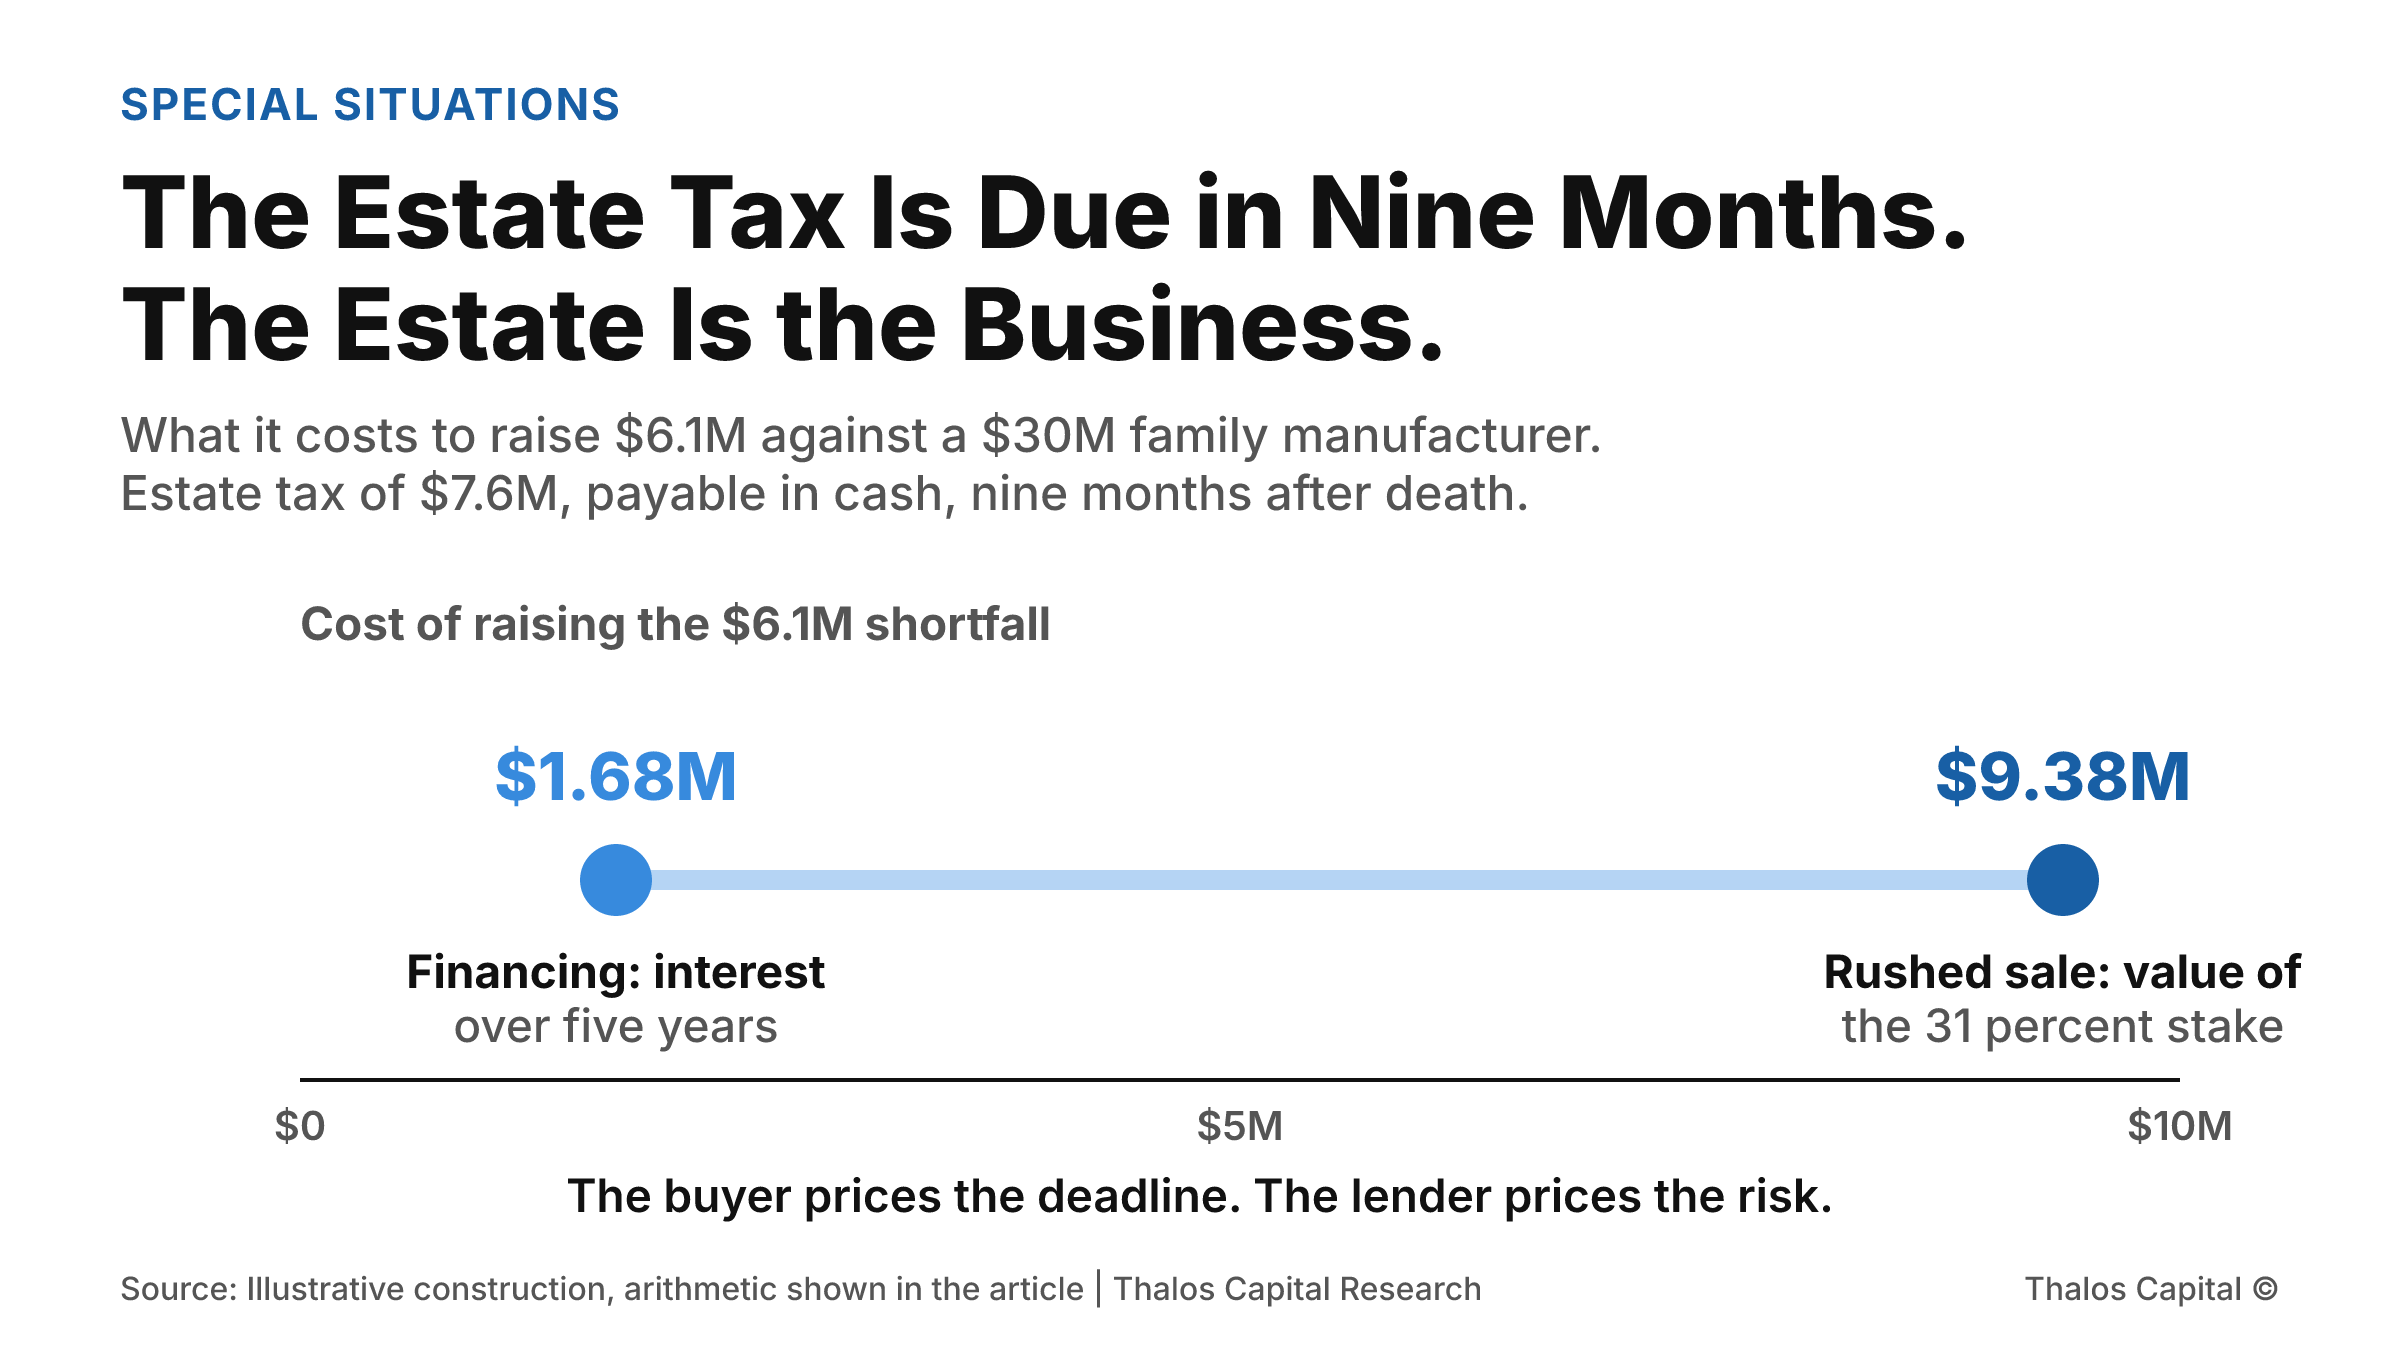
A two-point comparison of what it costs to raise $6.1 million against a $30 million family manufacturer. Selling a 31 percent stake under a deadline gives up $9.38 million of business value. Financing the same amount over five years costs $1.68 million of interest.

The Estate Tax Is Due in Nine Months. The Estate Is the Business.

A family owes $7.6 million of estate tax nine months after the founder's death, with $1.5 million of cash and a $30 million manufacturer. Selling a stake under the deadline gives up $9.4 million of value. Financing costs $1.68 million.
Read More
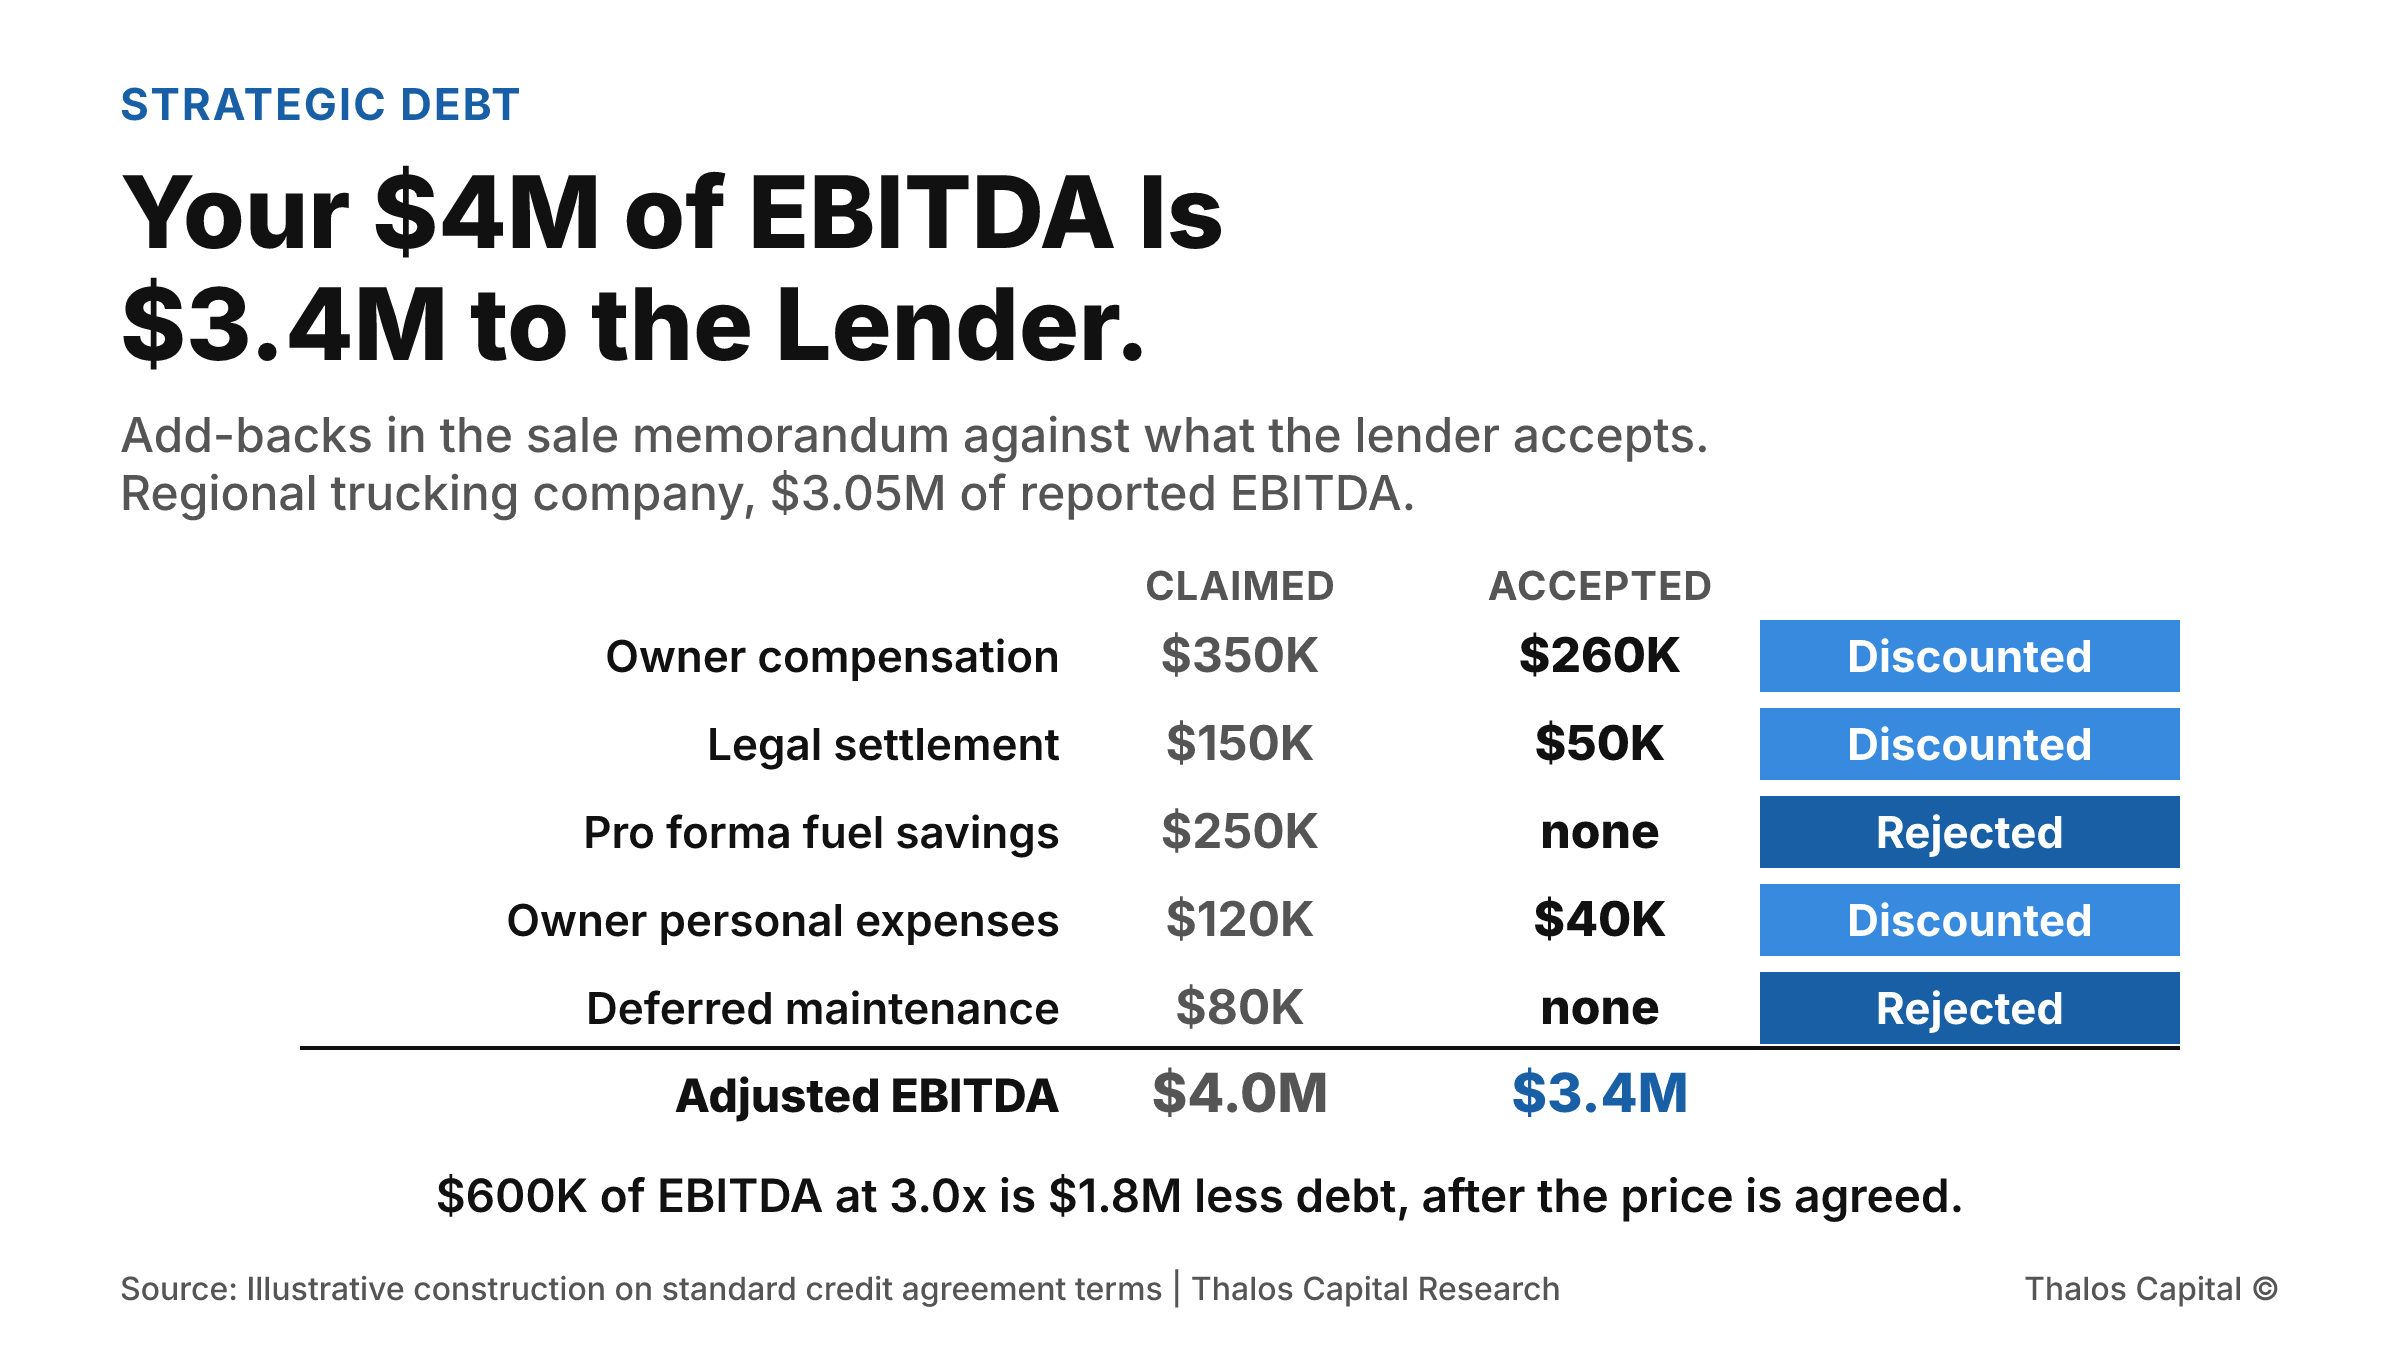
Five add-back categories in a grid, each with the amount claimed in the sale memorandum and the amount a lender accepts. Owner compensation, $350,000 claimed and $260,000 accepted. A legal settlement, $150,000 and $50,000. Pro forma fuel savings, $250,000 and nothing. Owner personal expenses, $120,000 and $40,000. Deferred maintenance, $80,000 and nothing. $950,000 claimed, $350,000 accepted.

Your $4 Million of EBITDA Is $3.4 Million to the Lender

A trucking company is marketed at $4.0 million of adjusted EBITDA. The lender accepts $3.4 million, which cuts the debt available by $1.8 million and raises the equity the buyer has to write by the same amount, after the price is agreed.
Read More
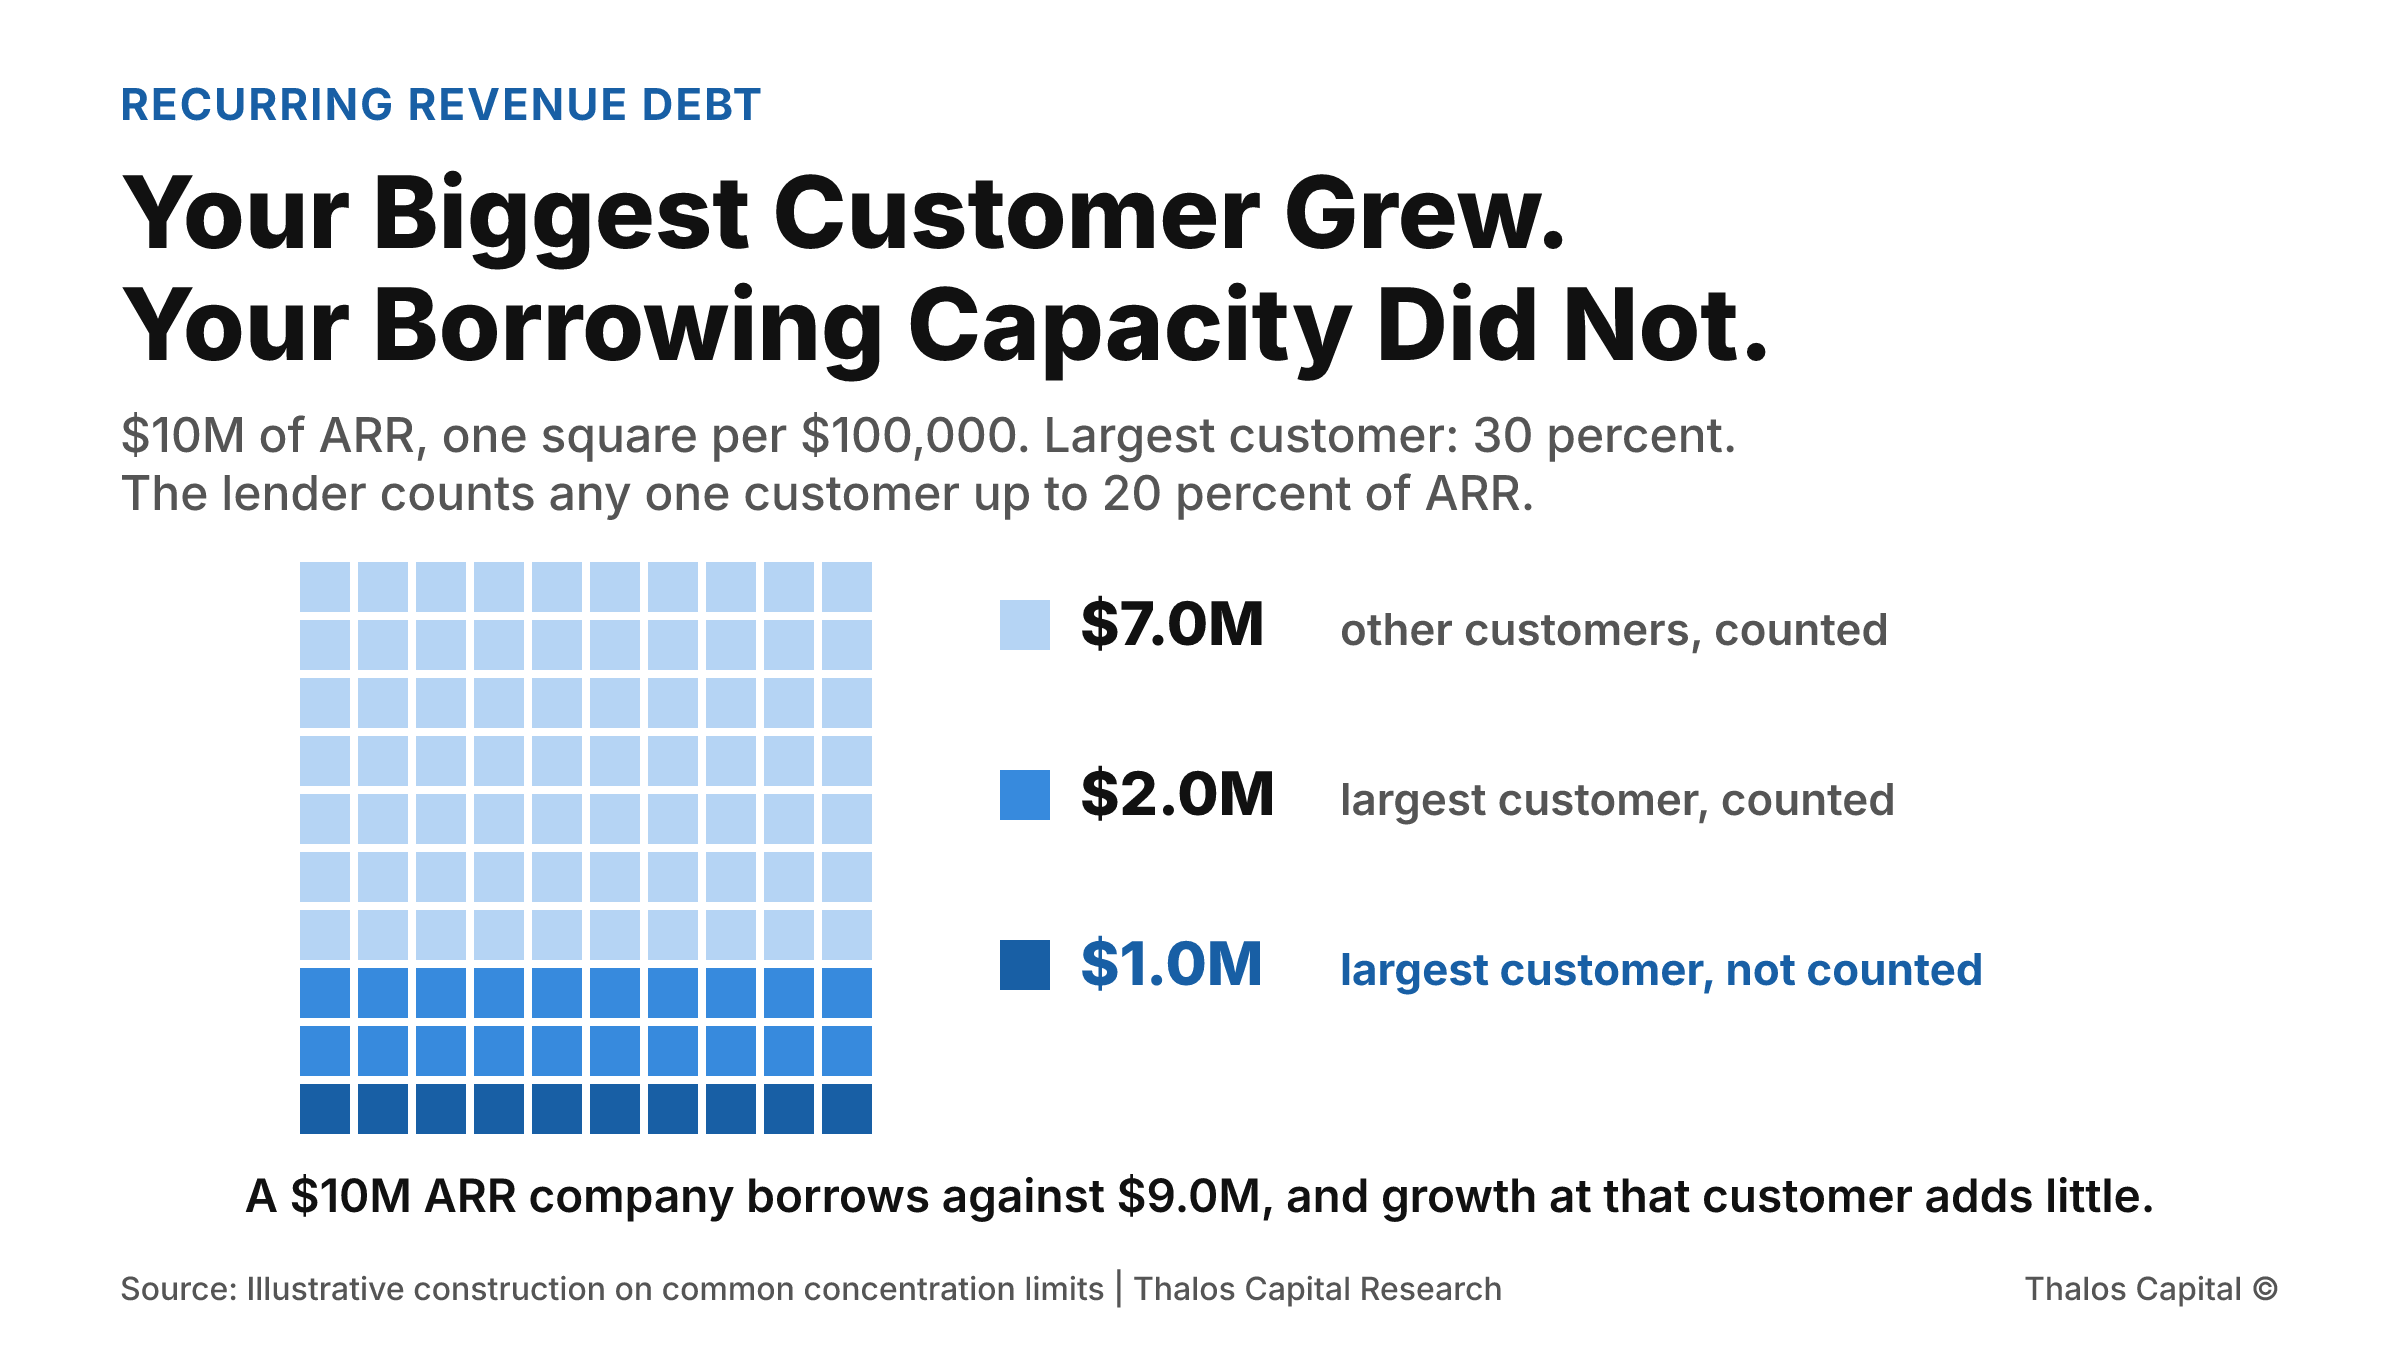
A grid of 100 squares, each worth $100,000 of a software company's $10 million ARR. Seventy squares are other customers and count toward borrowing. Thirty belong to the largest customer: twenty count and ten, the excess above a 20 percent concentration cap, do not.

Your Biggest Customer Grew. Your Borrowing Capacity Did Not.

A $10 million ARR software company adds $2 million of new ARR. From its largest customer, that lifts borrowing capacity by $240,000. From two new customers, the same ARR lifts it by $1.44 million, six times as much.
Read More
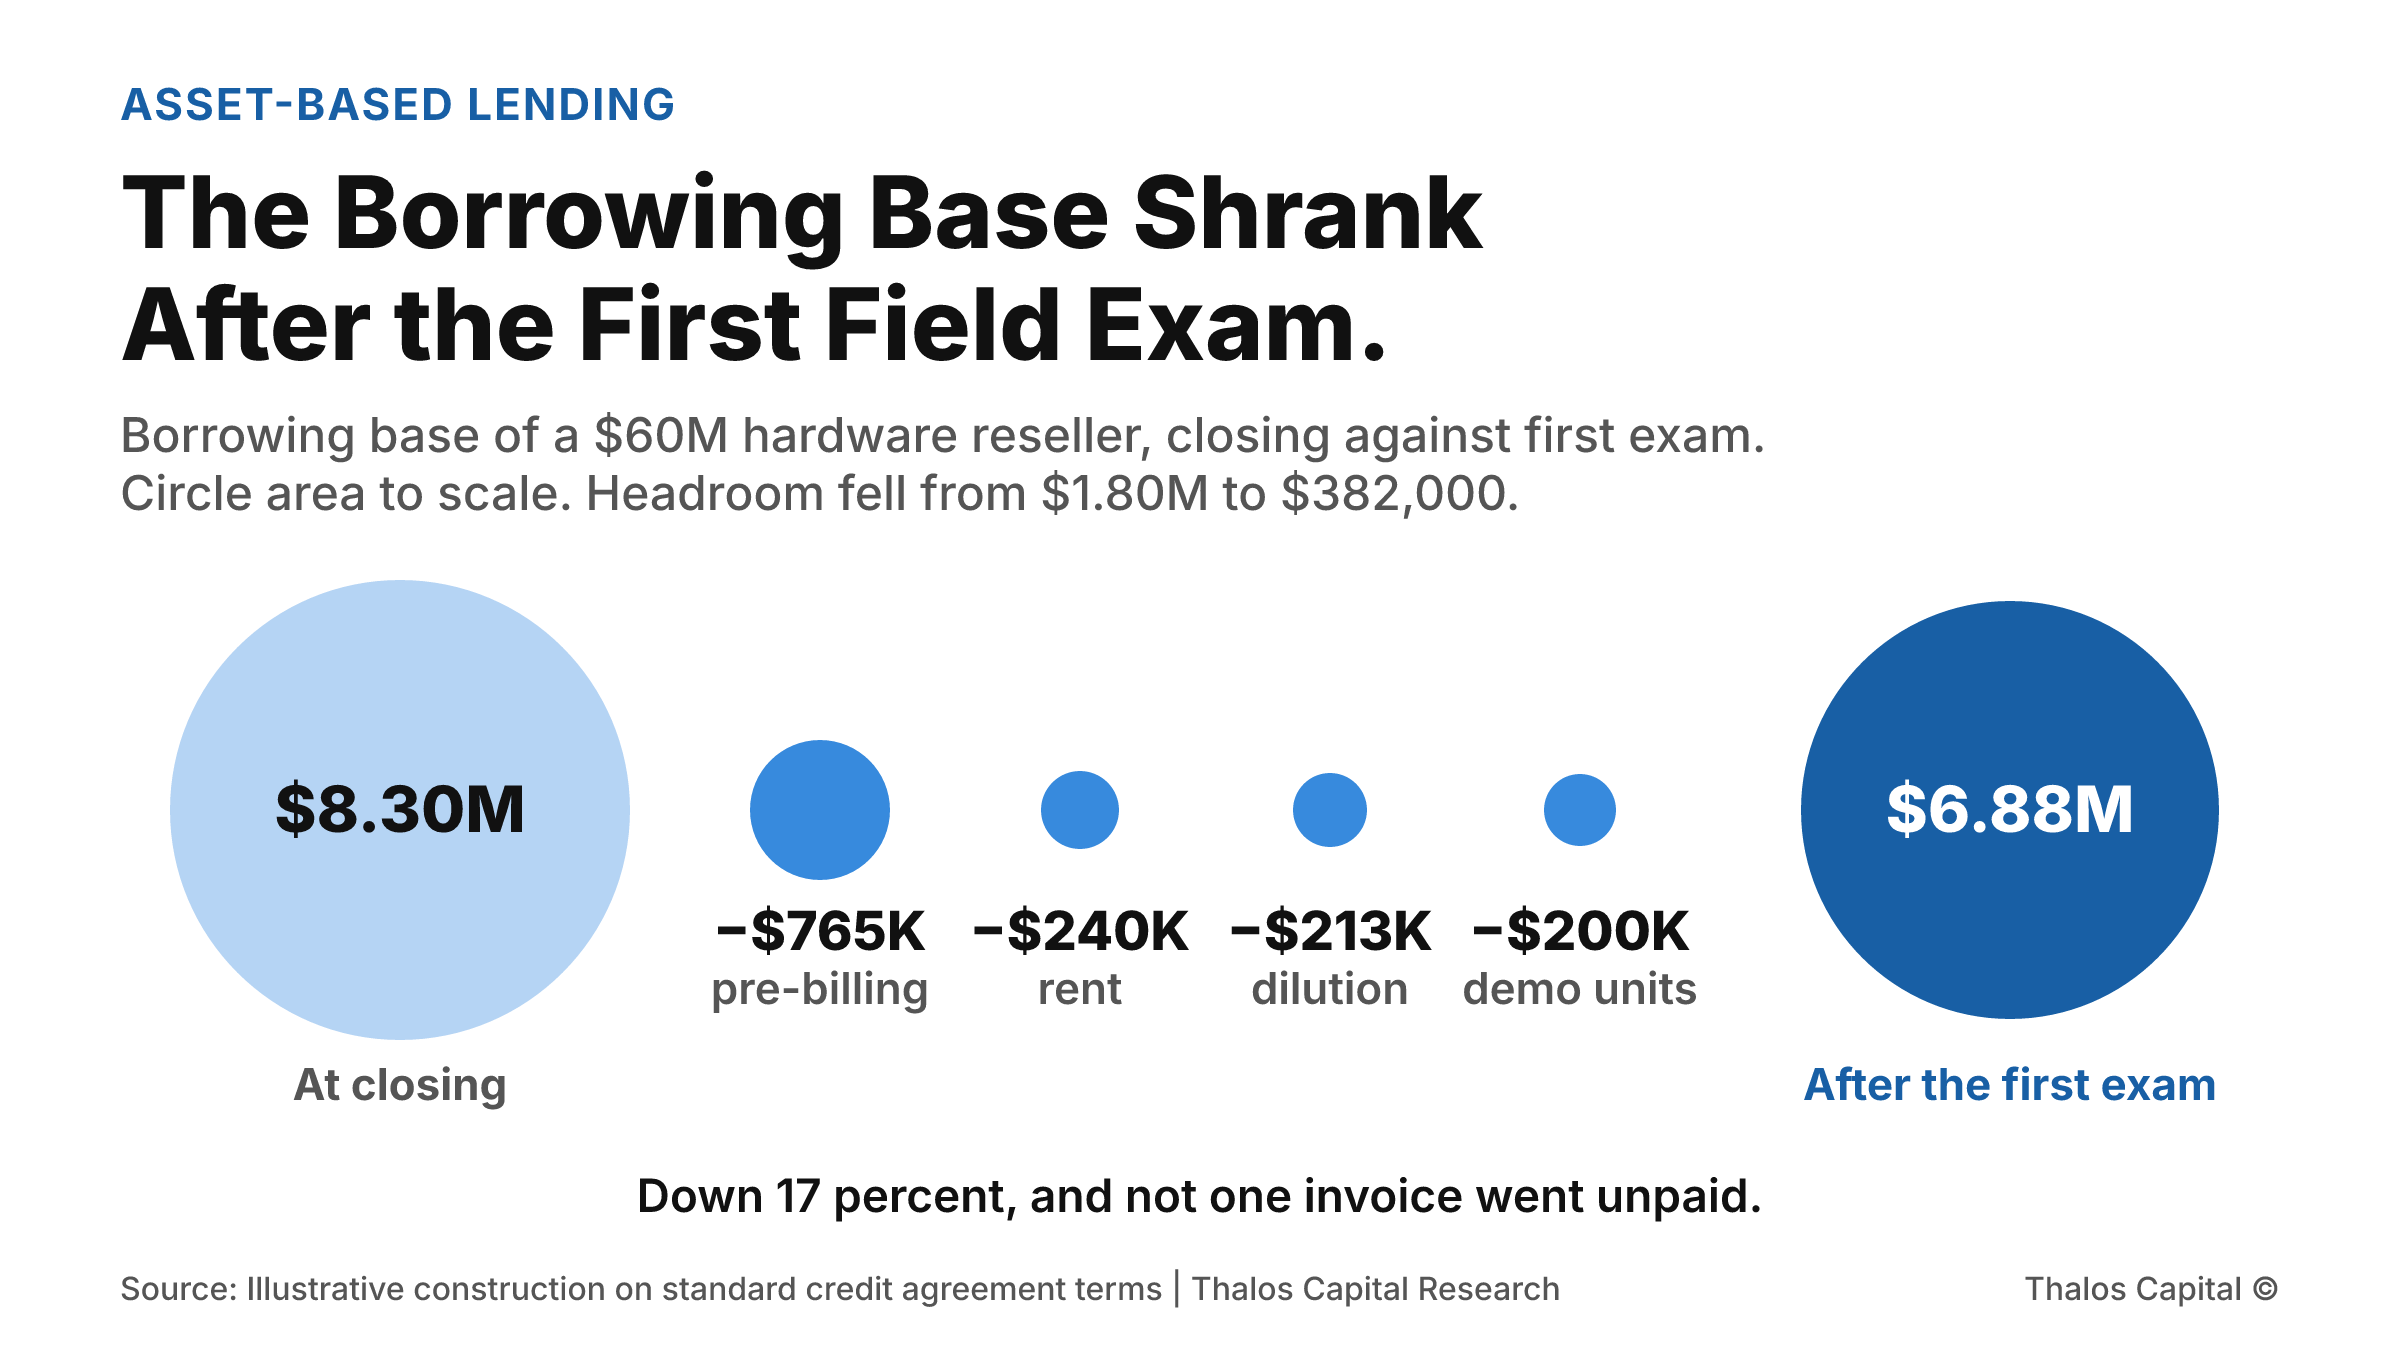
Proportional circles showing a borrowing base of $8.30 million at closing and $6.88 million after the first field exam, with four smaller circles for the adjustments between them: $765,000 of pre-billed invoices, $240,000 of rent reserve, $213,000 from excess dilution and $200,000 of demo units.

The Borrowing Base Shrank After the First Field Exam

A $60 million hardware reseller closed an asset-based line on an $8.30 million borrowing base. The first field exam tested the same collateral and found $6.88 million, and planned headroom of $1.80 million fell to $382,000.
Read More
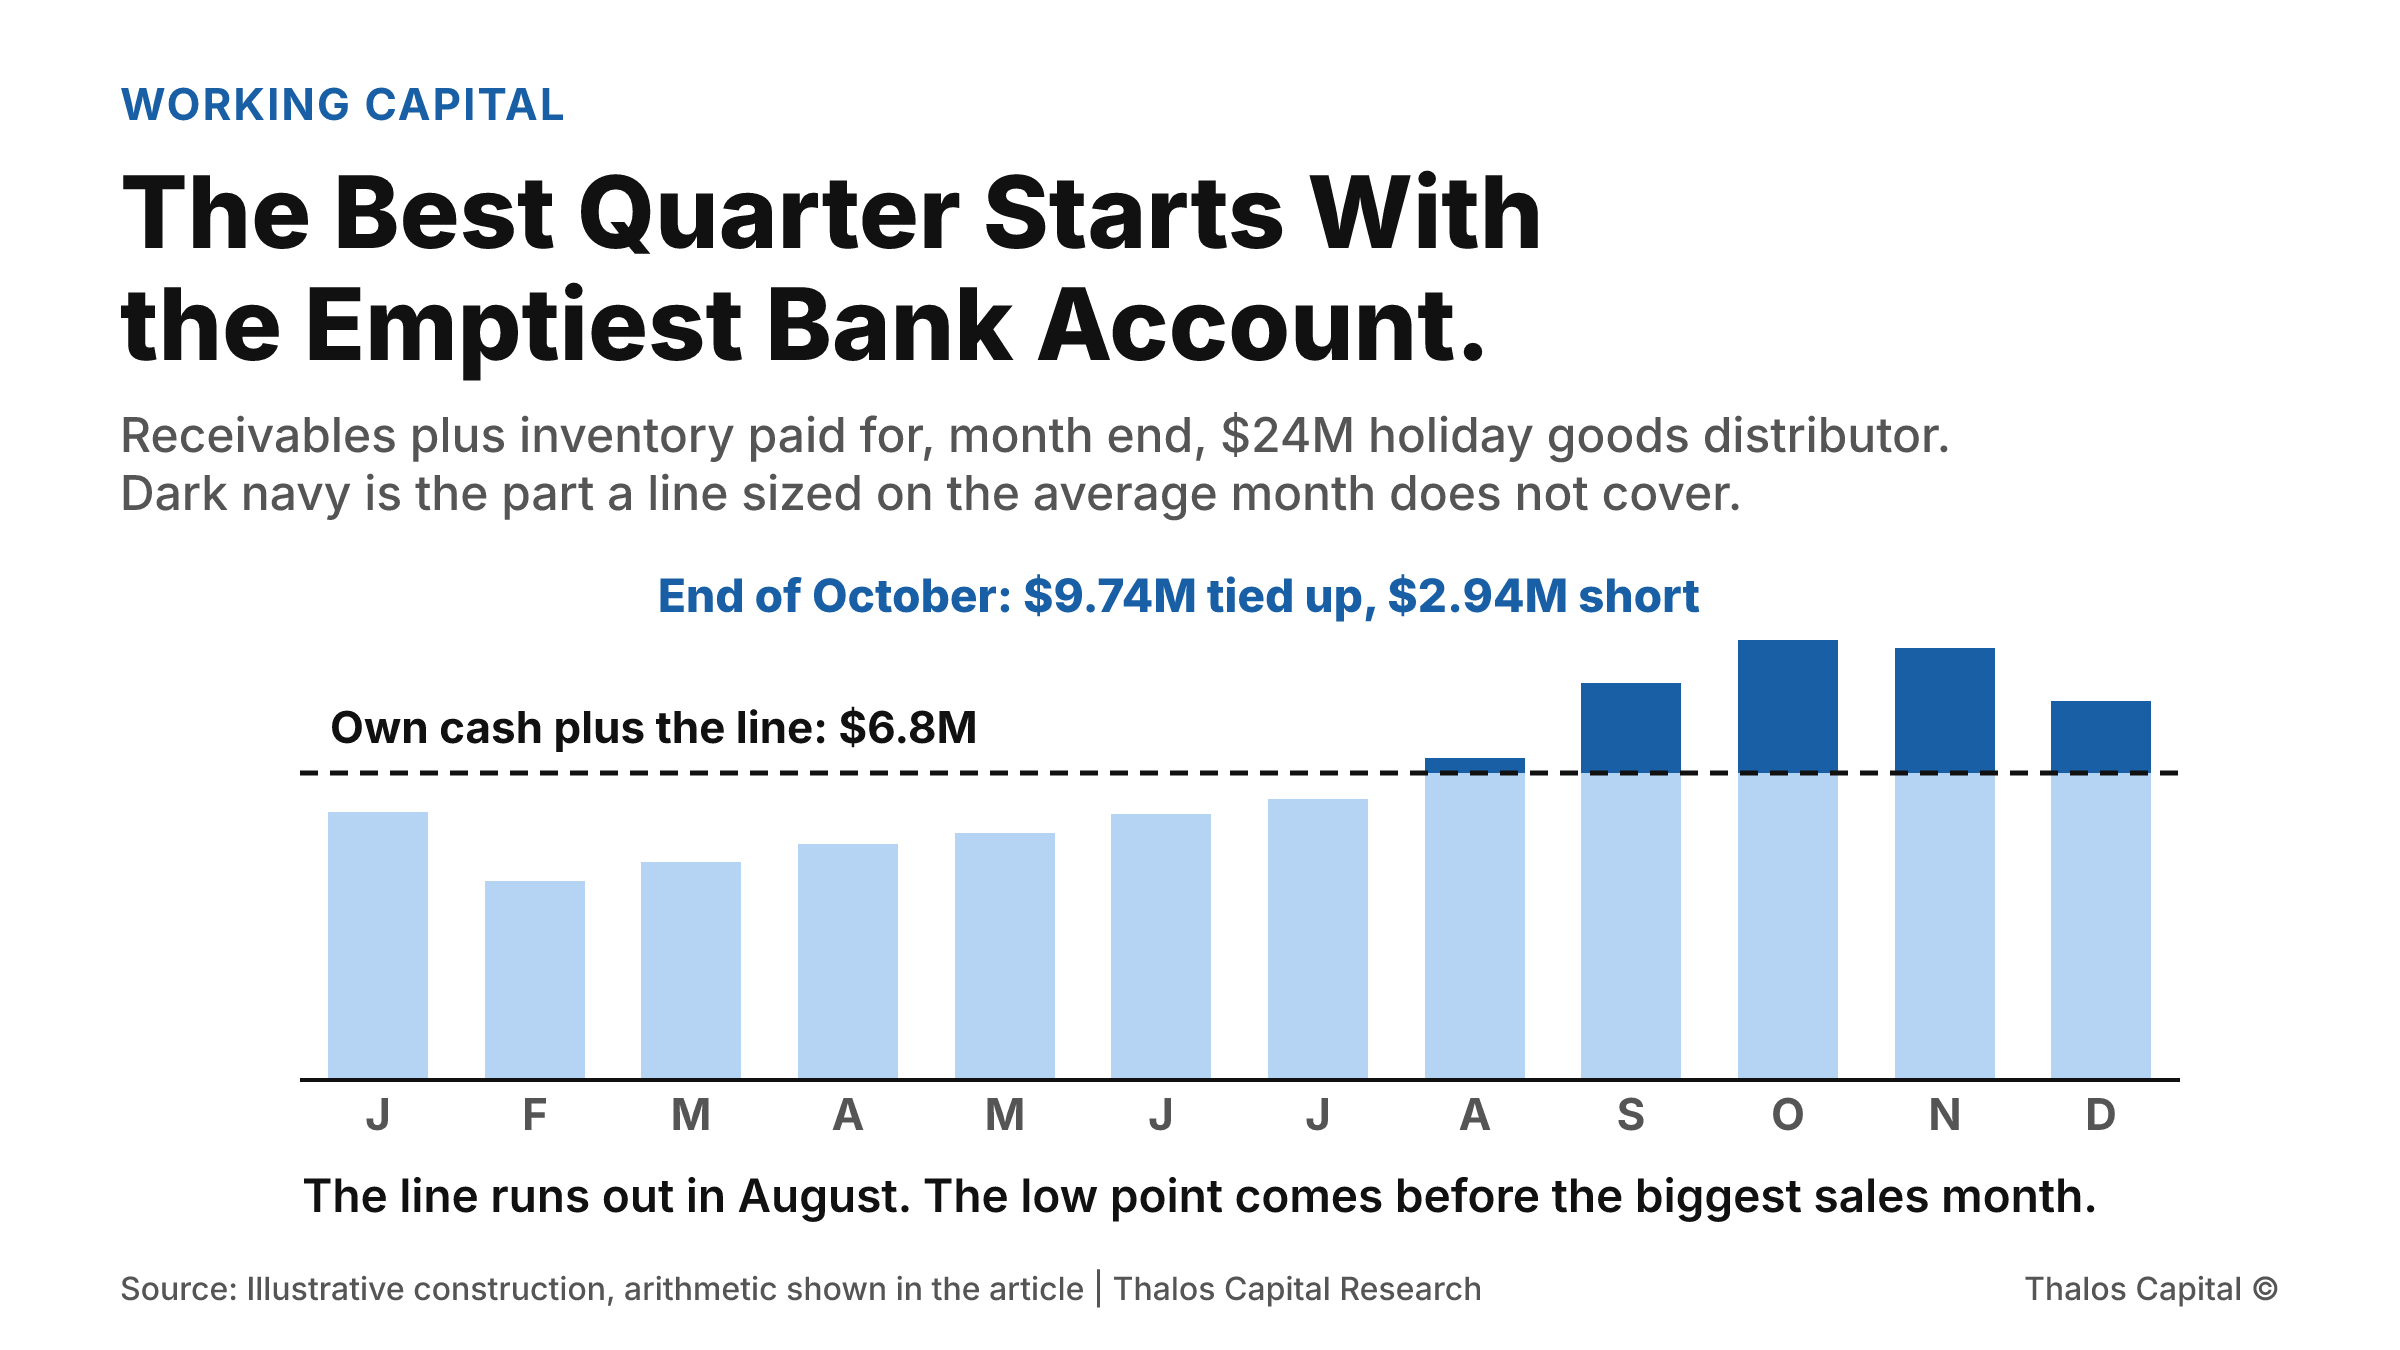
Twelve monthly columns of working capital tied up at a $24 million holiday goods distributor. Months January to July sit below the $6.8 million covered by the owner's cash and a line sized on the average month. August to December rise above it, peaking at $9.74 million at the end of October, $2.94 million short.

The Best Quarter Starts With the Emptiest Bank Account

A $24 million holiday goods distributor ties up $9.74 million in receivables and inventory at the end of October, against $6.8 million on an average month. A credit line sized on the average runs out in August and is $2.94 million short at the peak.
Read More
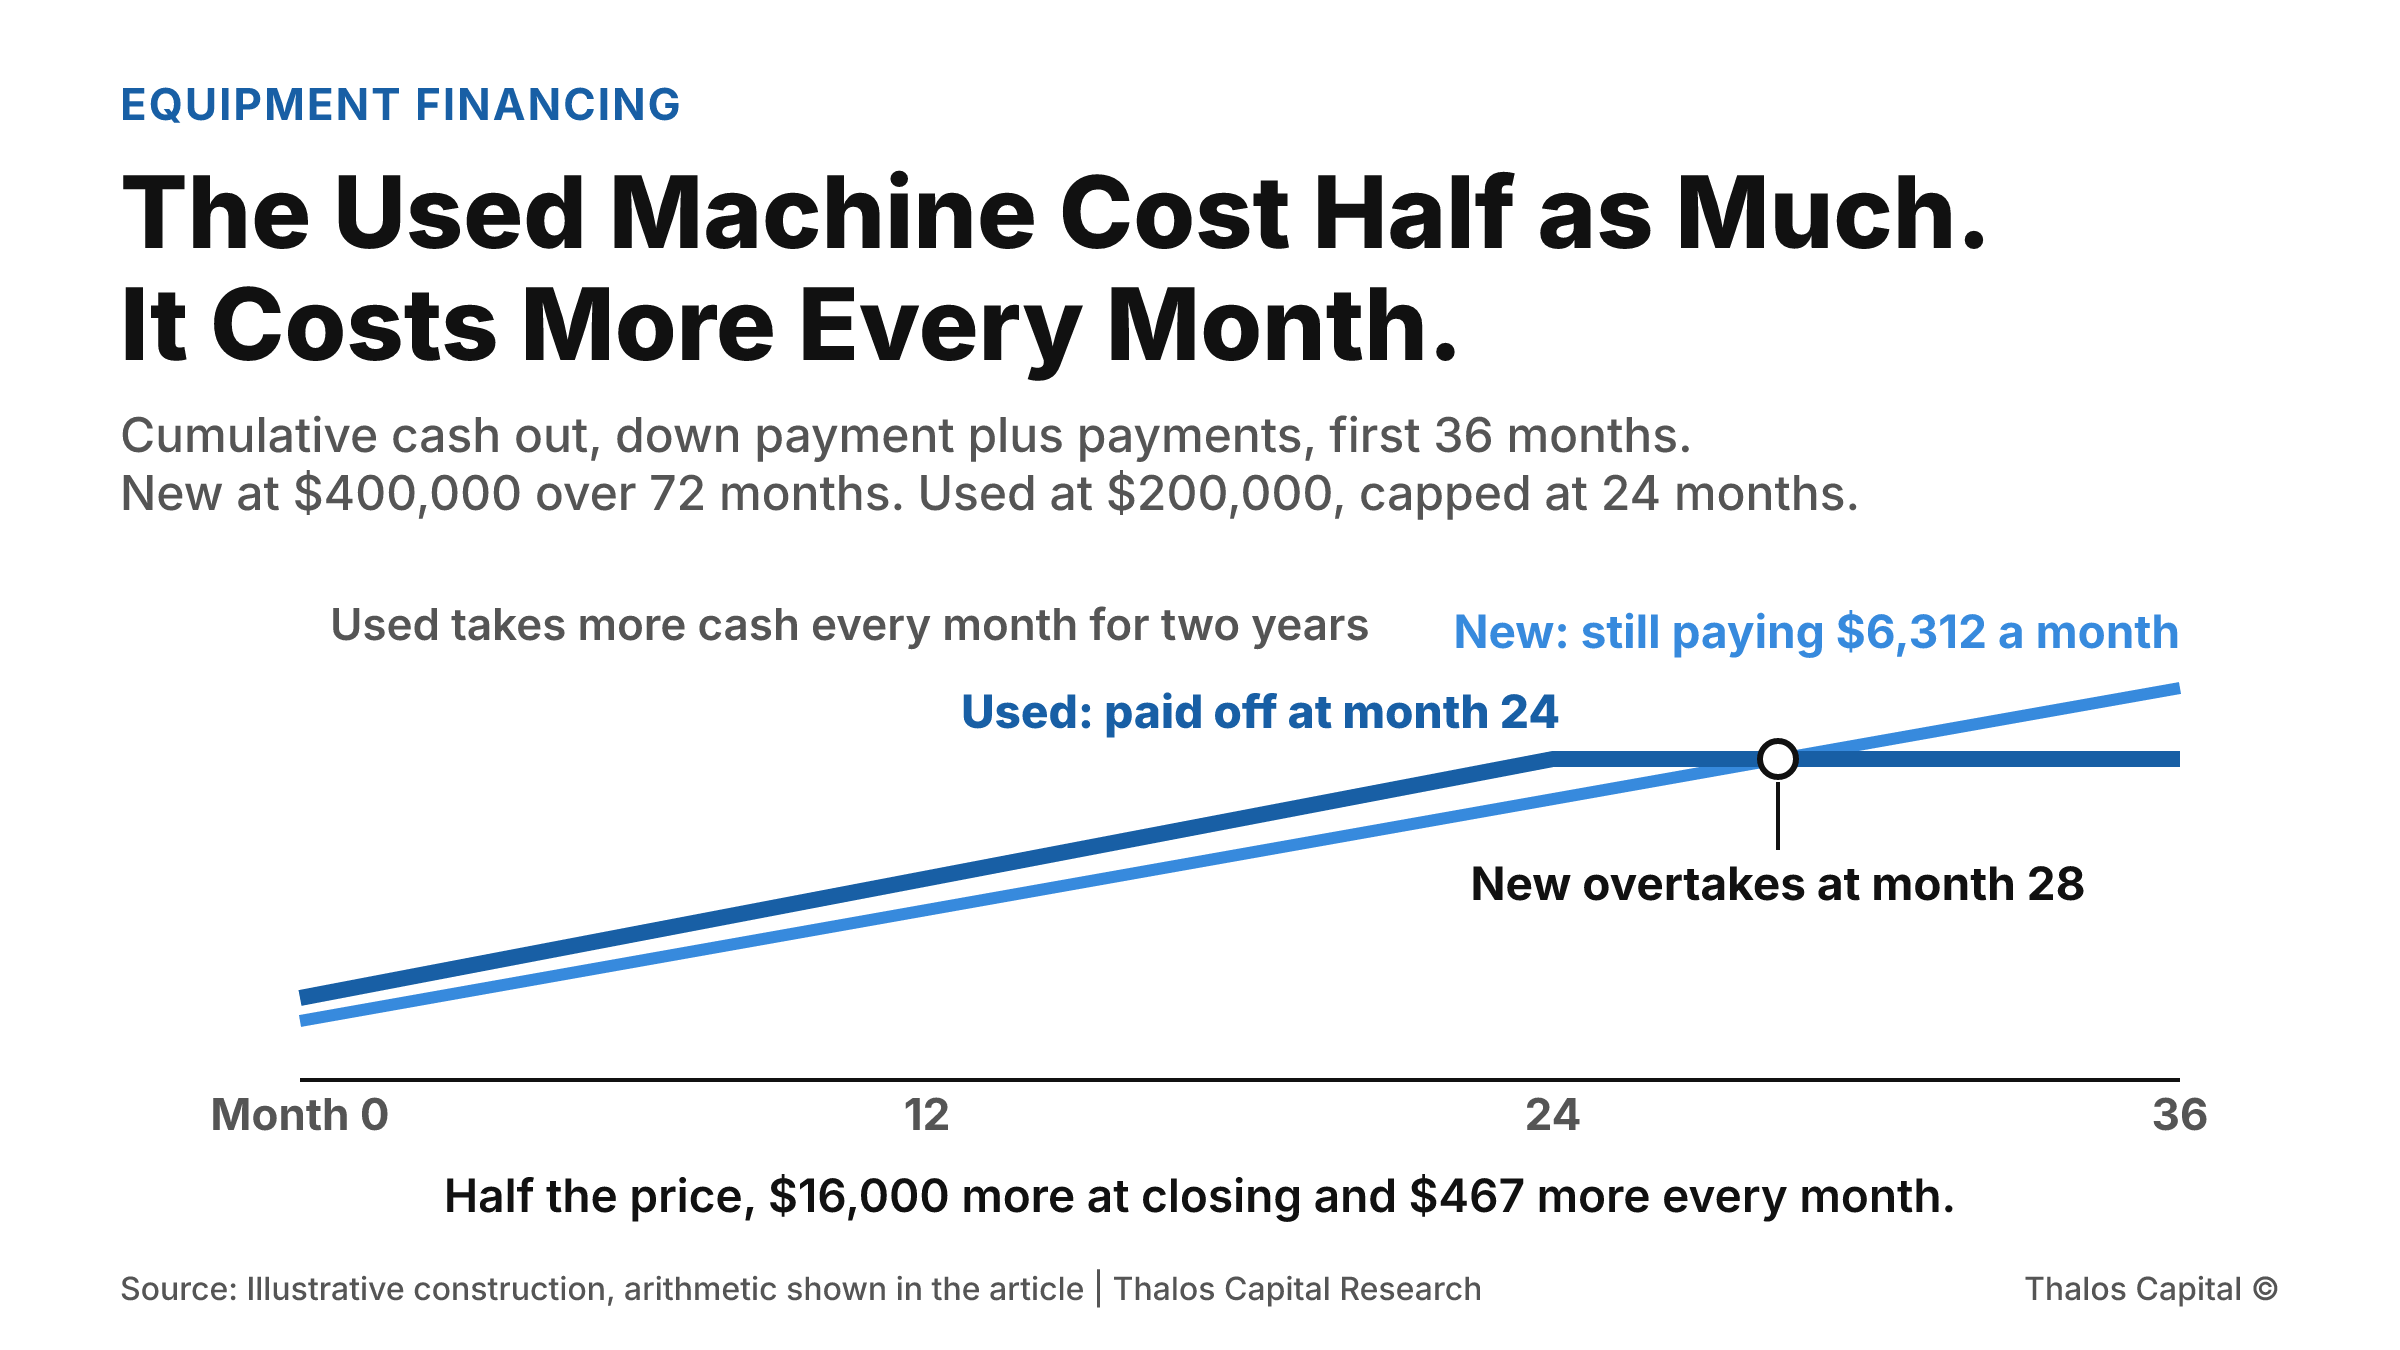
Two lines of cumulative cash out over 36 months. A used excavator at $200,000 takes more cash every month for two years and is paid off at month 24 at $218,686. A new excavator at $400,000 starts lower, overtakes the used machine around month 28, and is still being paid at $6,312 a month.

The Used Machine Cost Half as Much. It Costs More Every Month.

A ten-year-old excavator at half the price of a new one needs $16,000 more at closing and $467 more a month. Older equipment finances on shorter terms against lower appraisals, and the listed price shows neither.
Read More
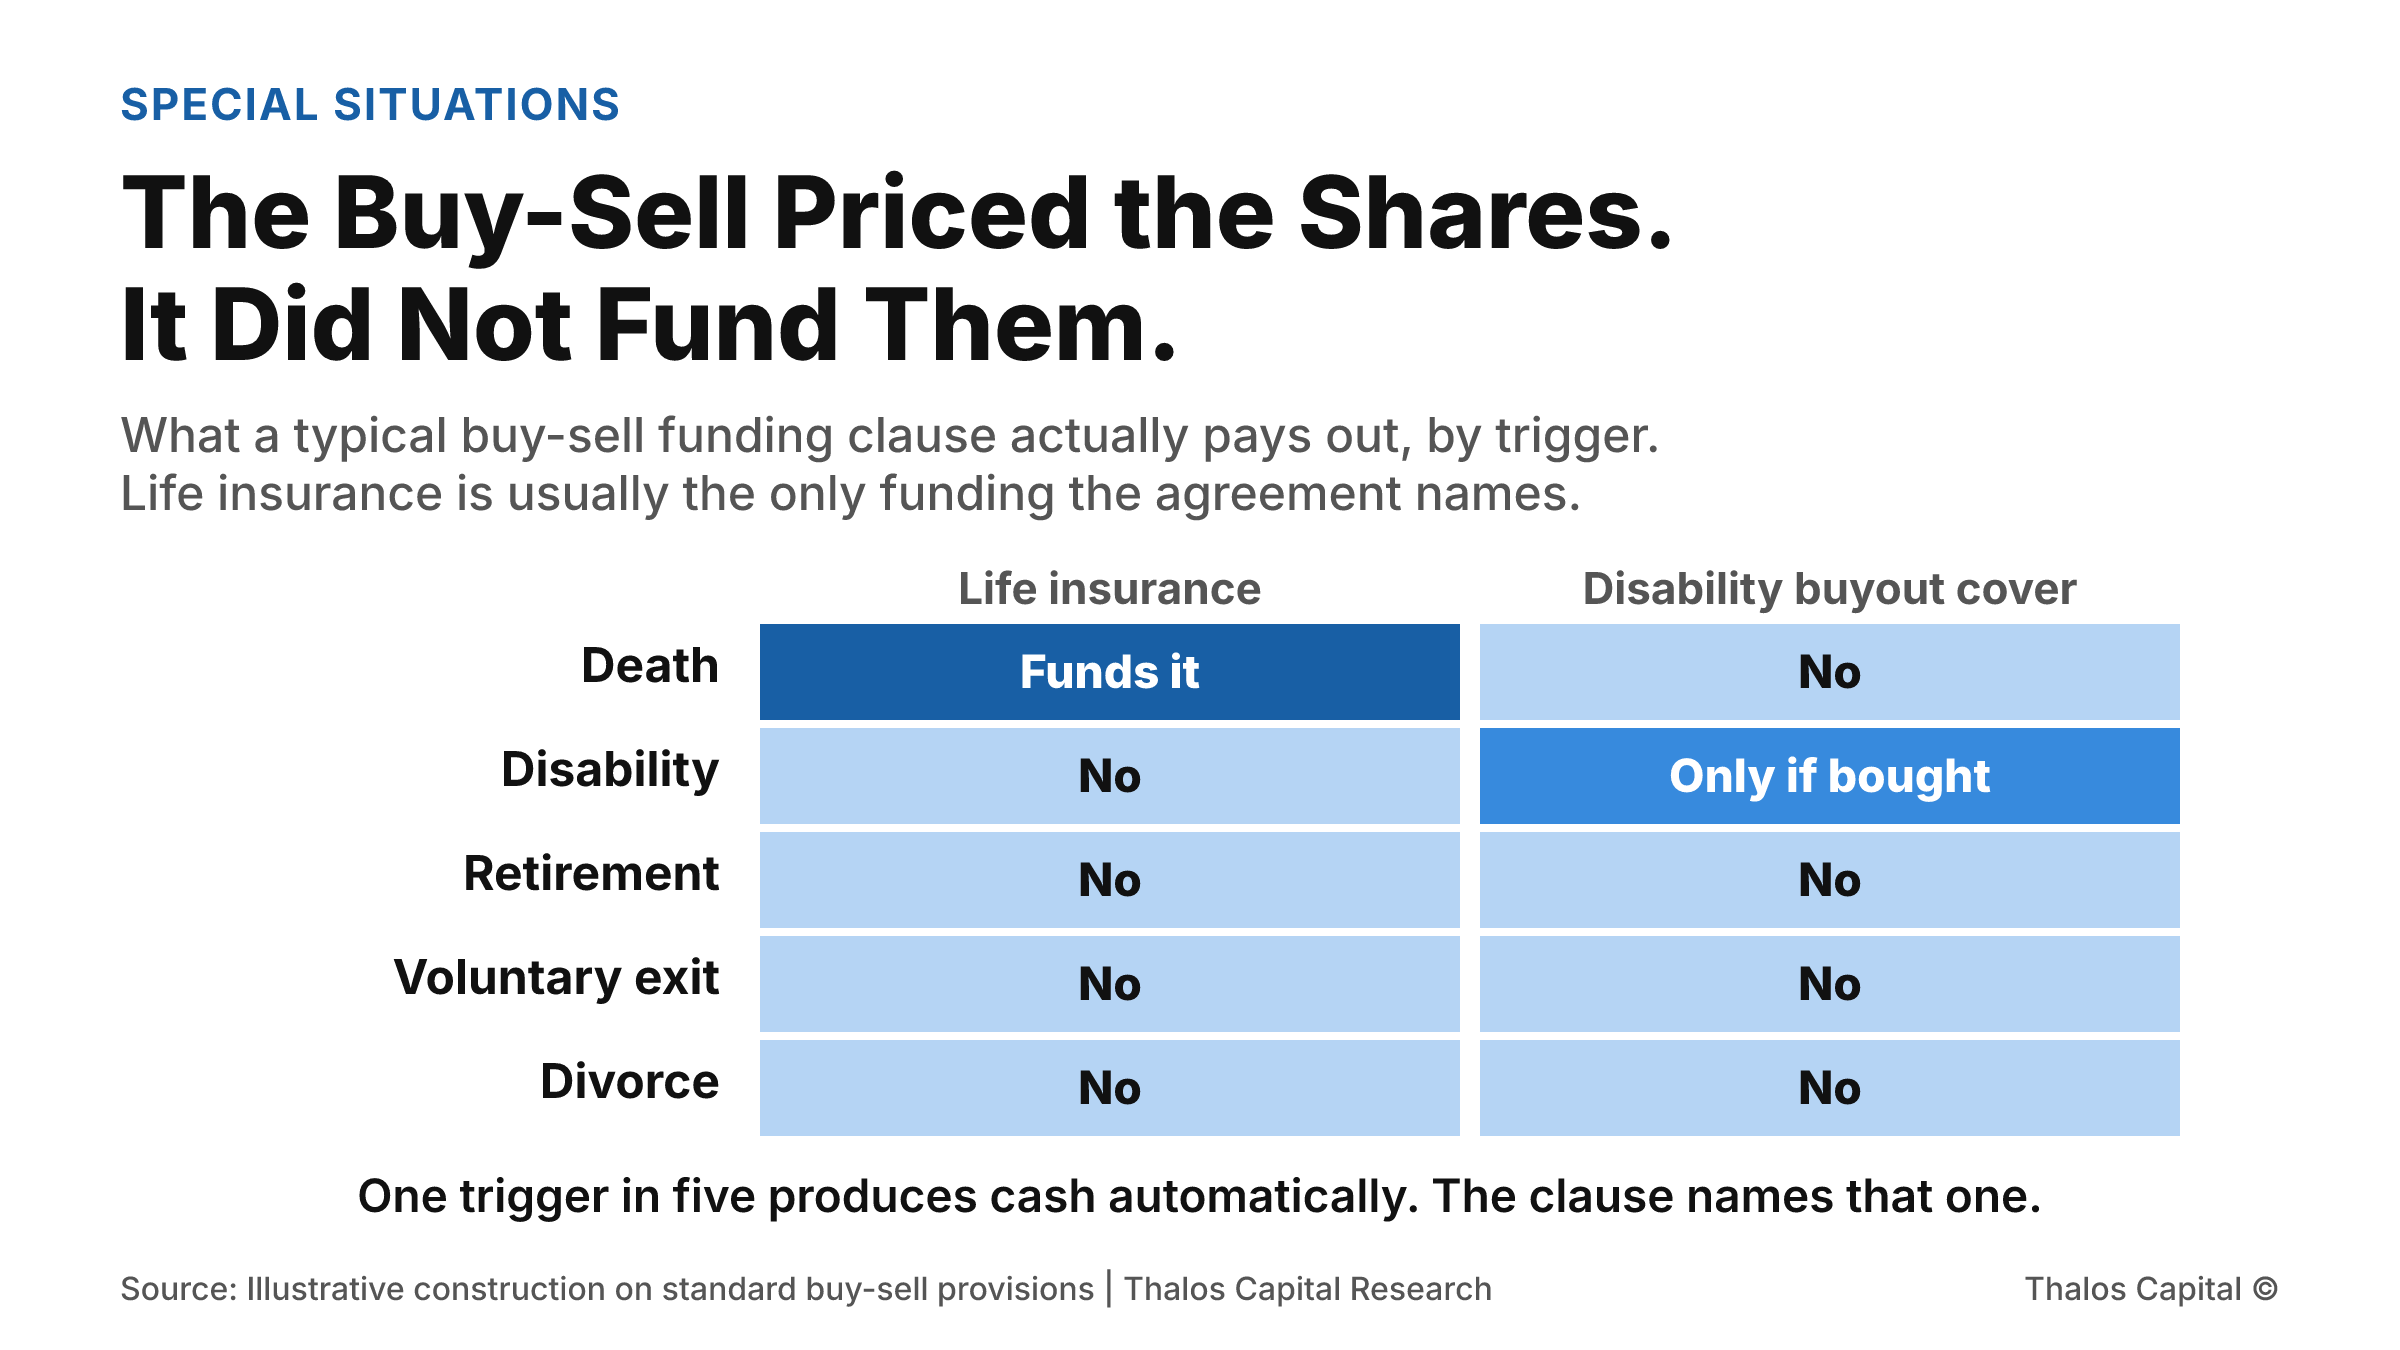
A grid of five buy-sell triggers against two insurance funding sources, showing that life insurance produces cash only on death, disability buyout cover only on disability and only if it was bought, and that retirement, voluntary exit and divorce produce no automatic funding at all.

The Buy-Sell Priced the Shares. It Did Not Fund Them.

A buy-sell agreement settles who can trigger a sale and exactly what the shares are worth. It usually settles funding in one sentence naming life insurance, which pays on only one of the five events that can fire it.
Read More
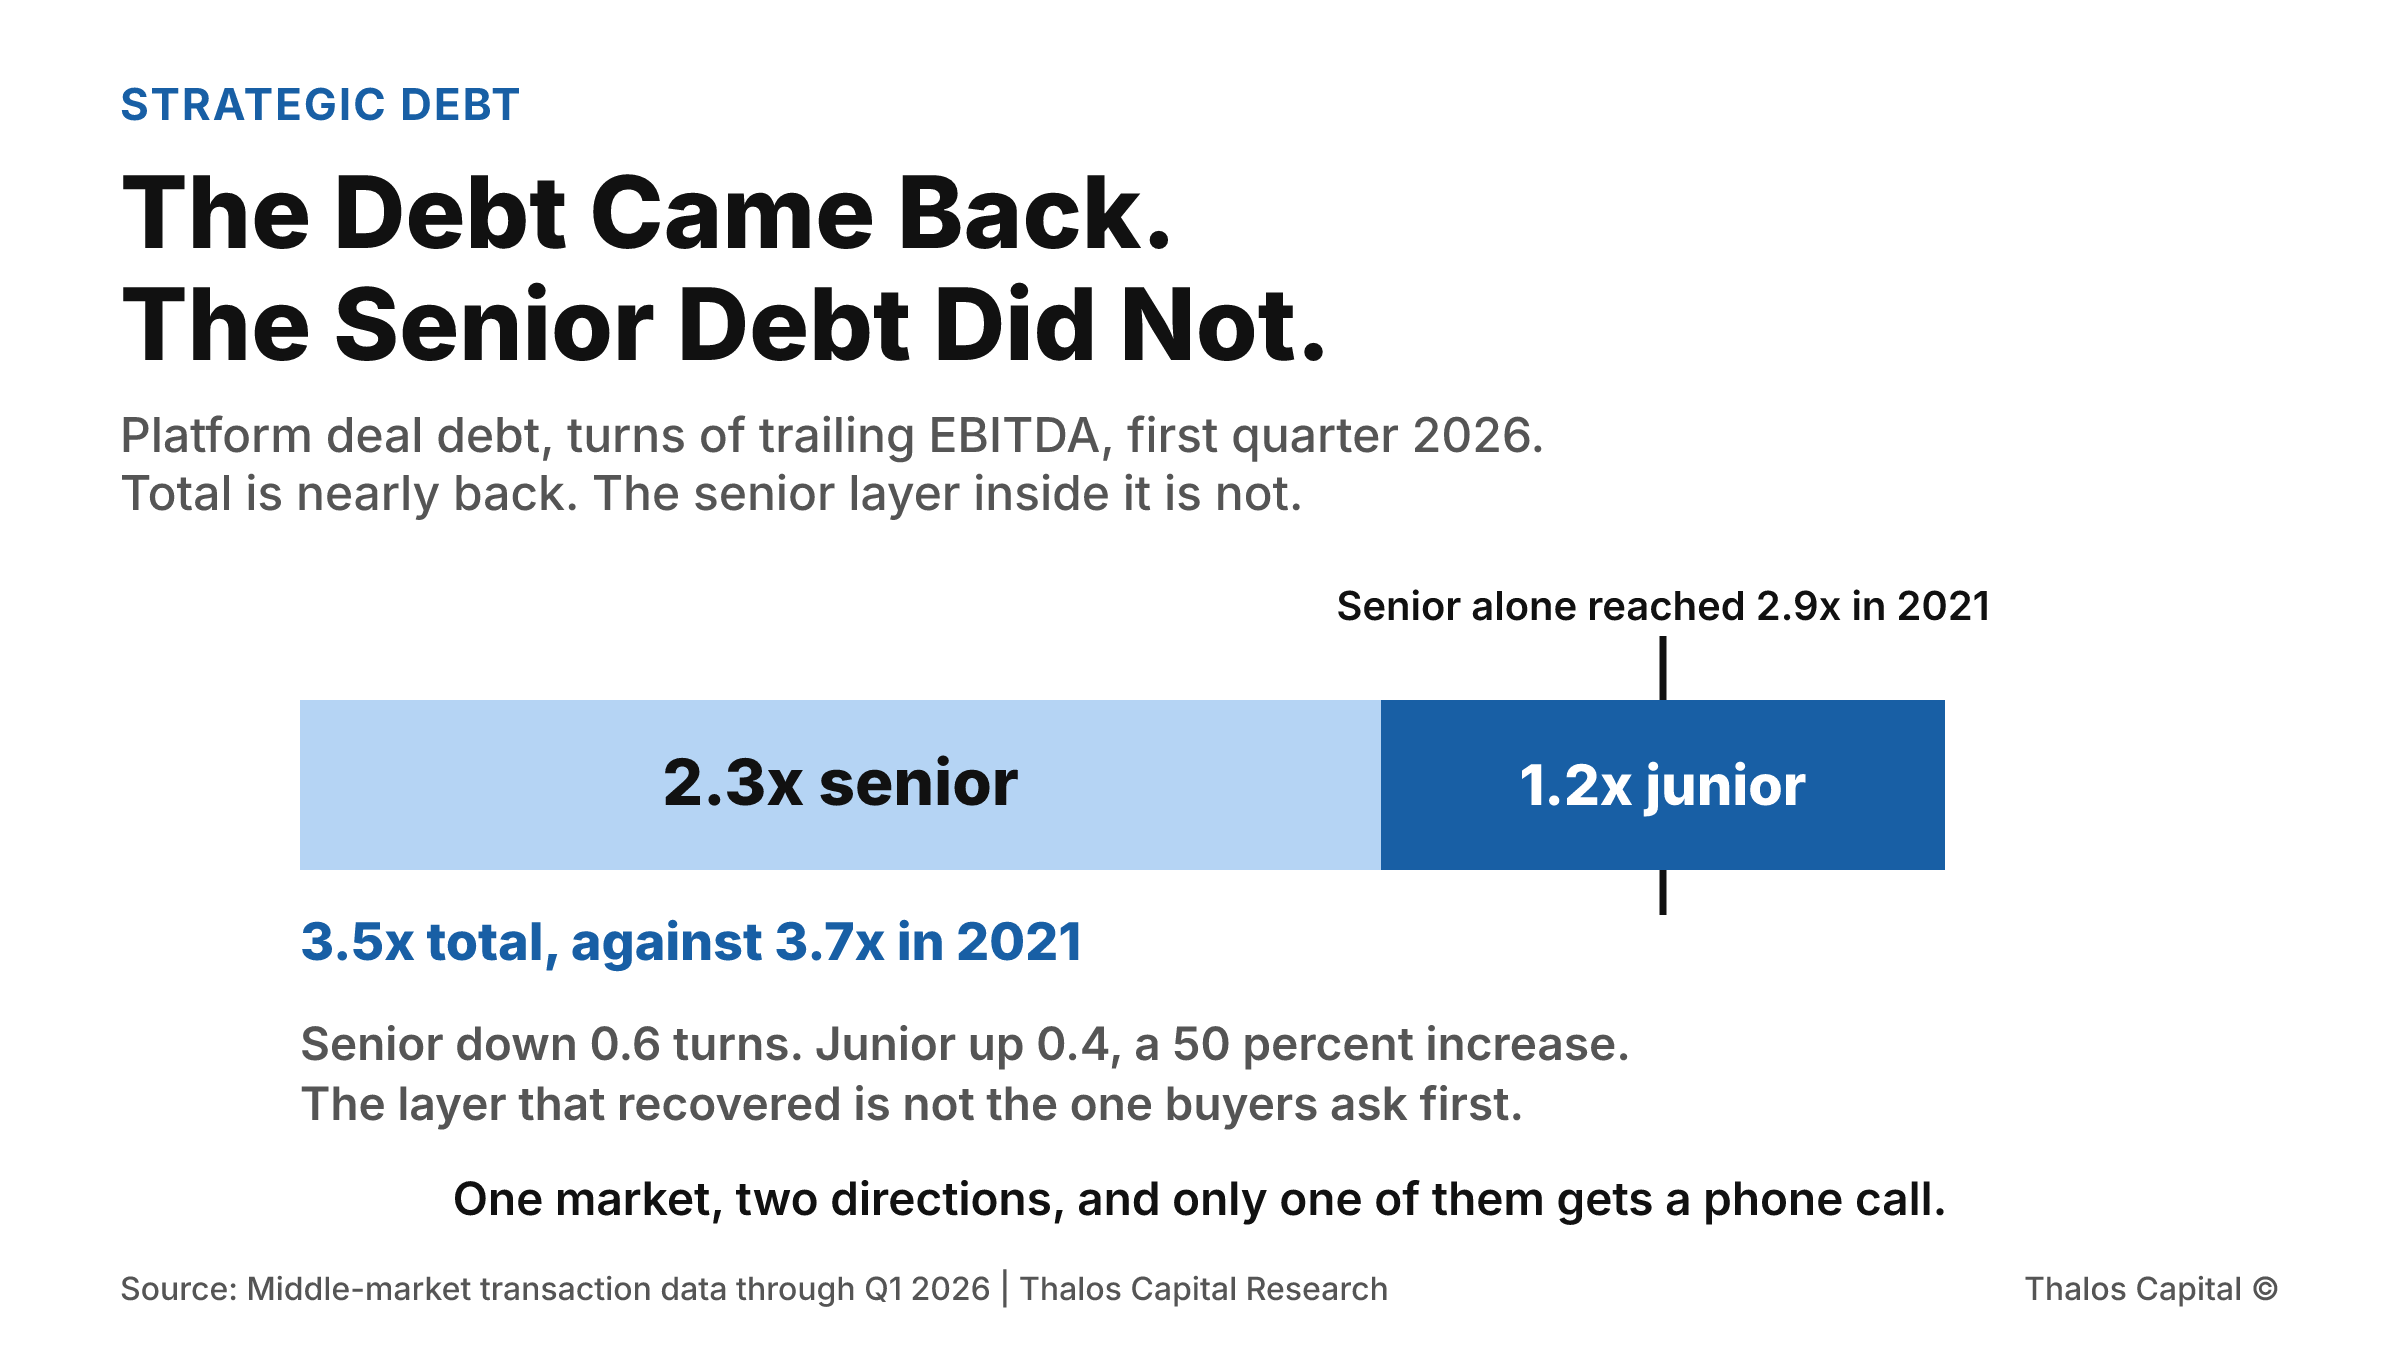
A single stacked bar showing platform deal debt at 3.5 times EBITDA in Q1 2026, split between 2.3 times of senior debt and 1.2 times of junior capital, with a marker showing that senior debt alone reached 2.9 times in 2021.

The Debt Came Back. The Senior Debt Did Not.

Acquisition leverage has recovered to roughly where it stood at the 2021 peak. On platform deals the senior layer has not, and the gap was filled by junior capital, which is not the pool most buyers approach first.
Read More
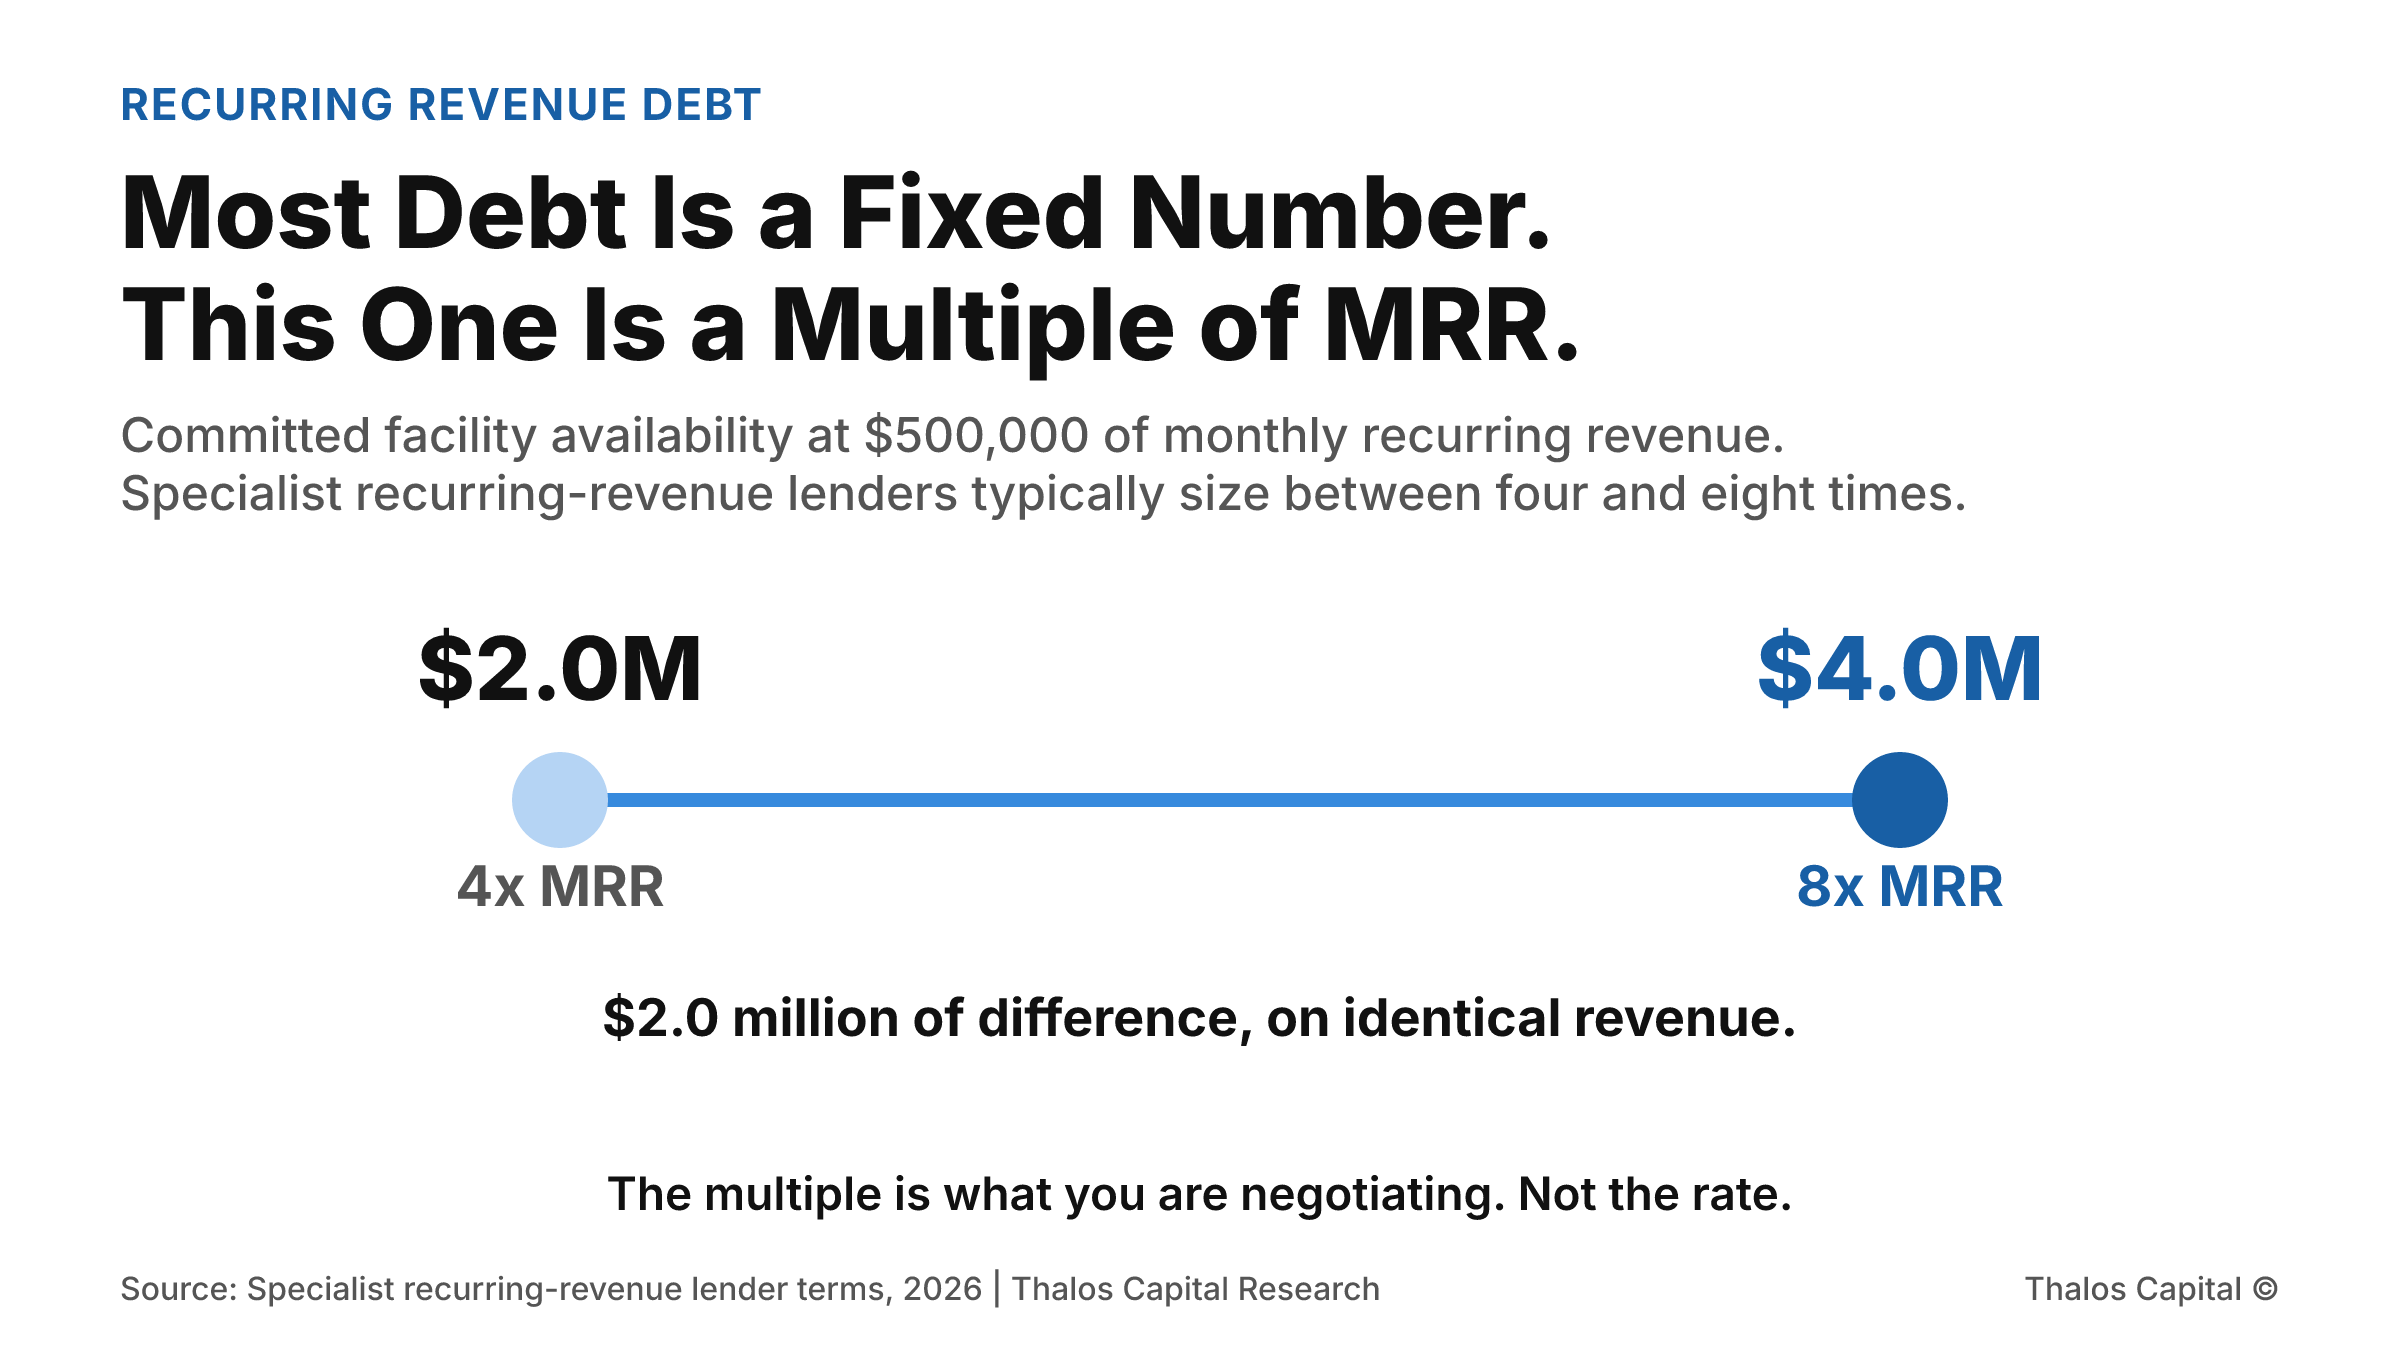
A two-point range showing that a company at $500,000 of monthly recurring revenue can access $2.0 million at a four times multiple or $4.0 million at eight times, a $2.0 million spread on identical revenue.

Most Debt Is a Fixed Number. This One Is a Multiple of MRR.

A term loan is sized once and never changes. A committed facility against recurring revenue is sized as a multiple of monthly revenue, and availability rises as that revenue rises, without a second underwriting.
Read More
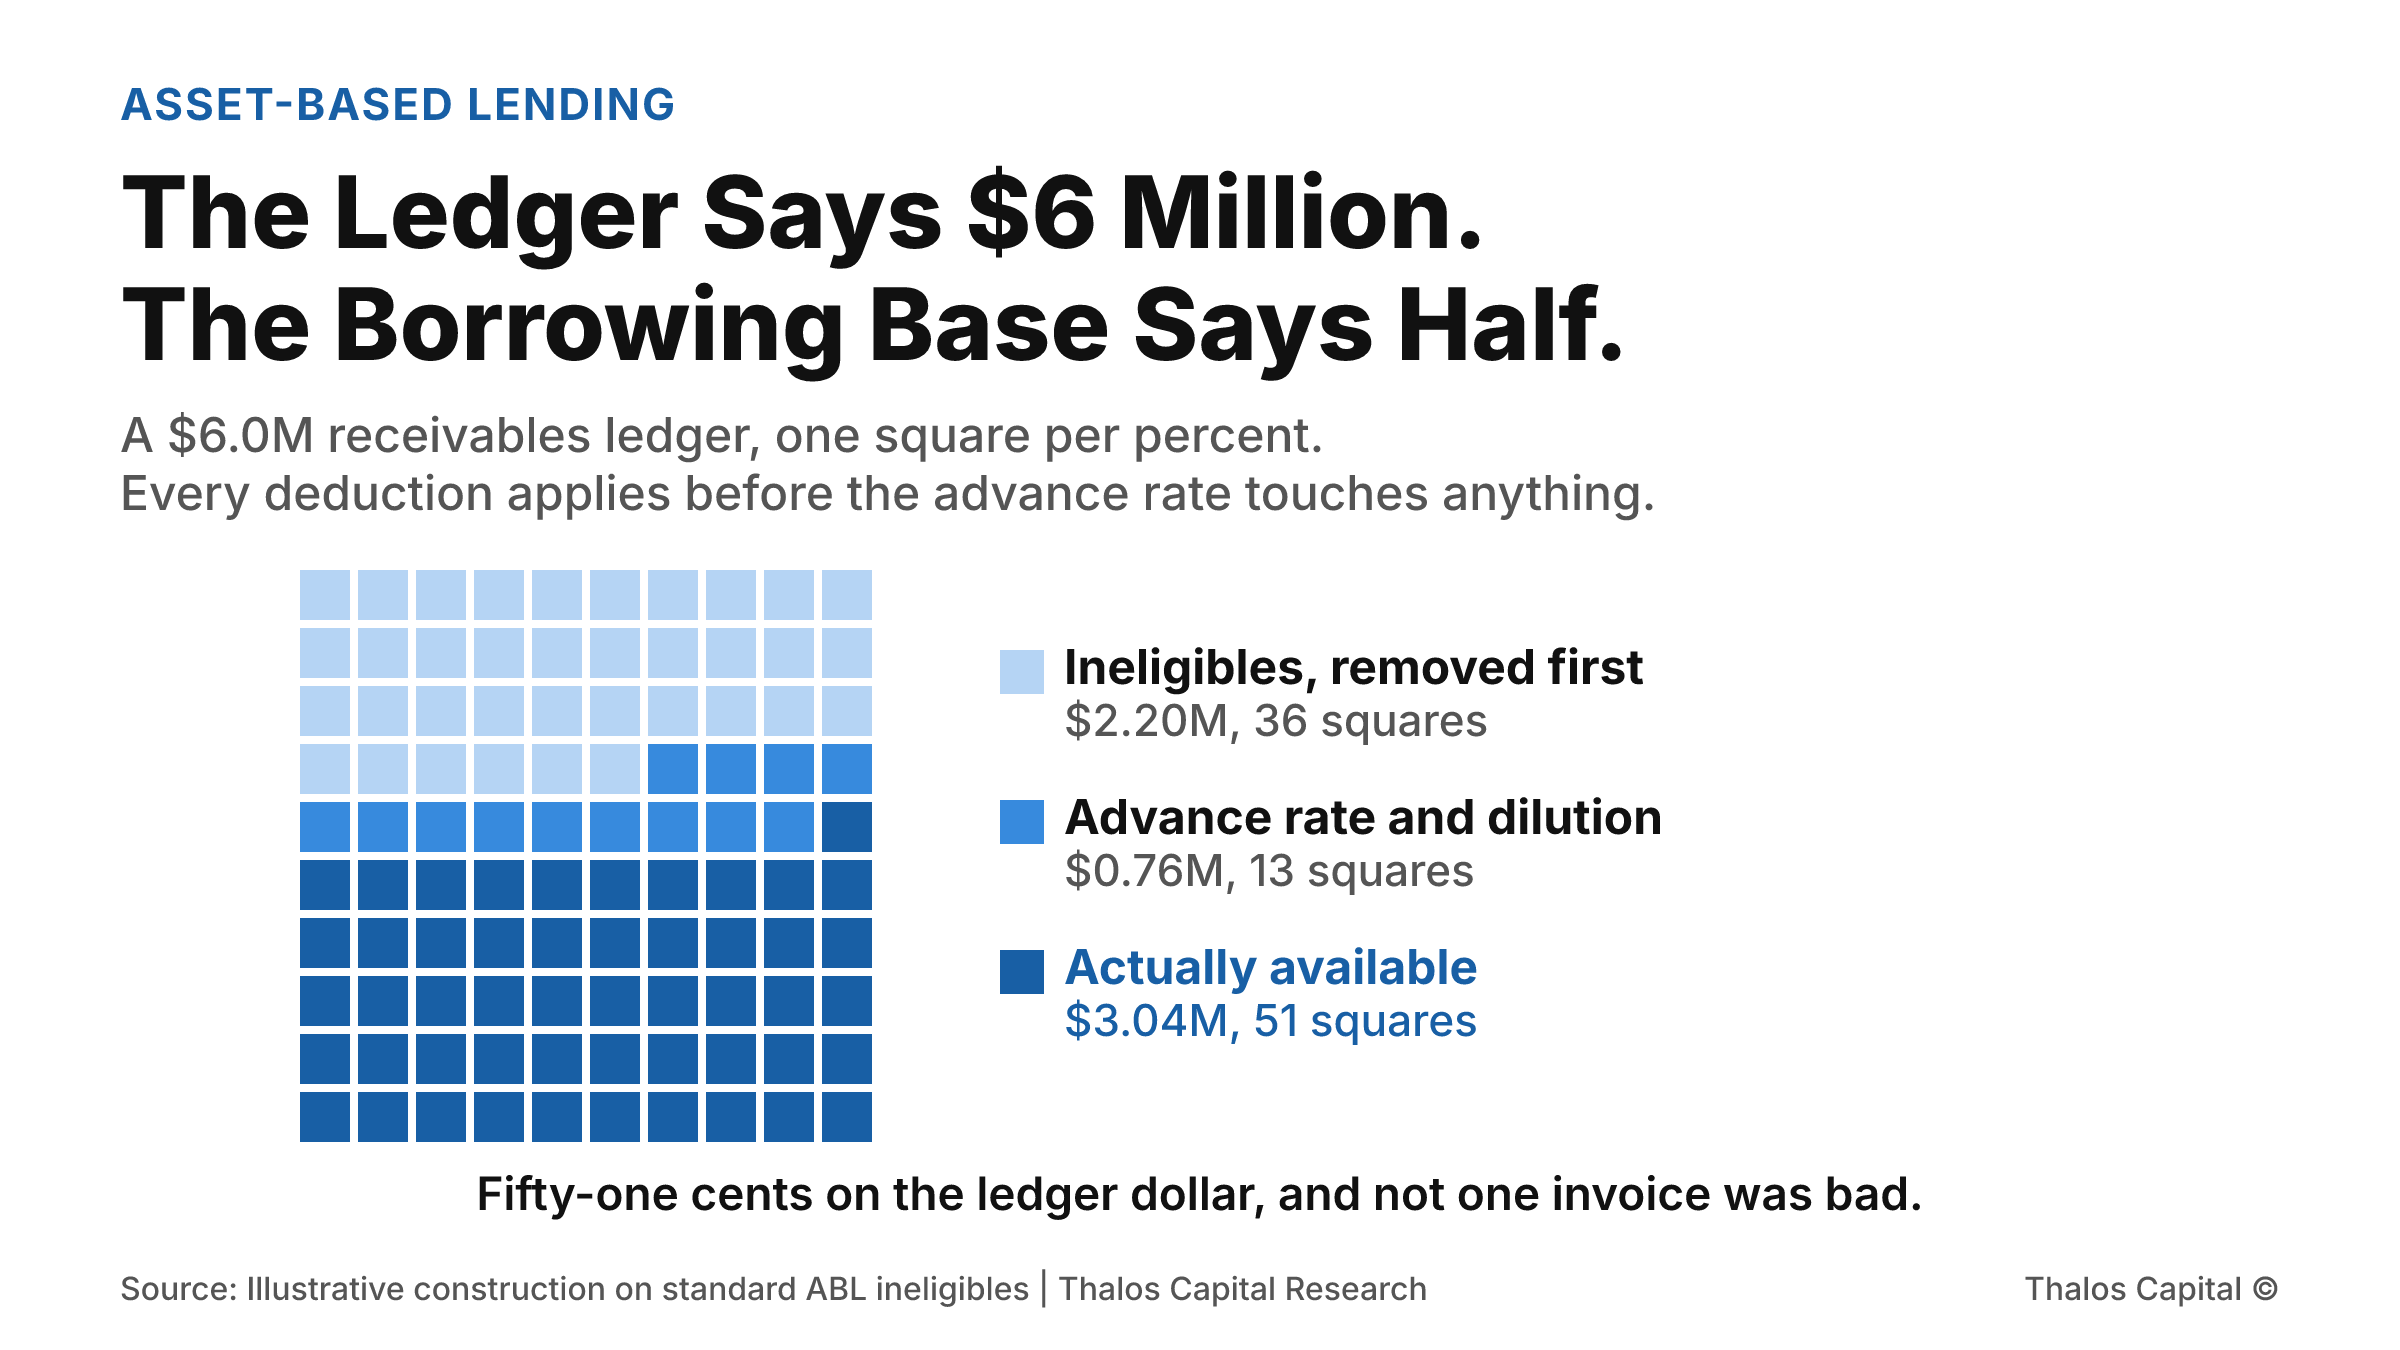
A hundred-square waffle of a $6 million receivables ledger showing 36 squares removed as ineligibles, 13 squares taken by the advance rate and dilution reserve, and 51 squares of actual availability at $3.04 million.

The Ledger Says $6 Million. The Borrowing Base Says Half.

Advance rate is the number every borrower asks about and the last one applied. Before it touches anything, the ineligibles come out, and on a $6 million receivables ledger they can remove $2.2 million without a single invoice being bad.
Read More
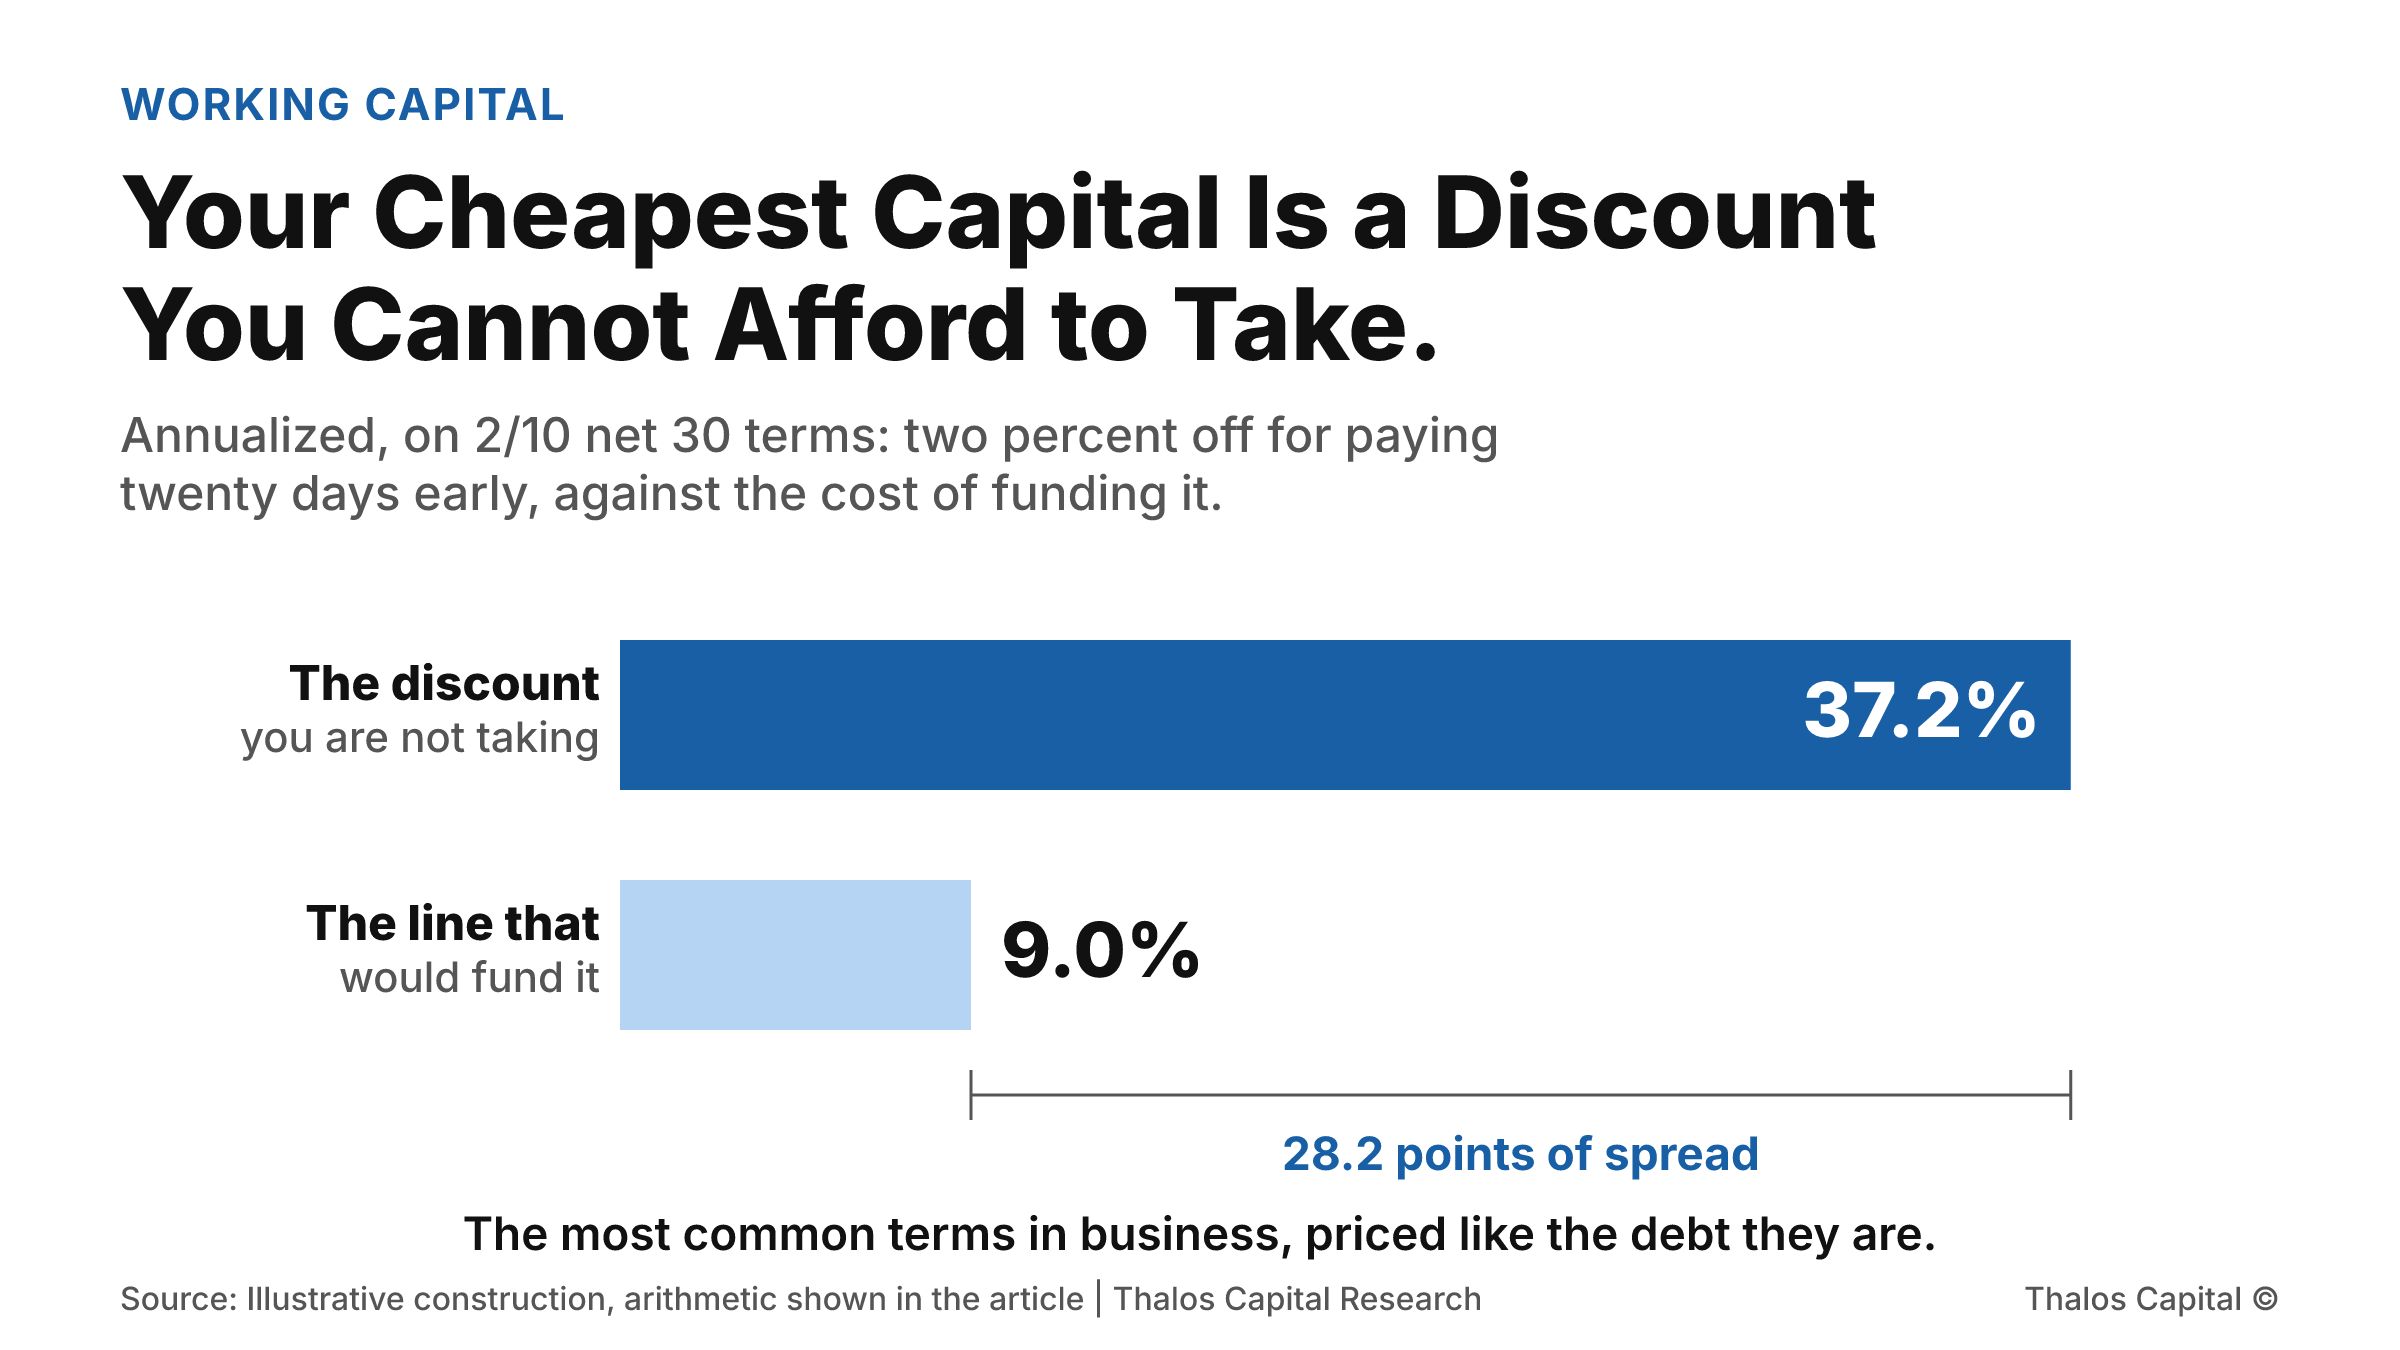
Two horizontal bars comparing the annualized value of a 2/10 net 30 early payment discount at 37.2 percent against the roughly 9 percent all-in cost of a working capital line used to fund it, a spread of 28.2 points.

Your Cheapest Capital Is a Discount You Cannot Afford to Take.

Customers moved from net 30 to net 60, which tied up an extra $1.08 million. The consequence shows up on the other side of the business, where $162,000 of supplier discounts go unclaimed every year because the cash is not there.
Read More
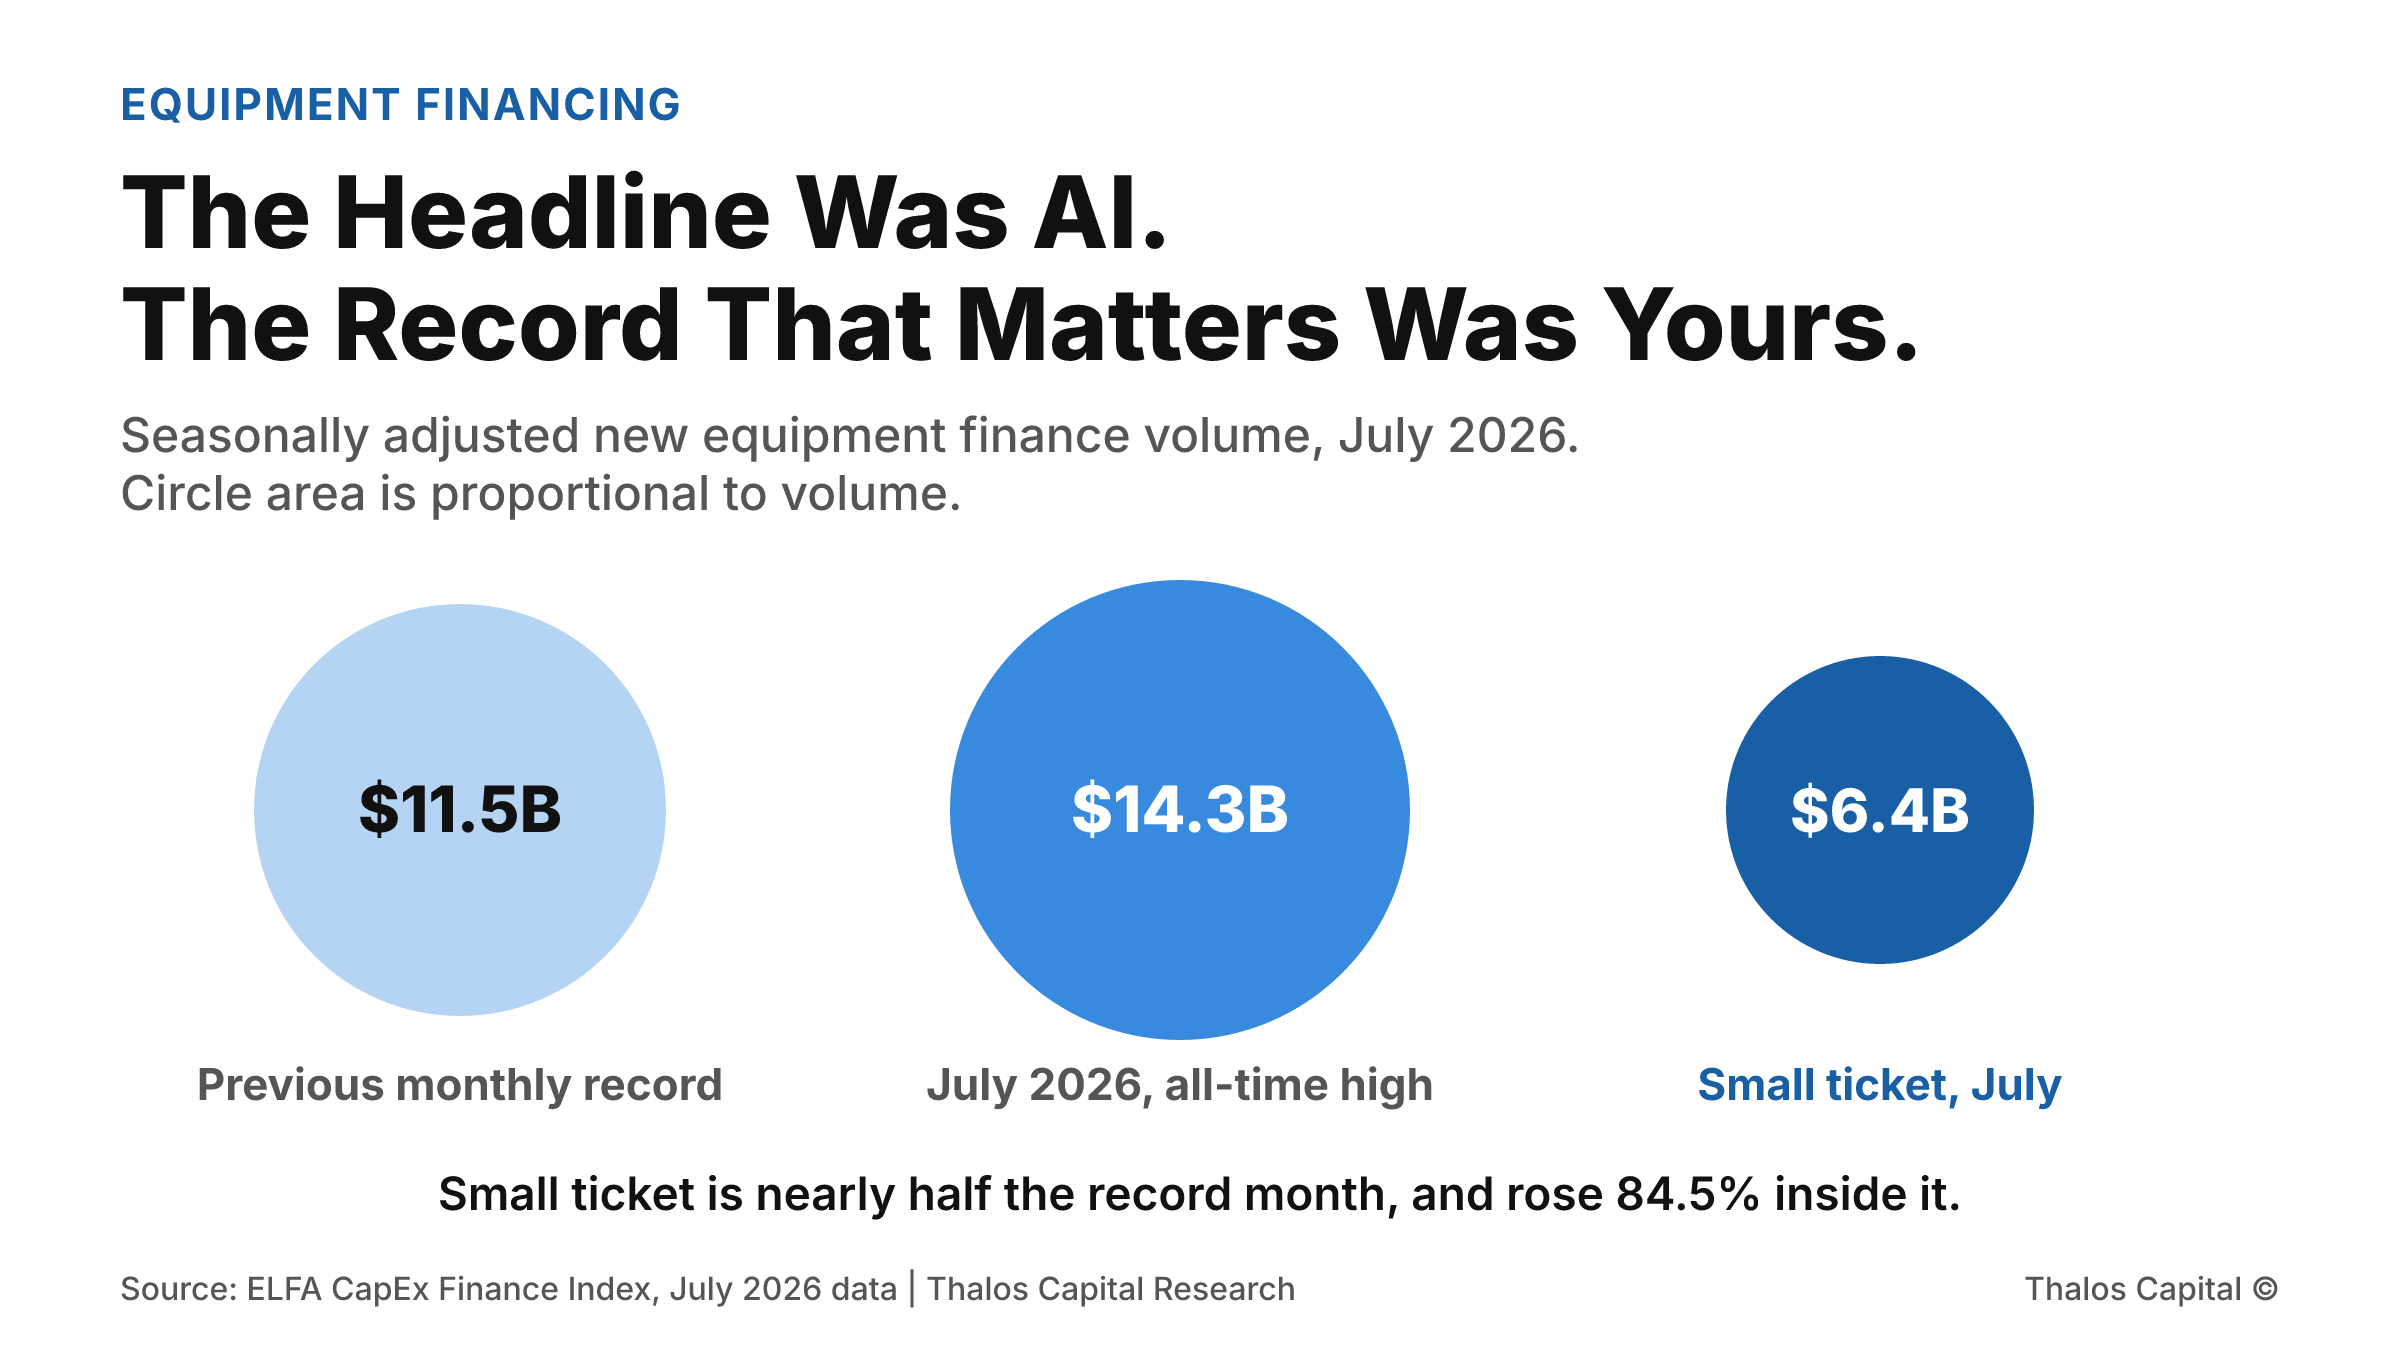
Three proportional circles comparing July 2026 equipment finance volume of $14.3 billion against the previous all-time monthly high of $11.5 billion, with small-ticket volume of $6.4 billion shown as nearly half of the record month.

The Headline Was AI. The Record That Matters Was Yours.

July set an all-time monthly record in equipment finance, and the coverage credited AI capital expenditure. Small-ticket volume set its own record in the same month, up 84.5 percent, and that is the segment mid-market borrowers actually borrow in.
Read More
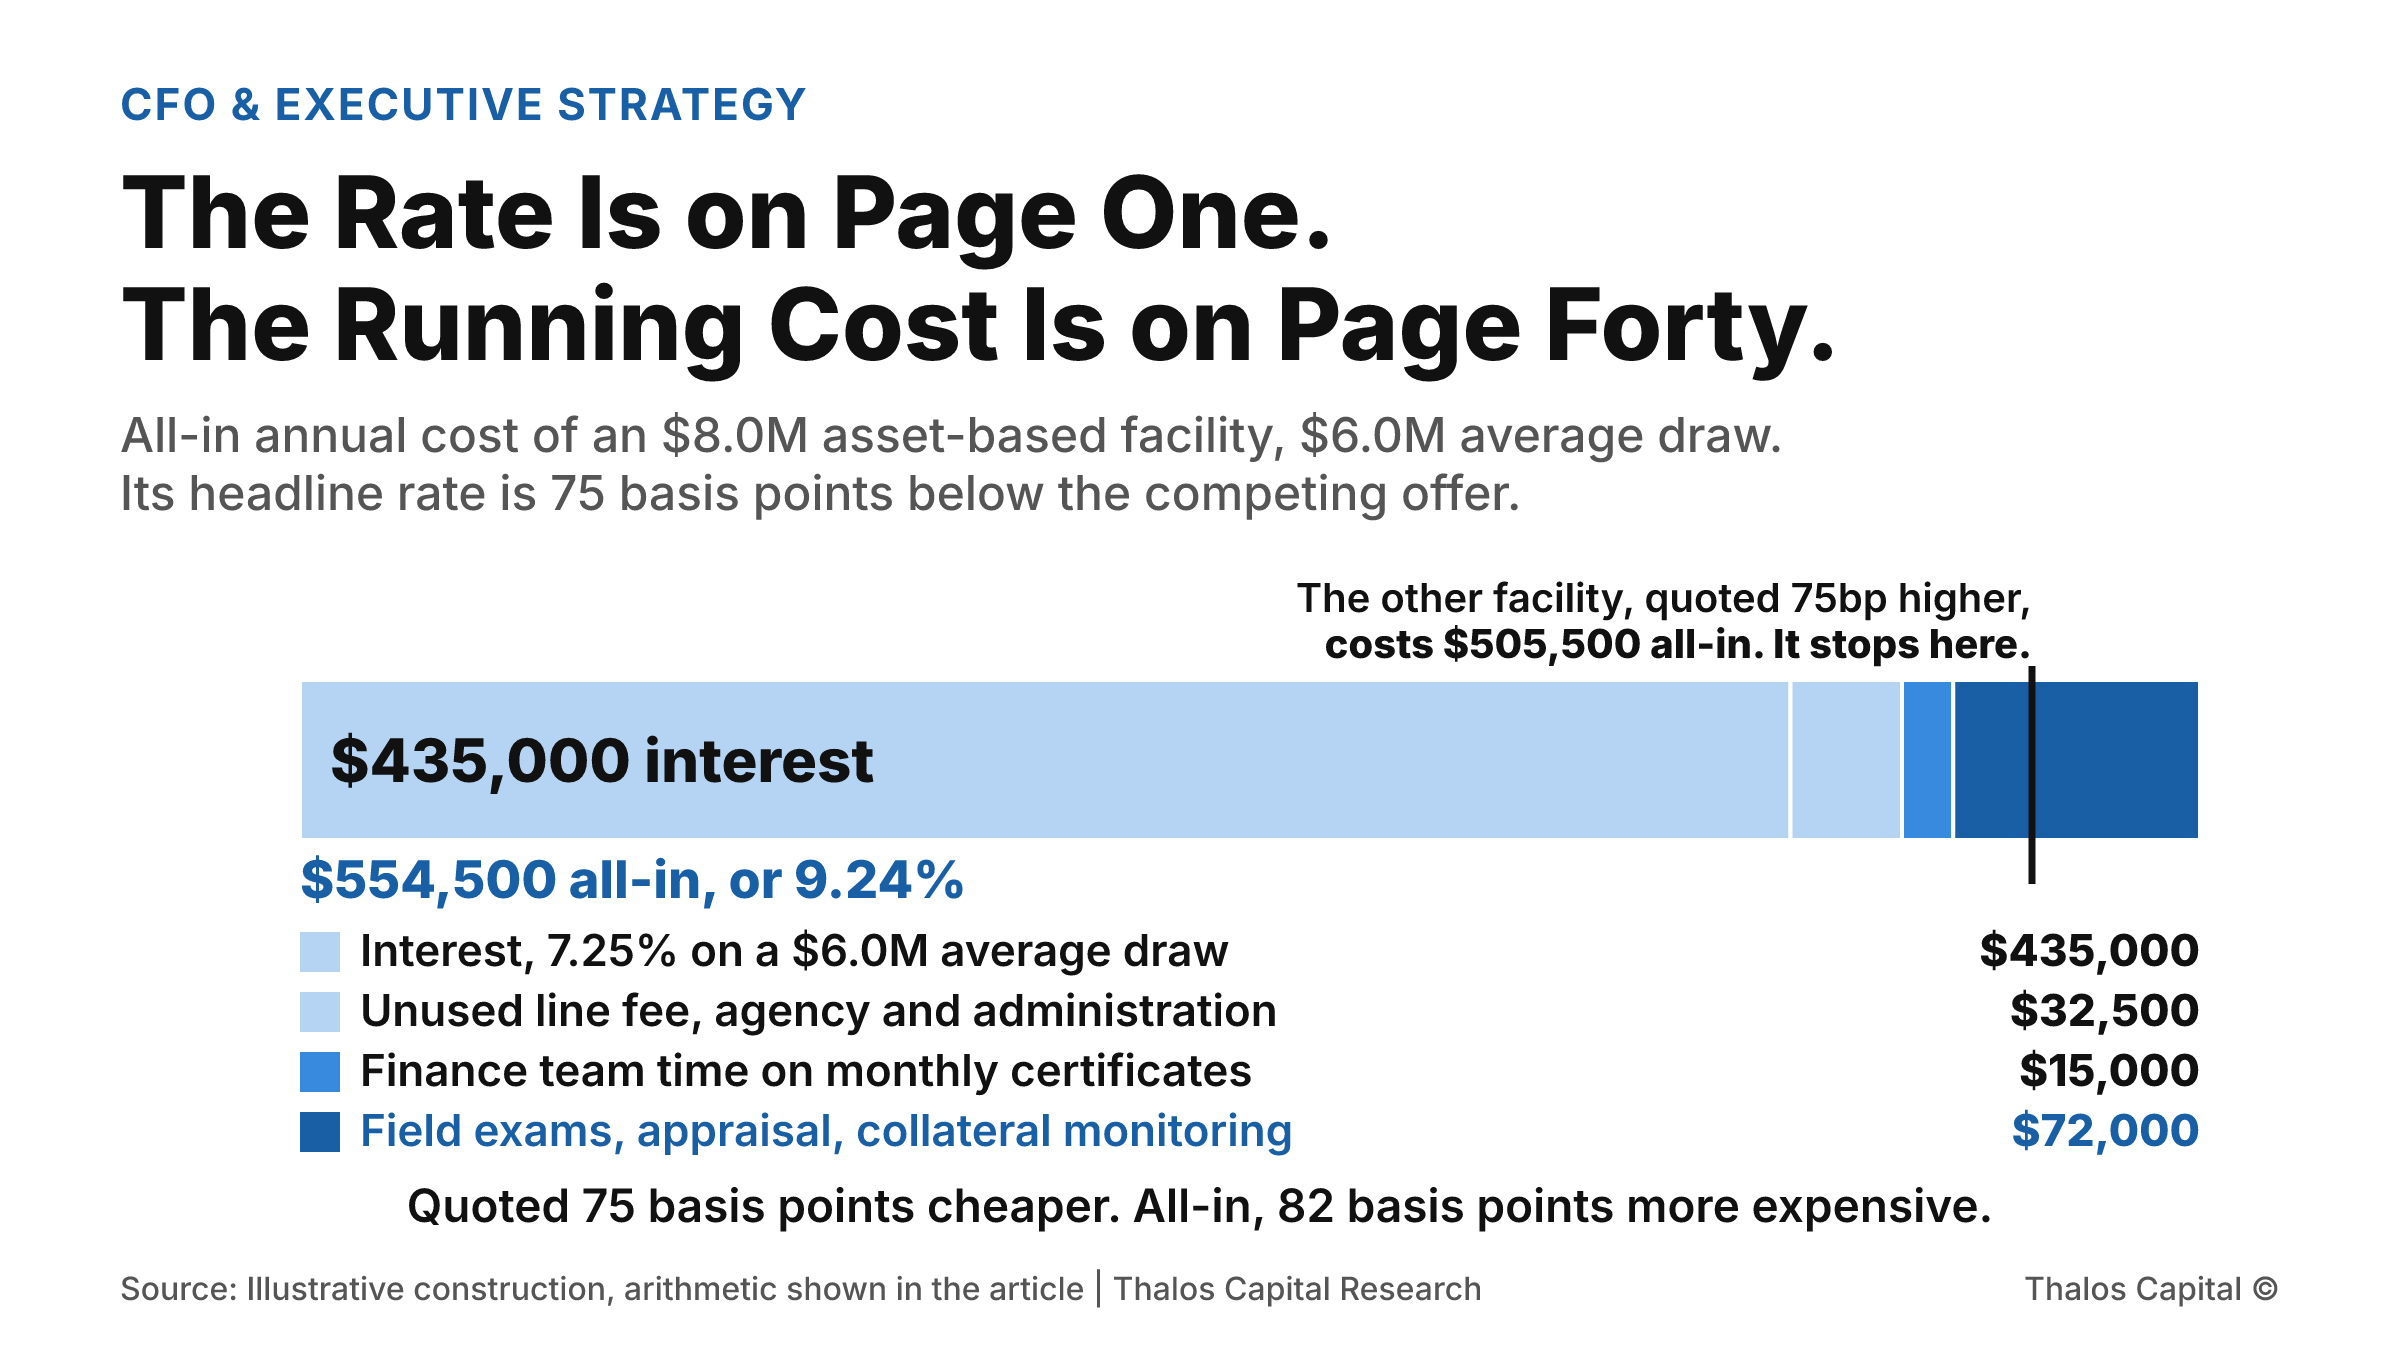
A single stacked bar of the all-in annual cost of an $8.0 million asset-based facility at a $6.0 million average draw, totalling $554,500, with a marker showing that a competing facility quoted 75 basis points higher costs $505,500 all-in.

The Rate Is on Page One. The Running Cost Is on Page Forty.

Two facilities quoted 75 basis points apart. Once field exams, appraisals, collateral monitoring and the finance team's own hours are counted, the cheaper-looking one costs 82 basis points more to run. The gap reverses entirely.
Read More
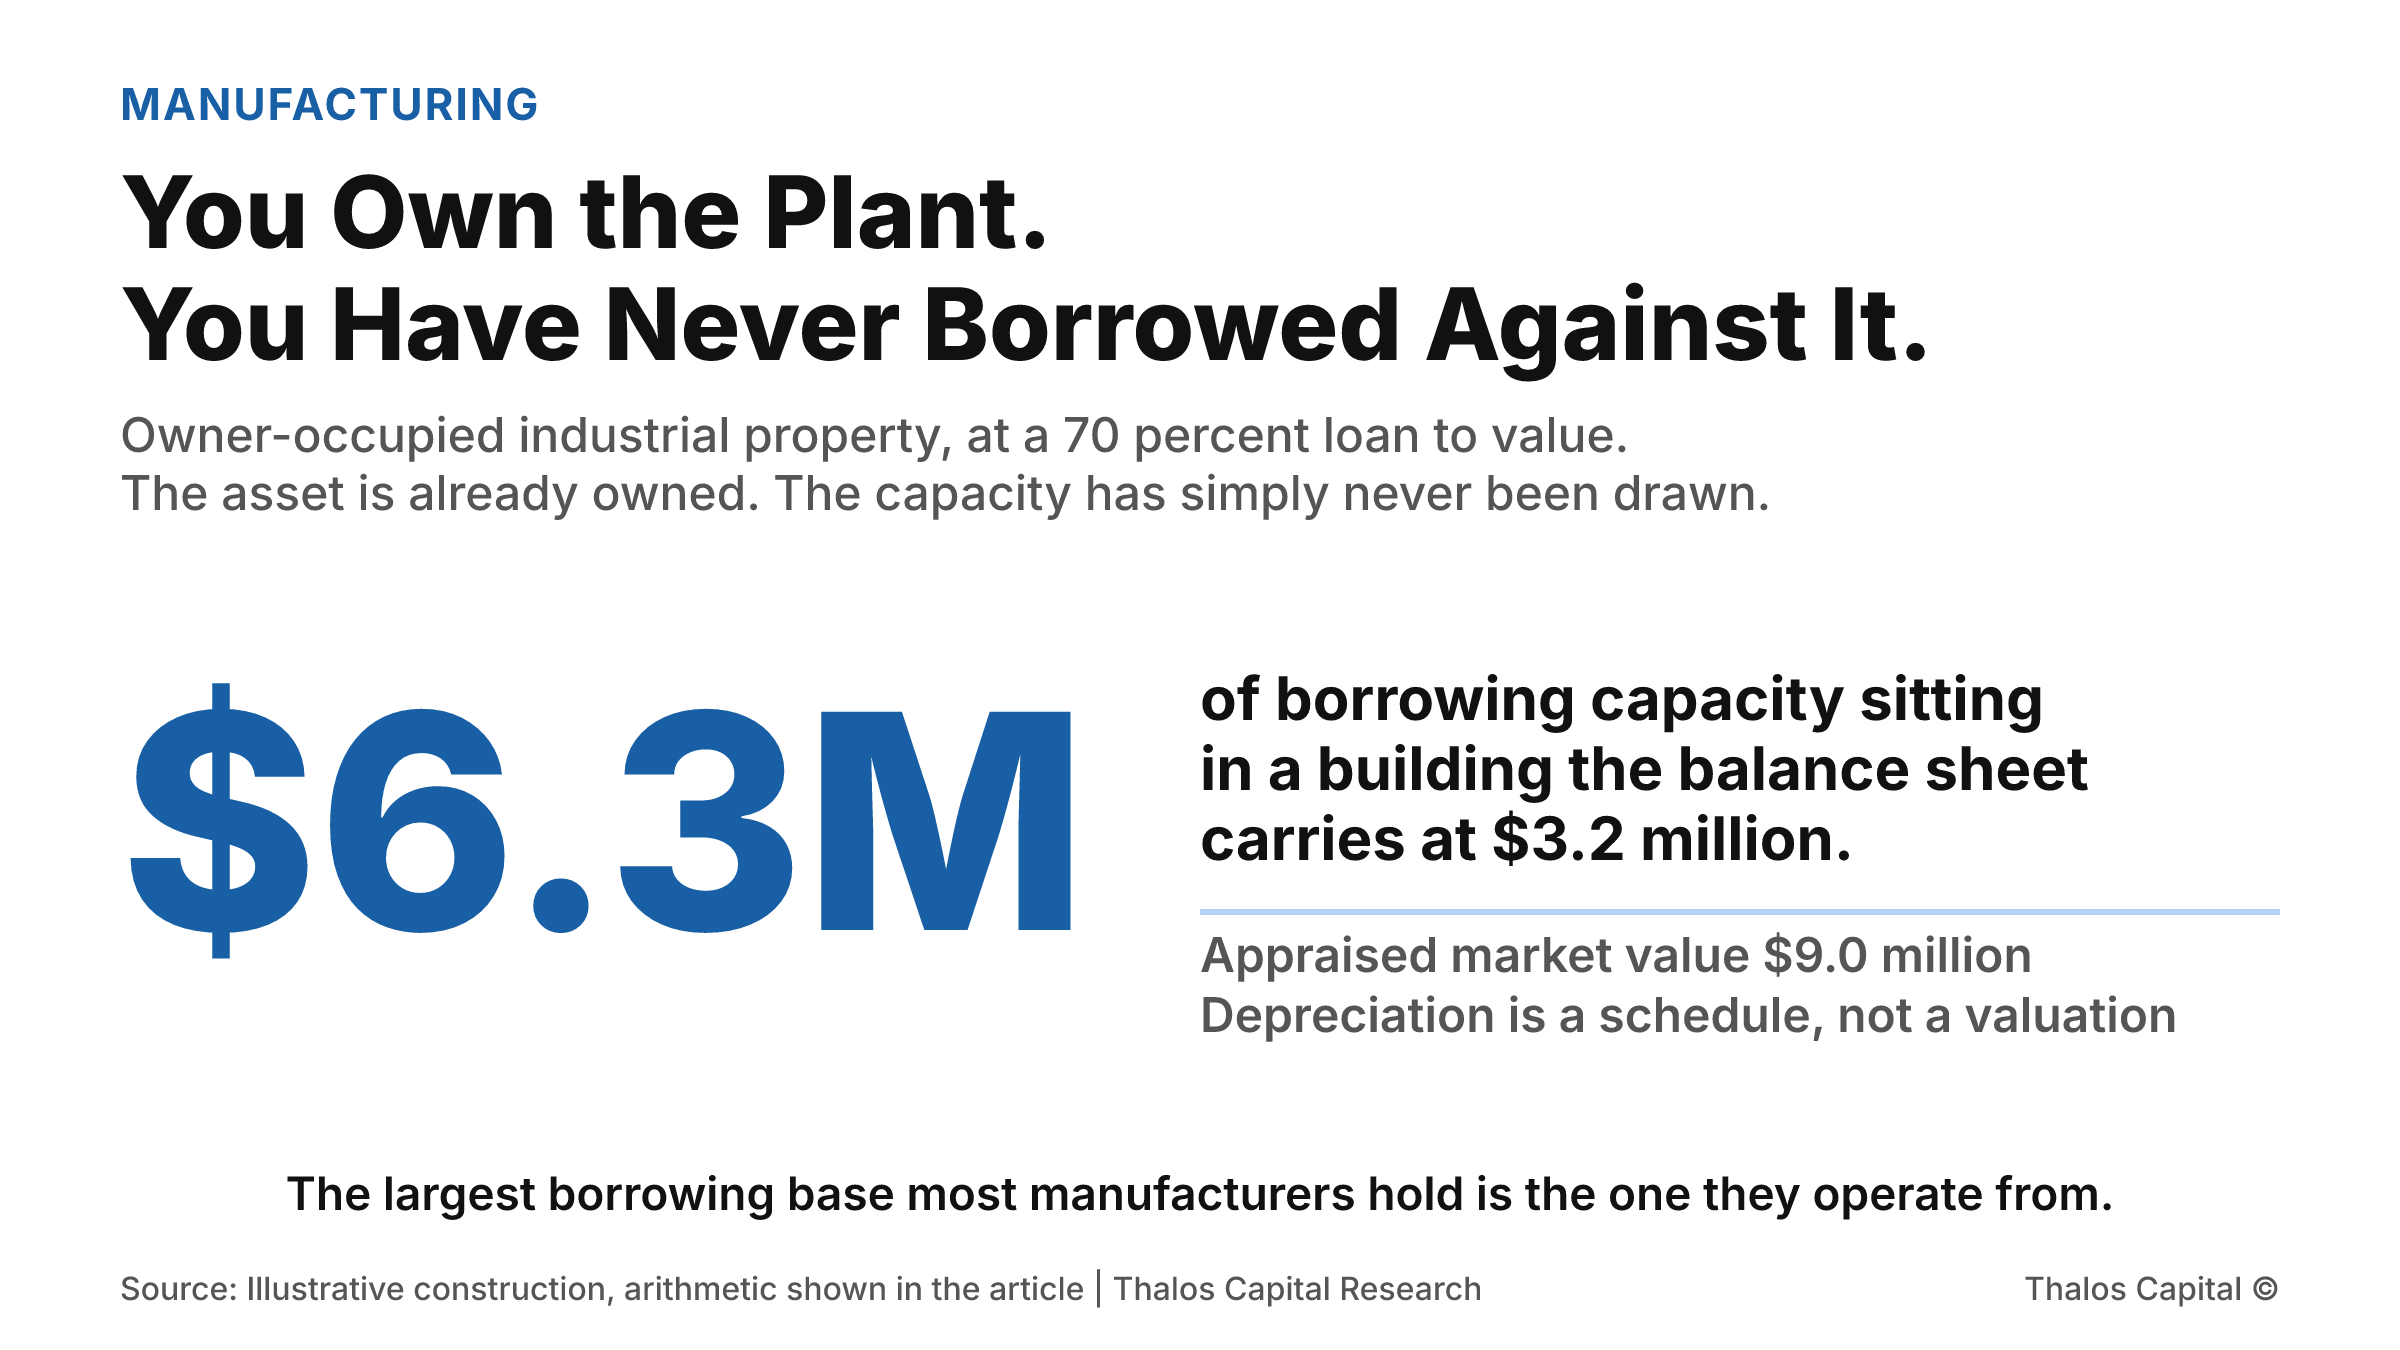
A single large figure of $6.3 million of borrowing capacity available against an owner-occupied manufacturing plant at a 70 percent loan to value, set against the $3.2 million depreciated book value the balance sheet carries and a $9.0 million market value.

You Own the Plant. You Have Never Borrowed Against It.

A manufacturer finances equipment and receivables while its largest asset sits untouched, carried at a depreciated book value that hides what it is worth. Two routes convert it to cash, and only one of them is a loan.
Read More
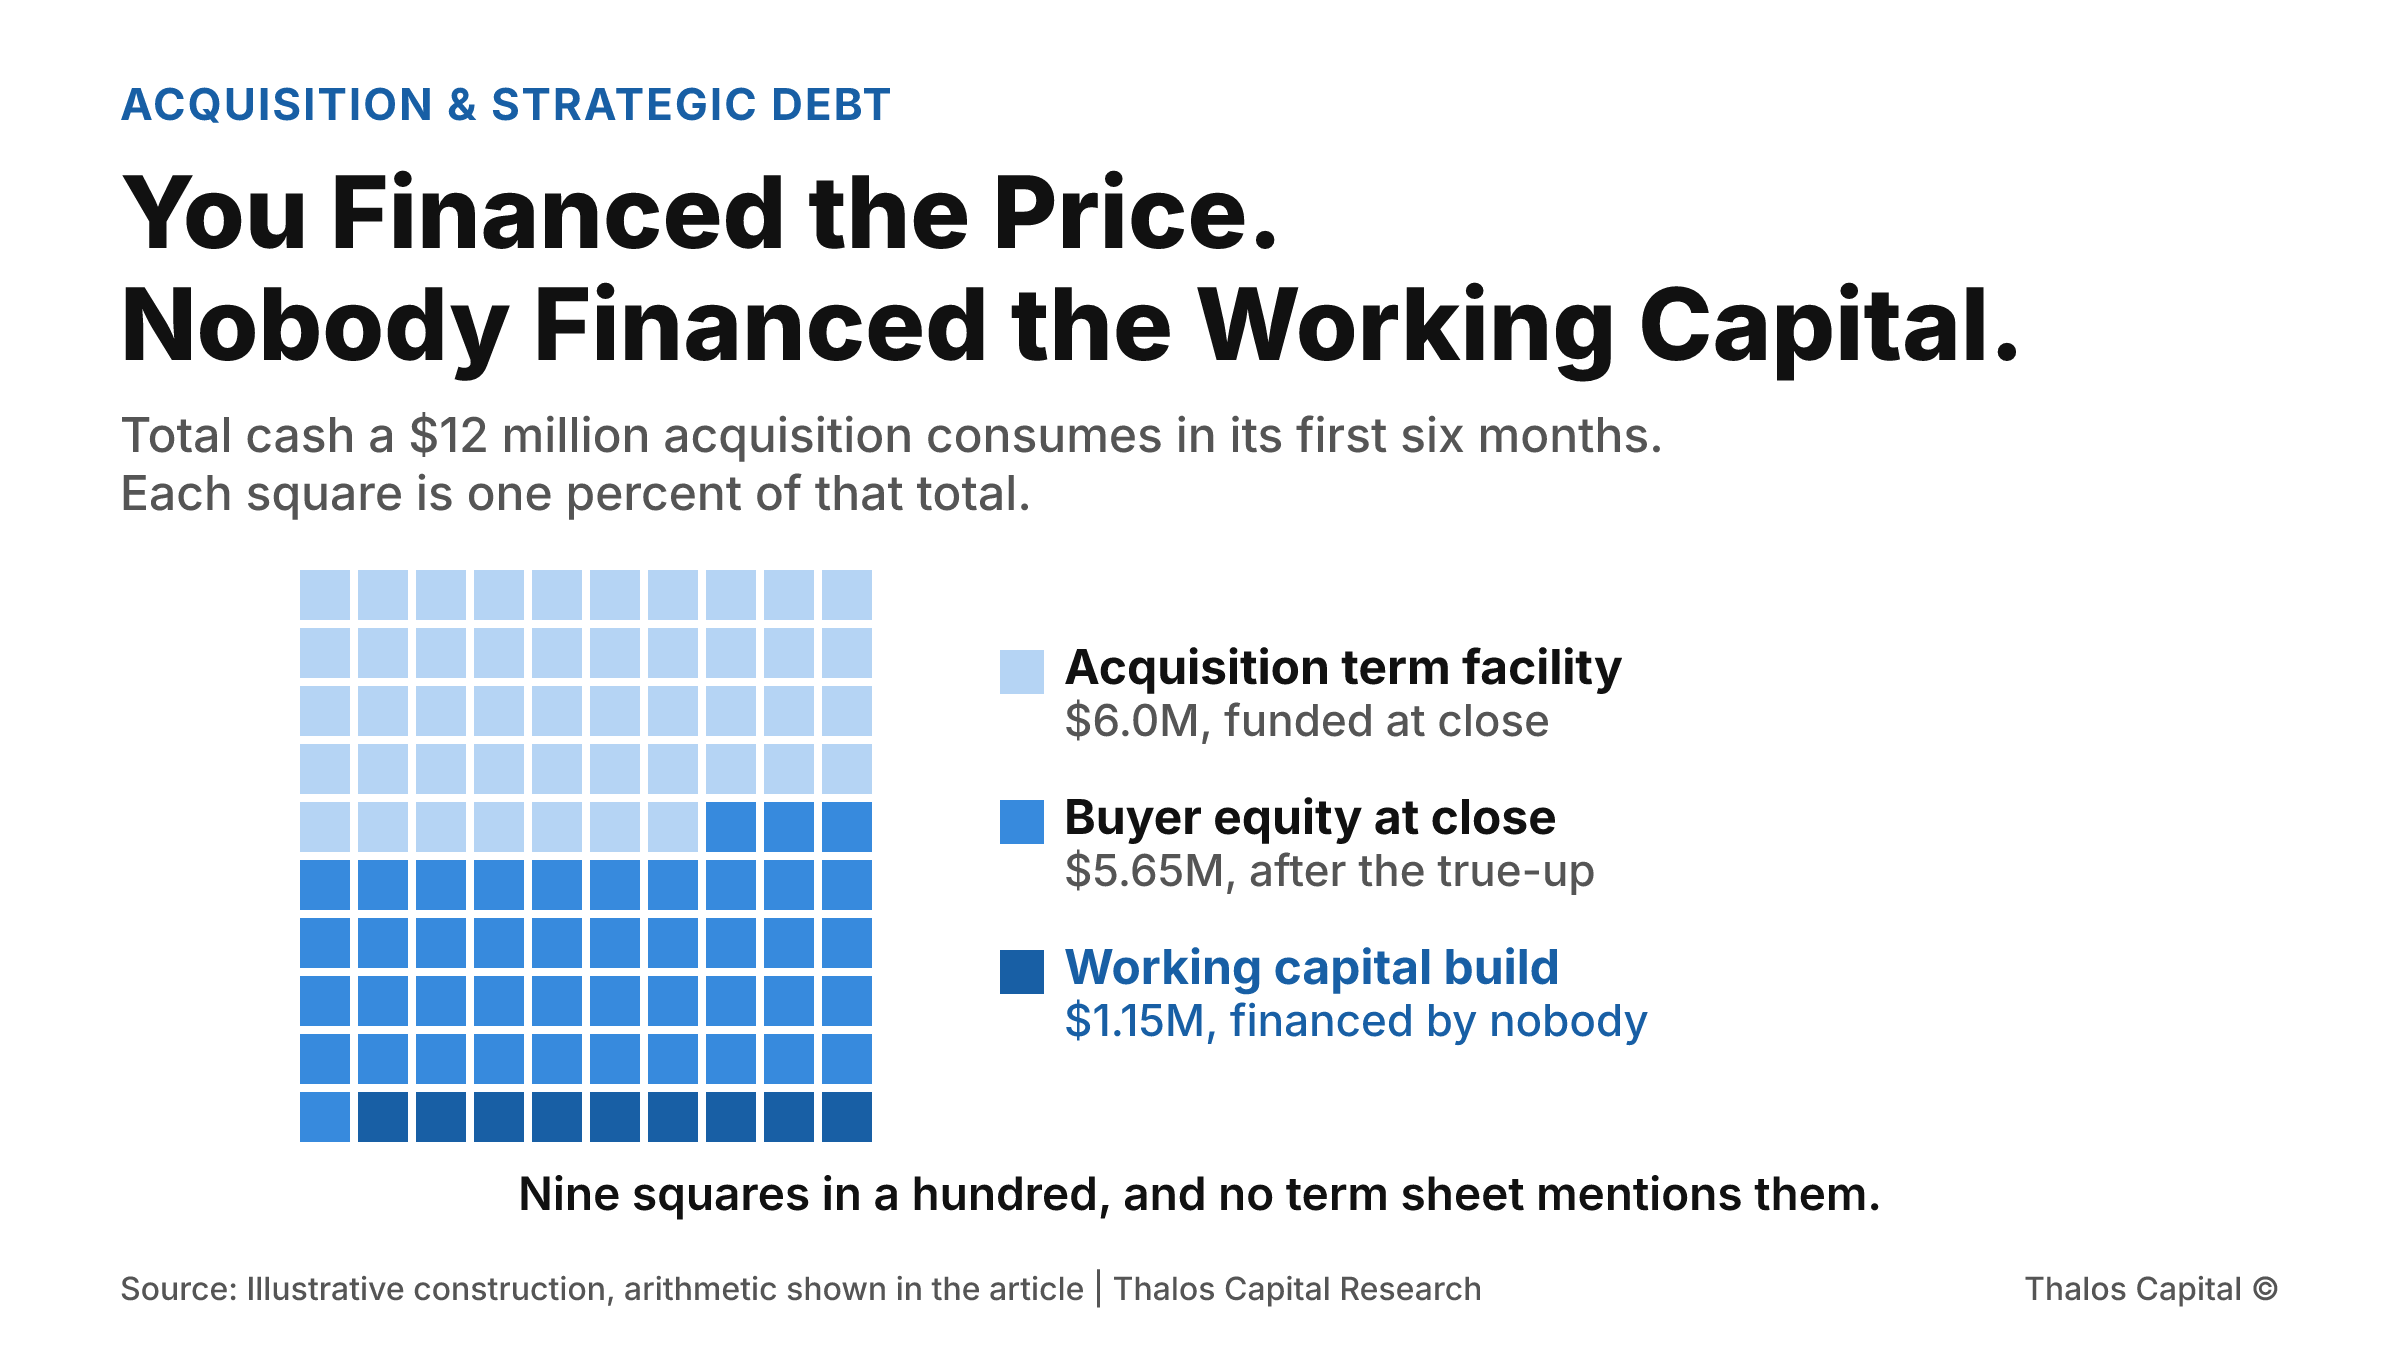
A hundred-square waffle showing the total cash a $12 million acquisition consumes in its first six months: 47 squares funded by the acquisition term facility, 44 by buyer equity at close, and 9 by a working capital build that sits outside the deal model.

You Financed the Price. Nobody Financed the Working Capital.

A buyer models an acquisition as price minus debt equals equity. Then the working capital true-up lands, and the seasonal build after it. The cash required is the same whichever month the deal closes, and the acquisition facility funds none of it.
Read More
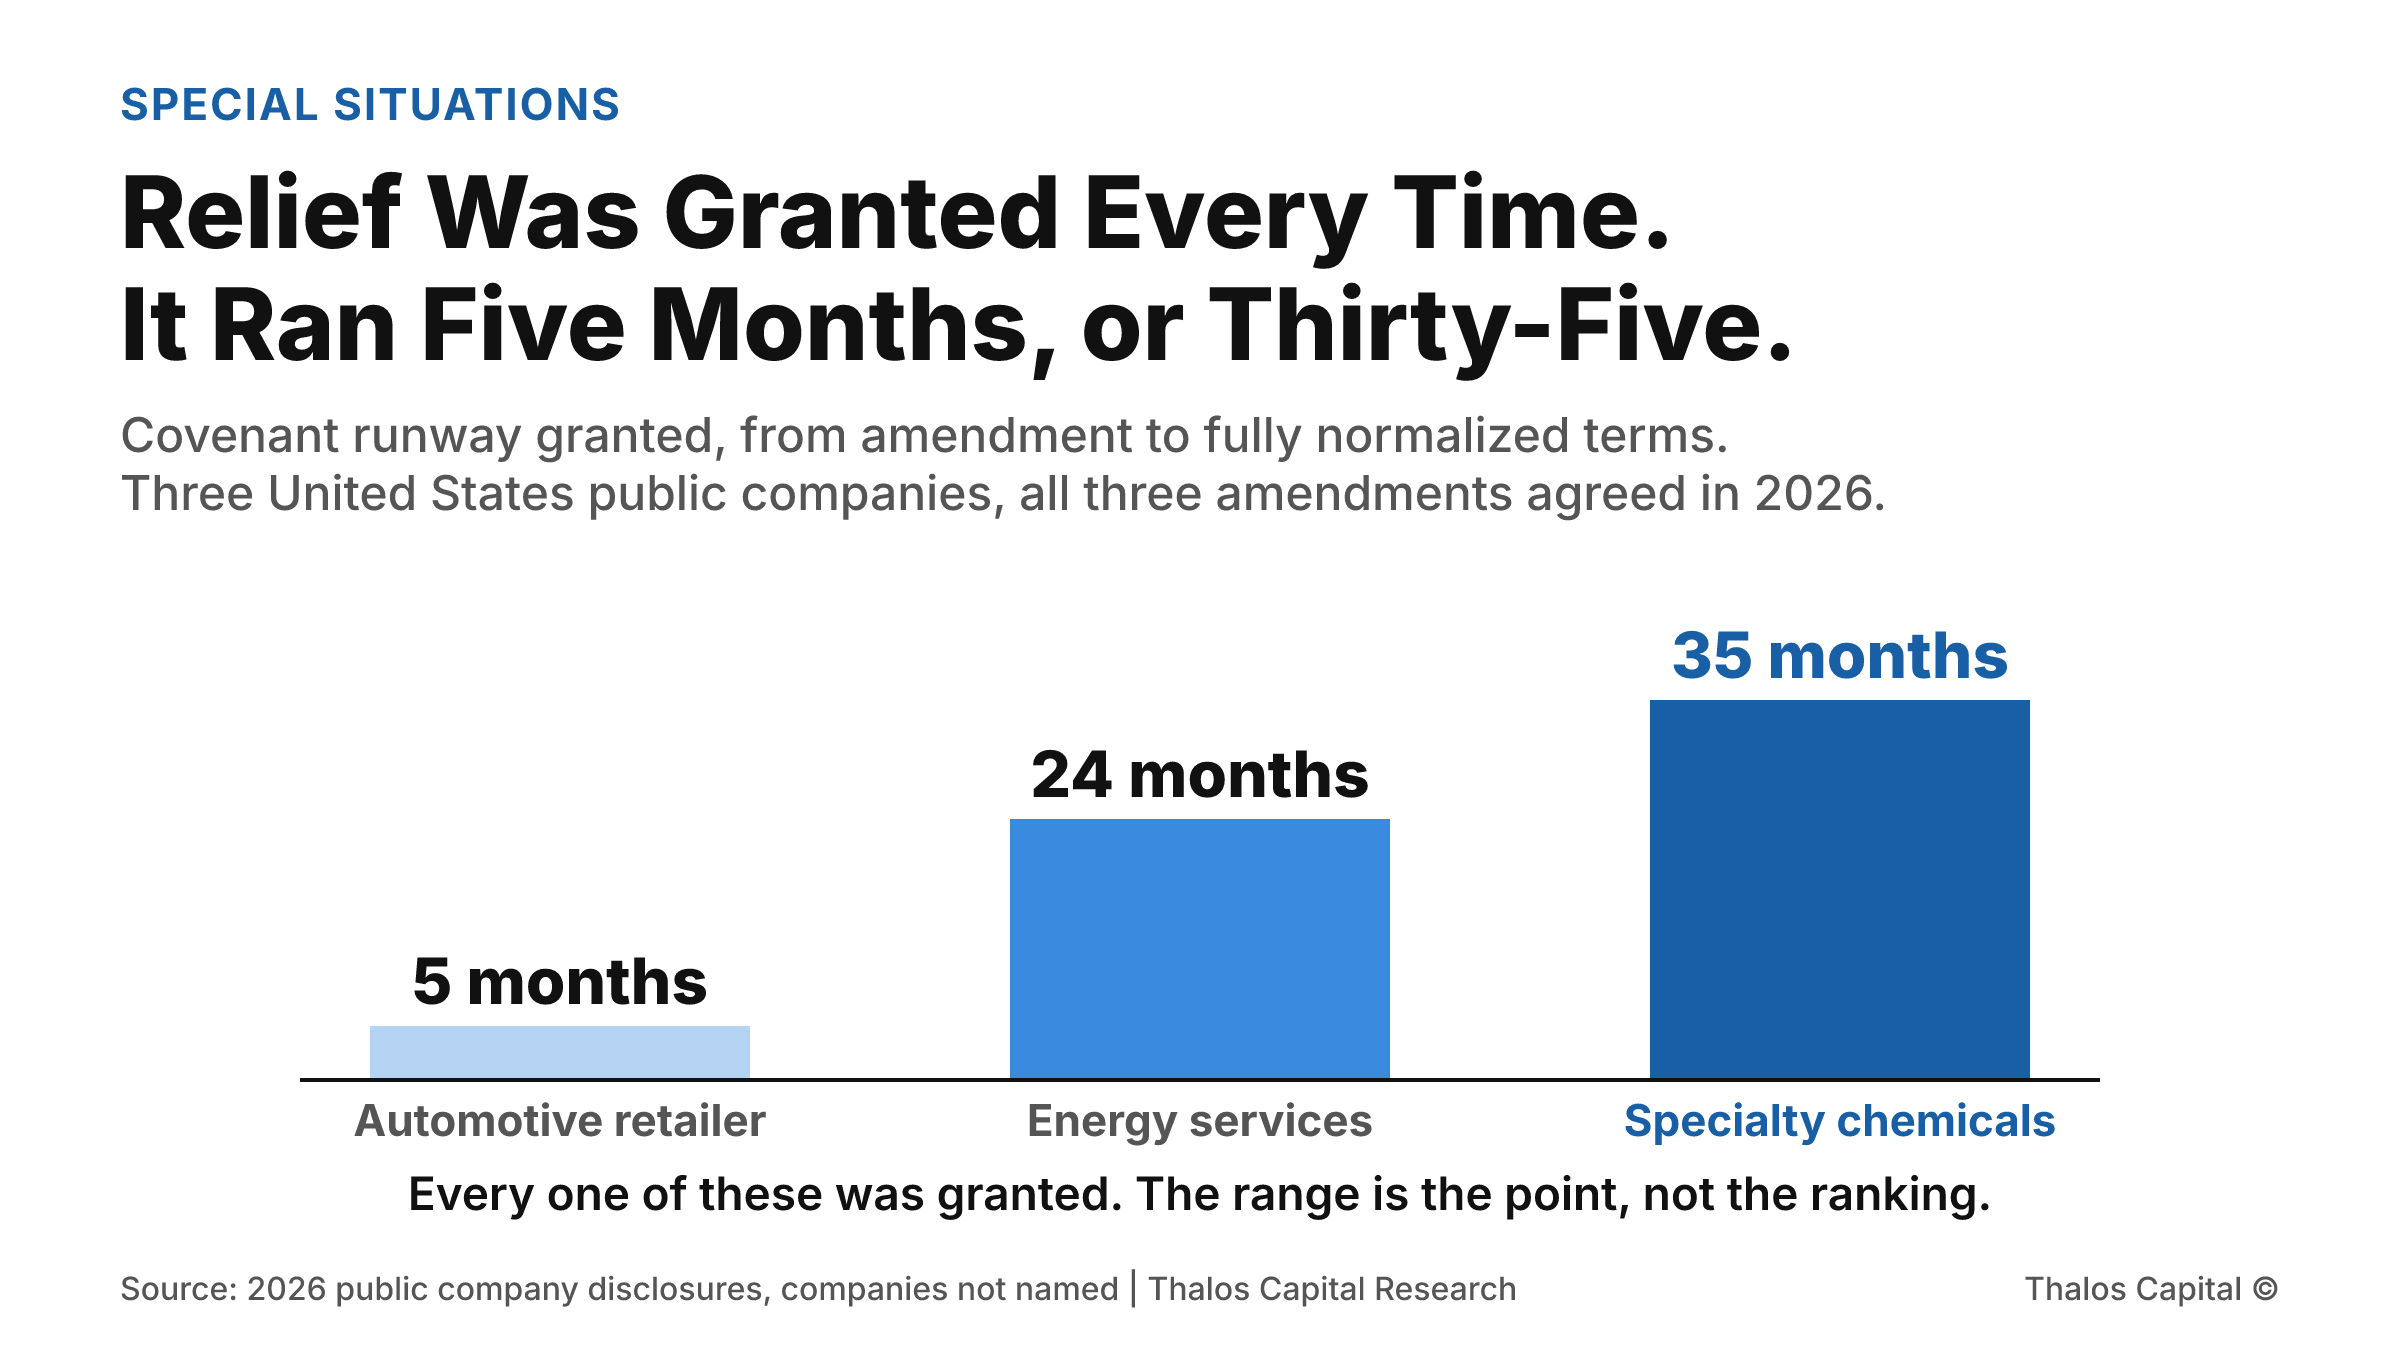
Three columns comparing covenant runway granted in 2026 amendments by three United States public companies: about five months for an automotive retailer, twenty-four months for an energy services company, and thirty-five months for a specialty chemicals company.

Relief Was Granted Every Time. It Ran Five Months, or Thirty-Five.

Three United States public companies disclosed covenant amendments in 2026. Every creditor group said yes. One got a conditional bridge of a few months, another two years, a third nearly three. The breach severity is not what separated them.
Read More
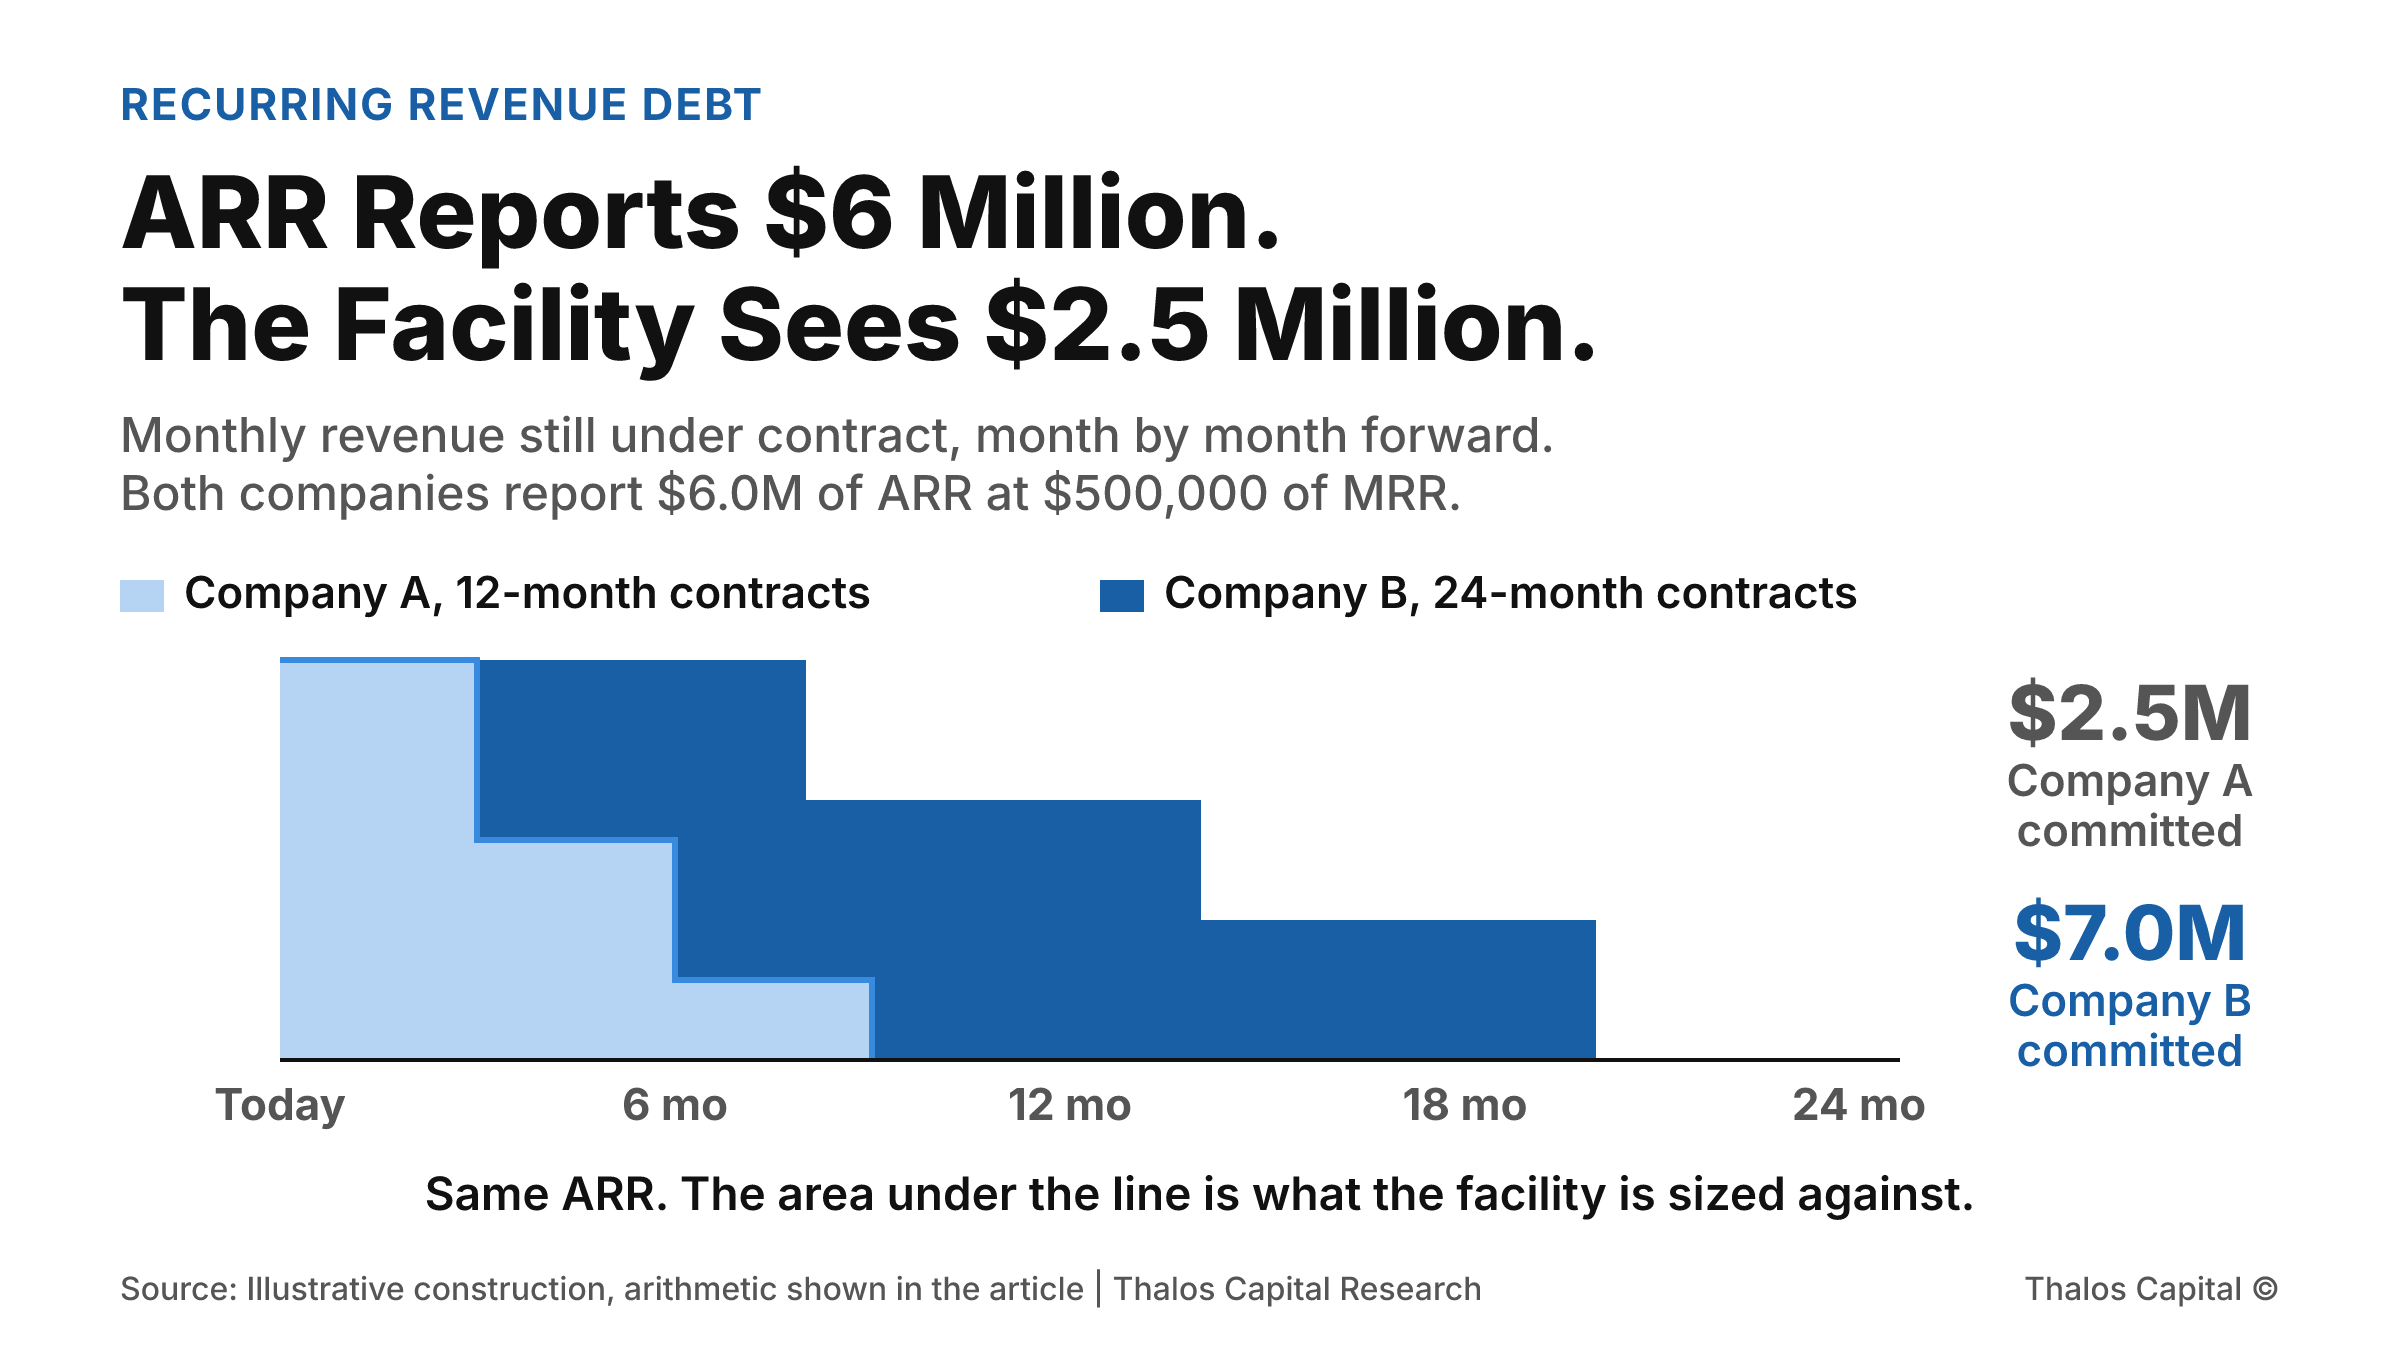
Two stepped areas showing monthly revenue still under contract over the next 24 months for two companies with identical $6.0 million ARR: a 12-month contract book holding $2.5 million of remaining contracted value and a 24-month contract book holding $7.0 million.

ARR Reports $6 Million. The Facility Sees $2.5 Million.

Two recurring-revenue companies each report $6.0 million of ARR. One is offered a $2.0 million facility and the other $1.0 million. The difference is contract length, and it does not appear in any metric either company reports.
Read More
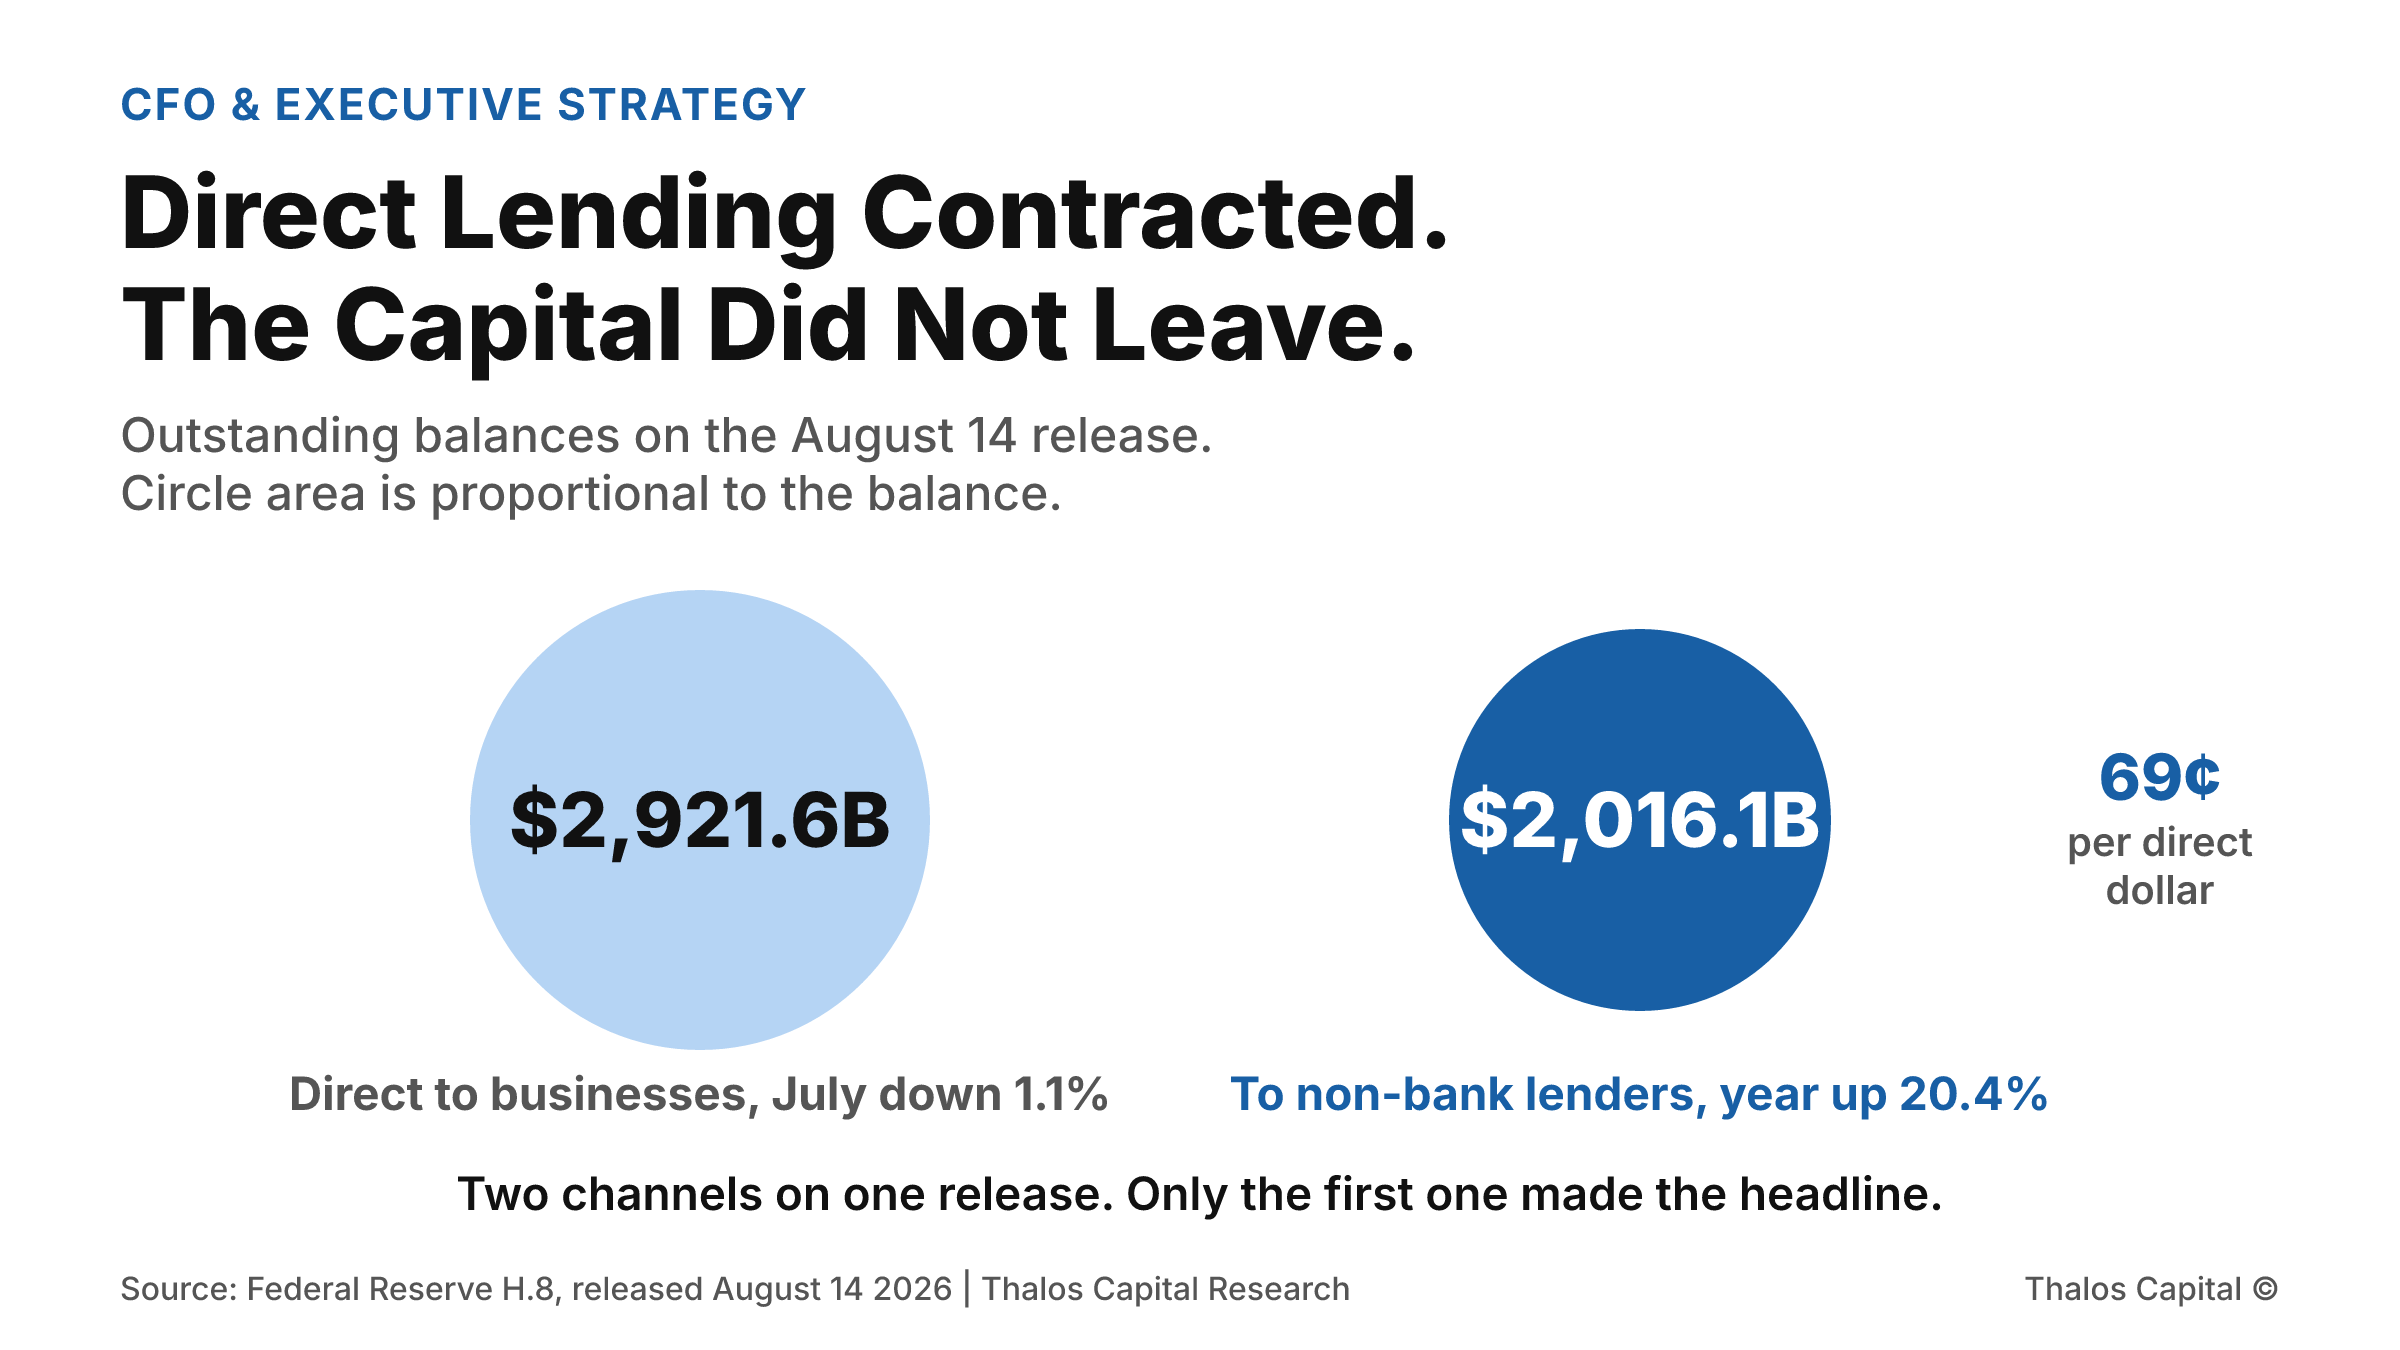
Two proportional circles comparing commercial and industrial loan balances of $2,921.6 billion, which contracted 1.1 percent annualized in July, against lending to non-depository financial institutions of $2,016.1 billion, up 20.4 percent on the year.

Direct Lending Contracted. The Capital Did Not Leave.

July brought the first contraction in commercial and industrial balances all year, at minus 1.1 percent annualized. Over the same stretch, lending to non-bank financial institutions reached $2,016.1 billion, up 20.4 percent.
Read More
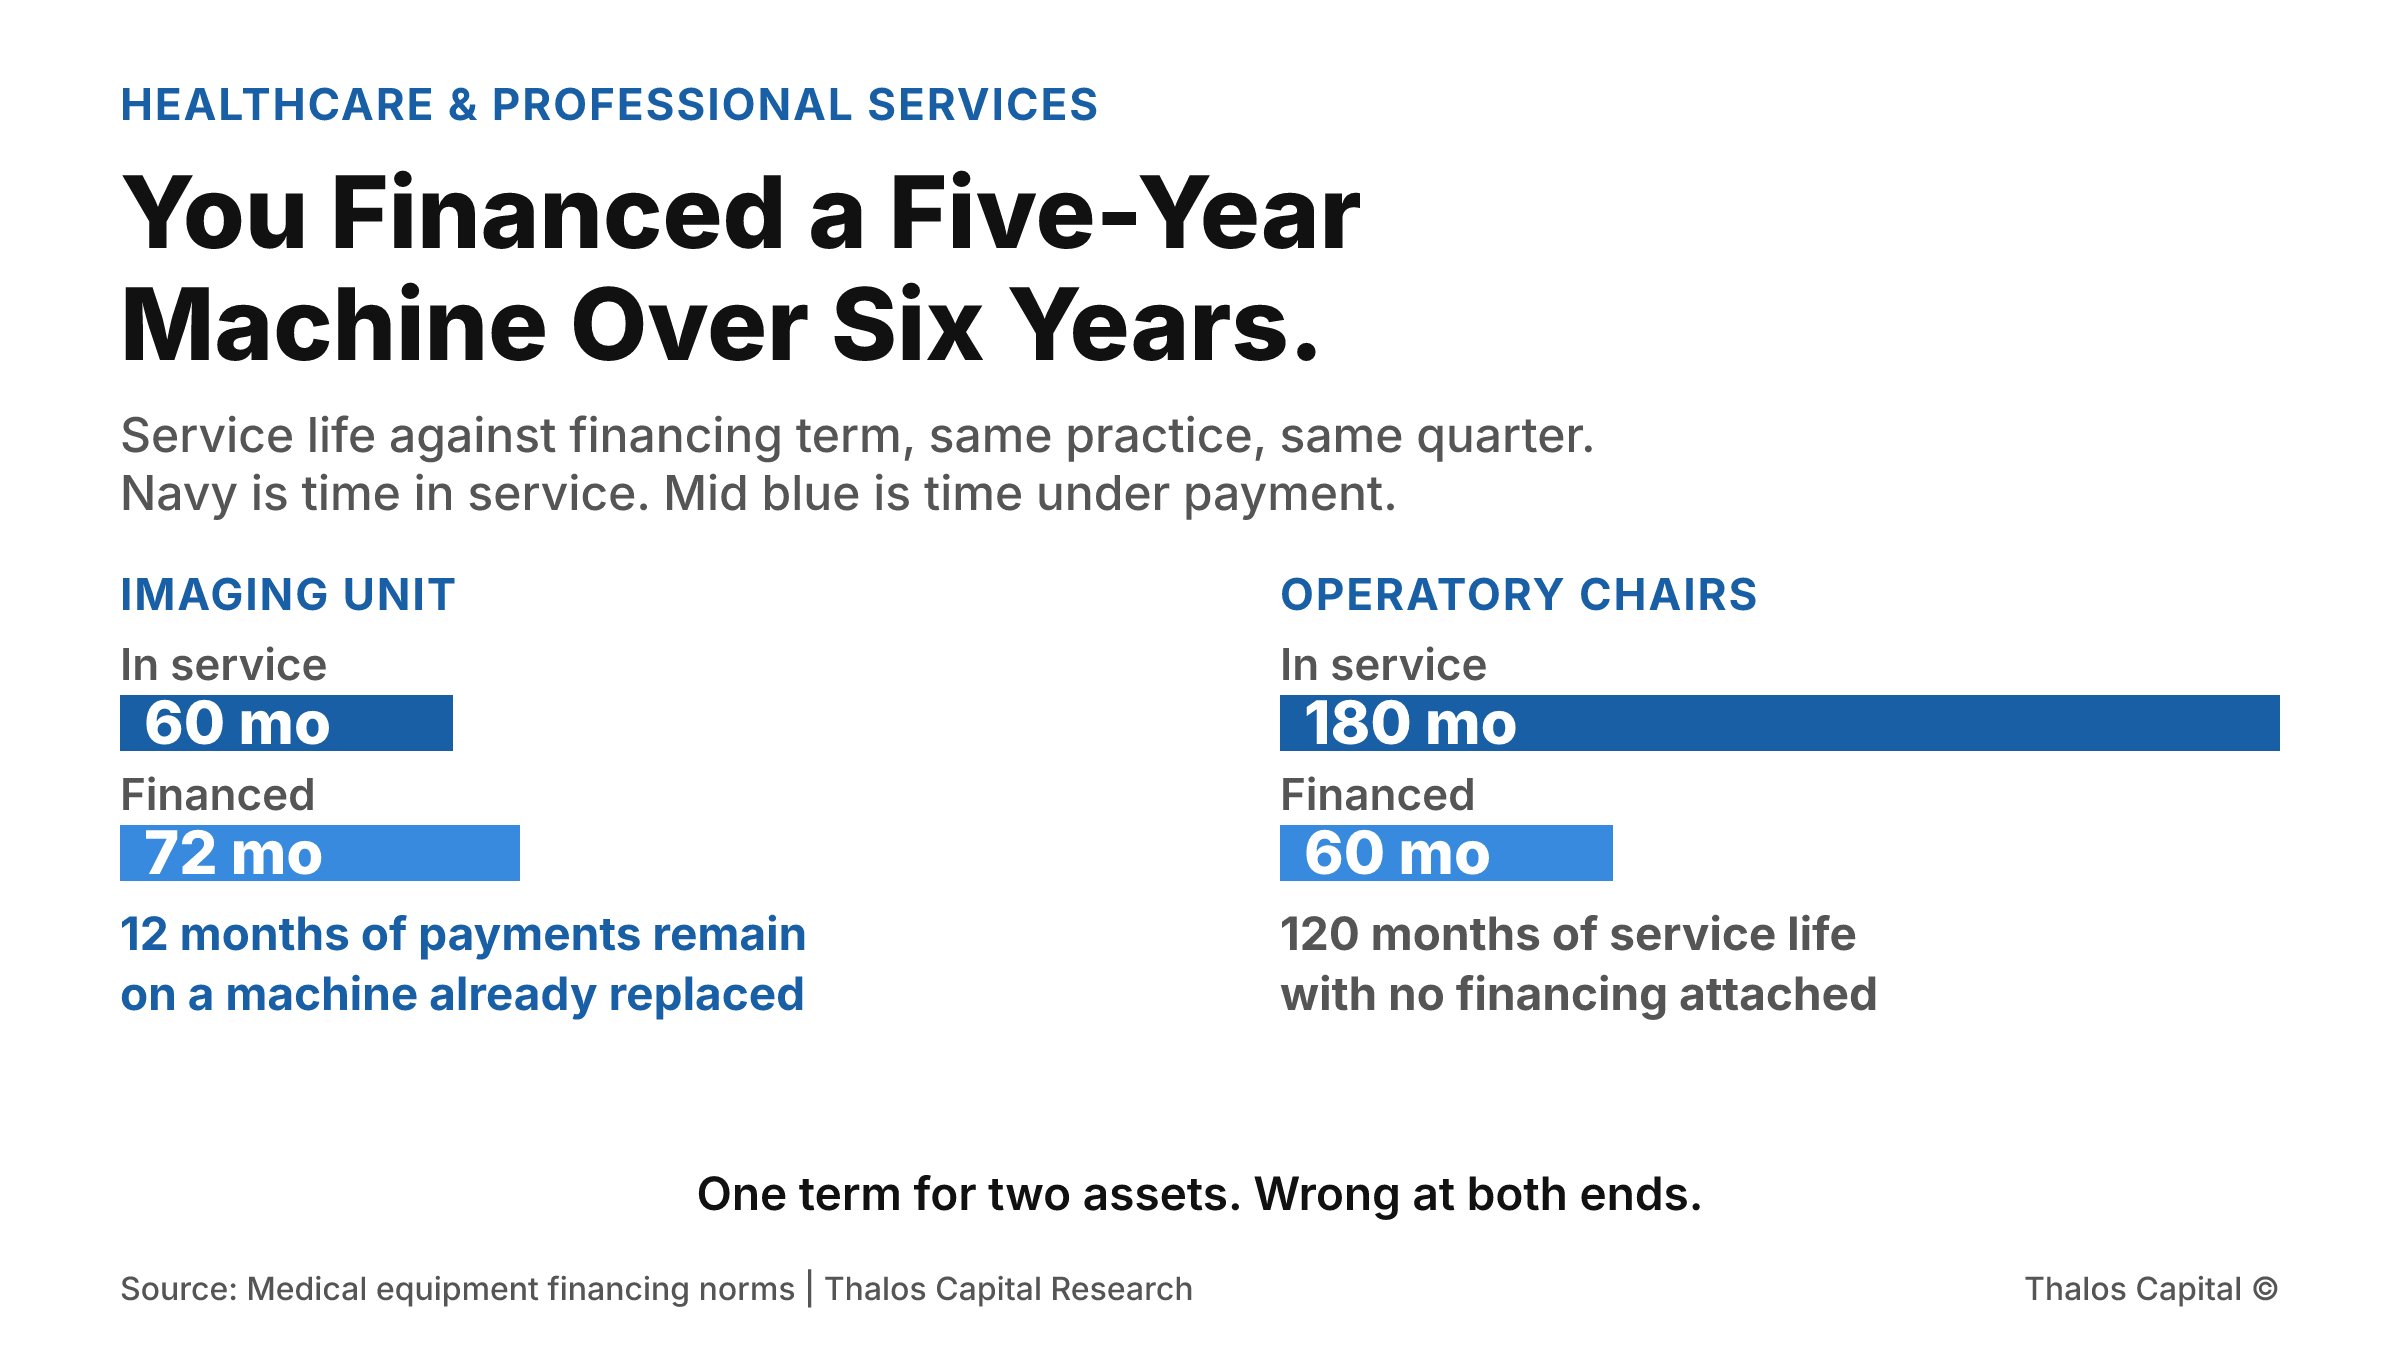
Two panels comparing asset service life against financing term. An imaging unit serves about 60 months but is financed over 72, leaving 12 months of payments on a retired machine. Operatory chairs serve about 180 months but are financed over 60, leaving 120 months of unfinanced life.

You Financed a Five-Year Machine Over Six Years.

A practice buys imaging and operatory chairs in the same quarter. One faces obsolescence in five years, the other runs fifteen. Financing both on a single term loses money at both ends.
Read More
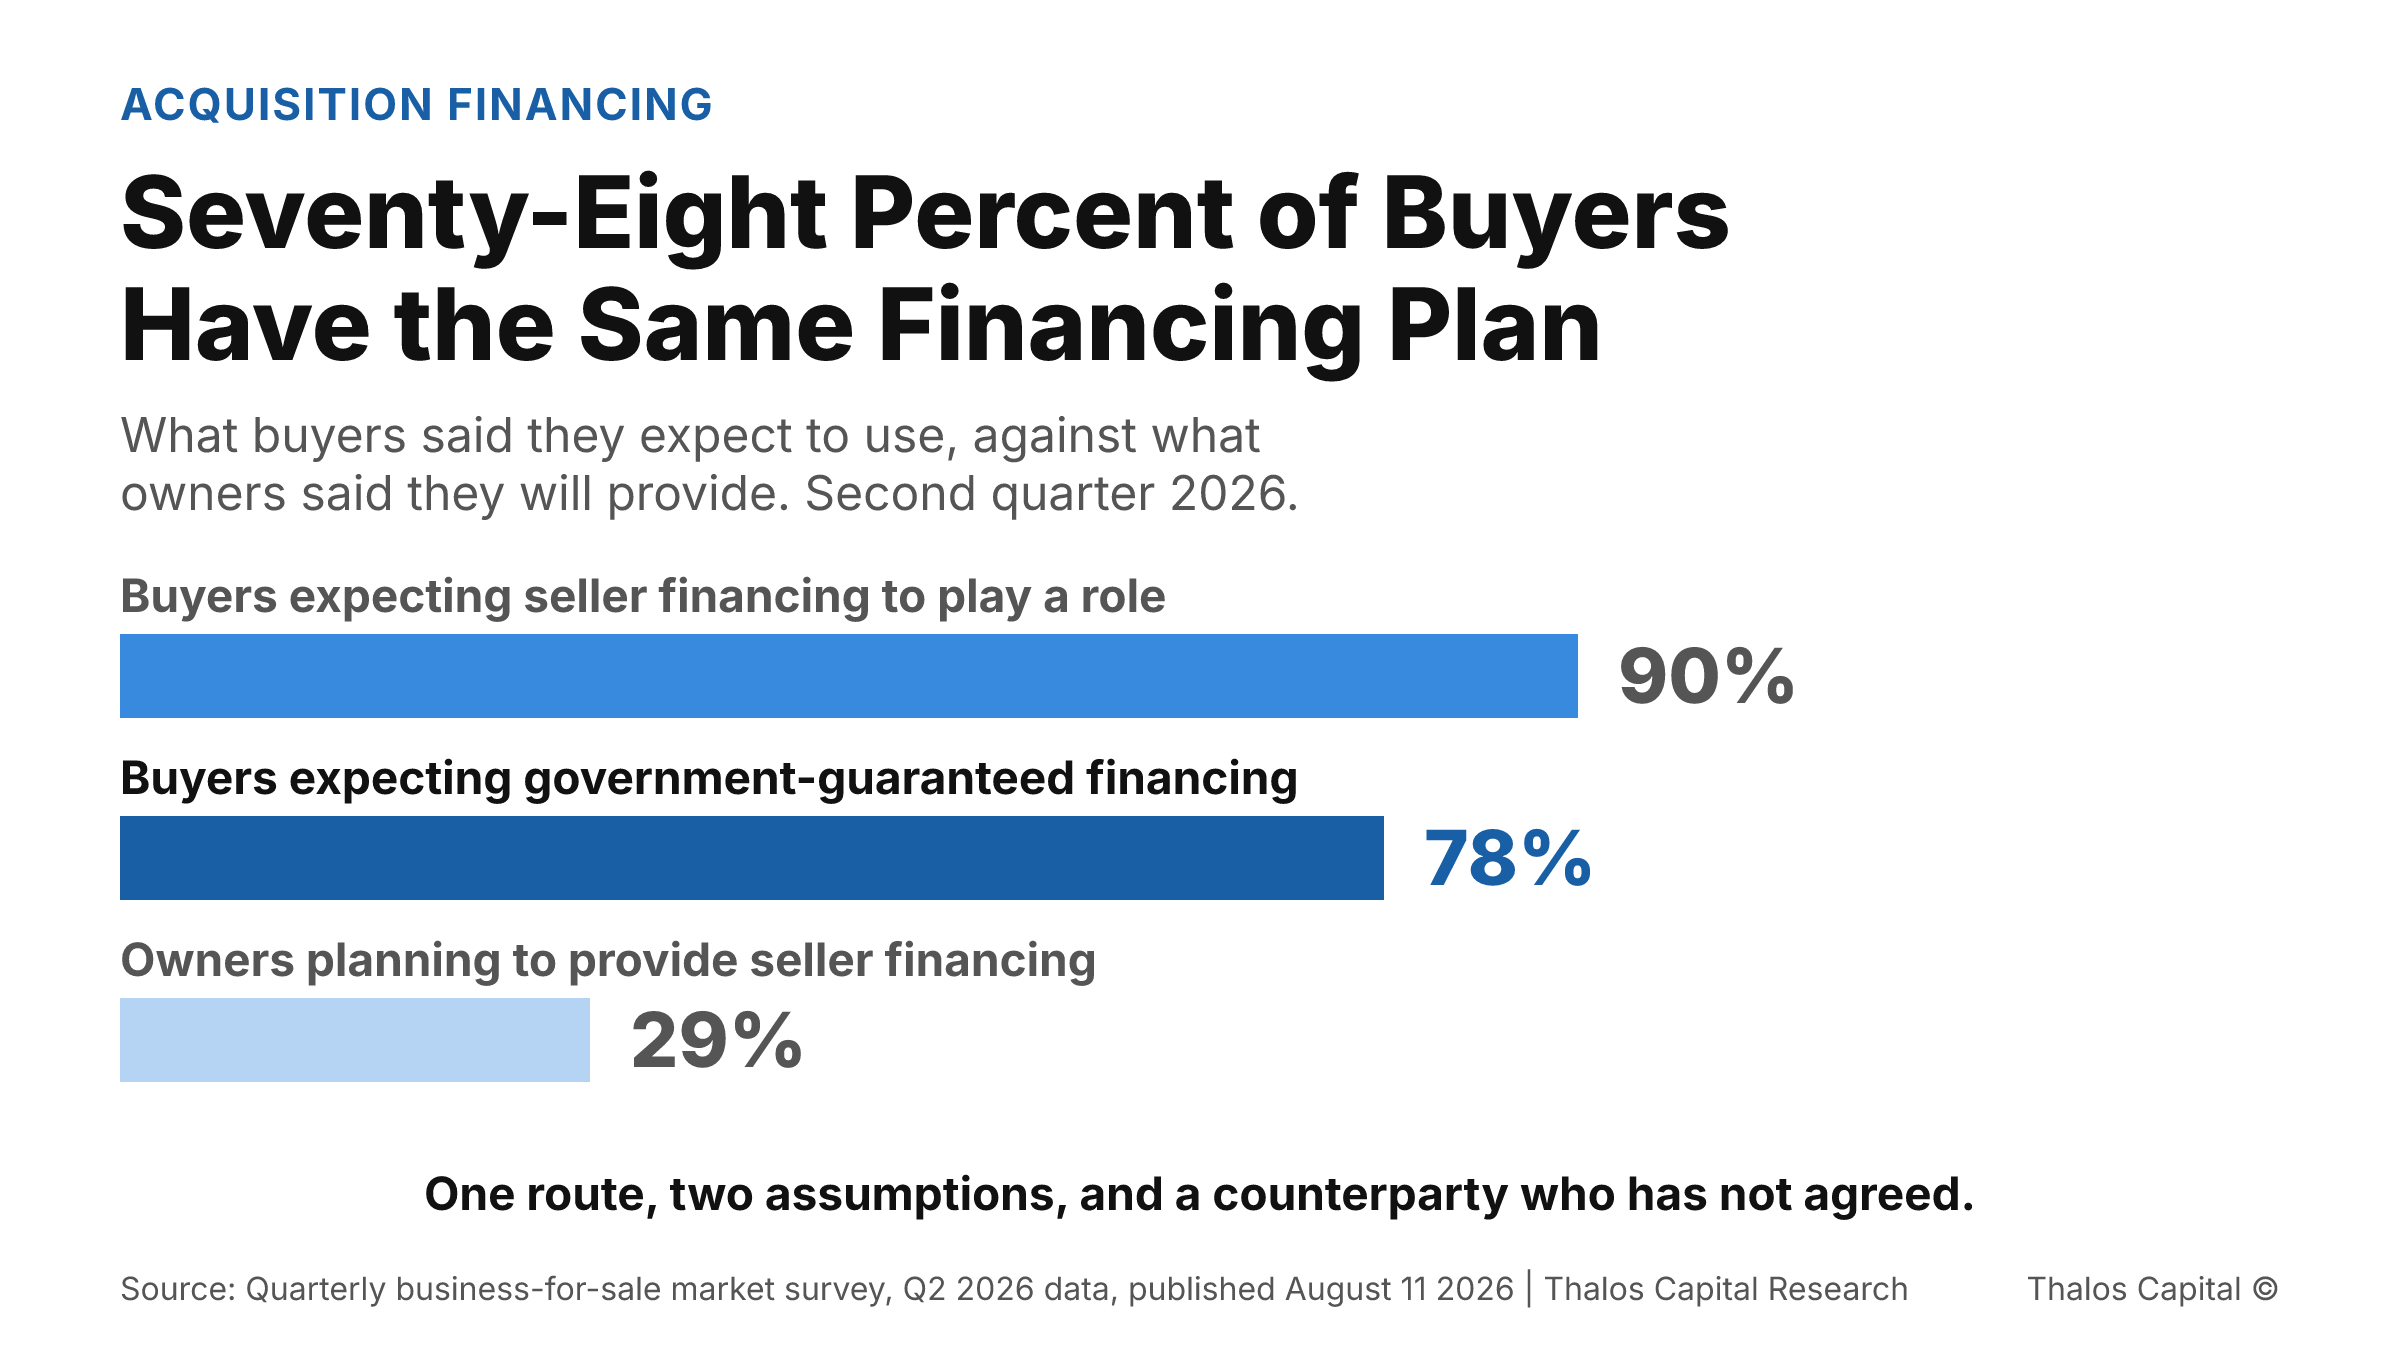
Horizontal bar chart of three survey figures from the second quarter of 2026. Ninety percent of buyers expect seller financing to play a role, seventy-eight percent expect financing backed by the U.S. Small Business Administration, shown in the darkest navy as the value argued, and twenty-nine percent of owners plan to provide seller financing.

Seventy-Eight Percent of Buyers Have the Same Financing Plan

Nearly eight in ten buyers expect to fund an acquisition through one government-guaranteed program, and ninety percent expect a seller note that only twenty-nine percent of owners plan to write.
Read More
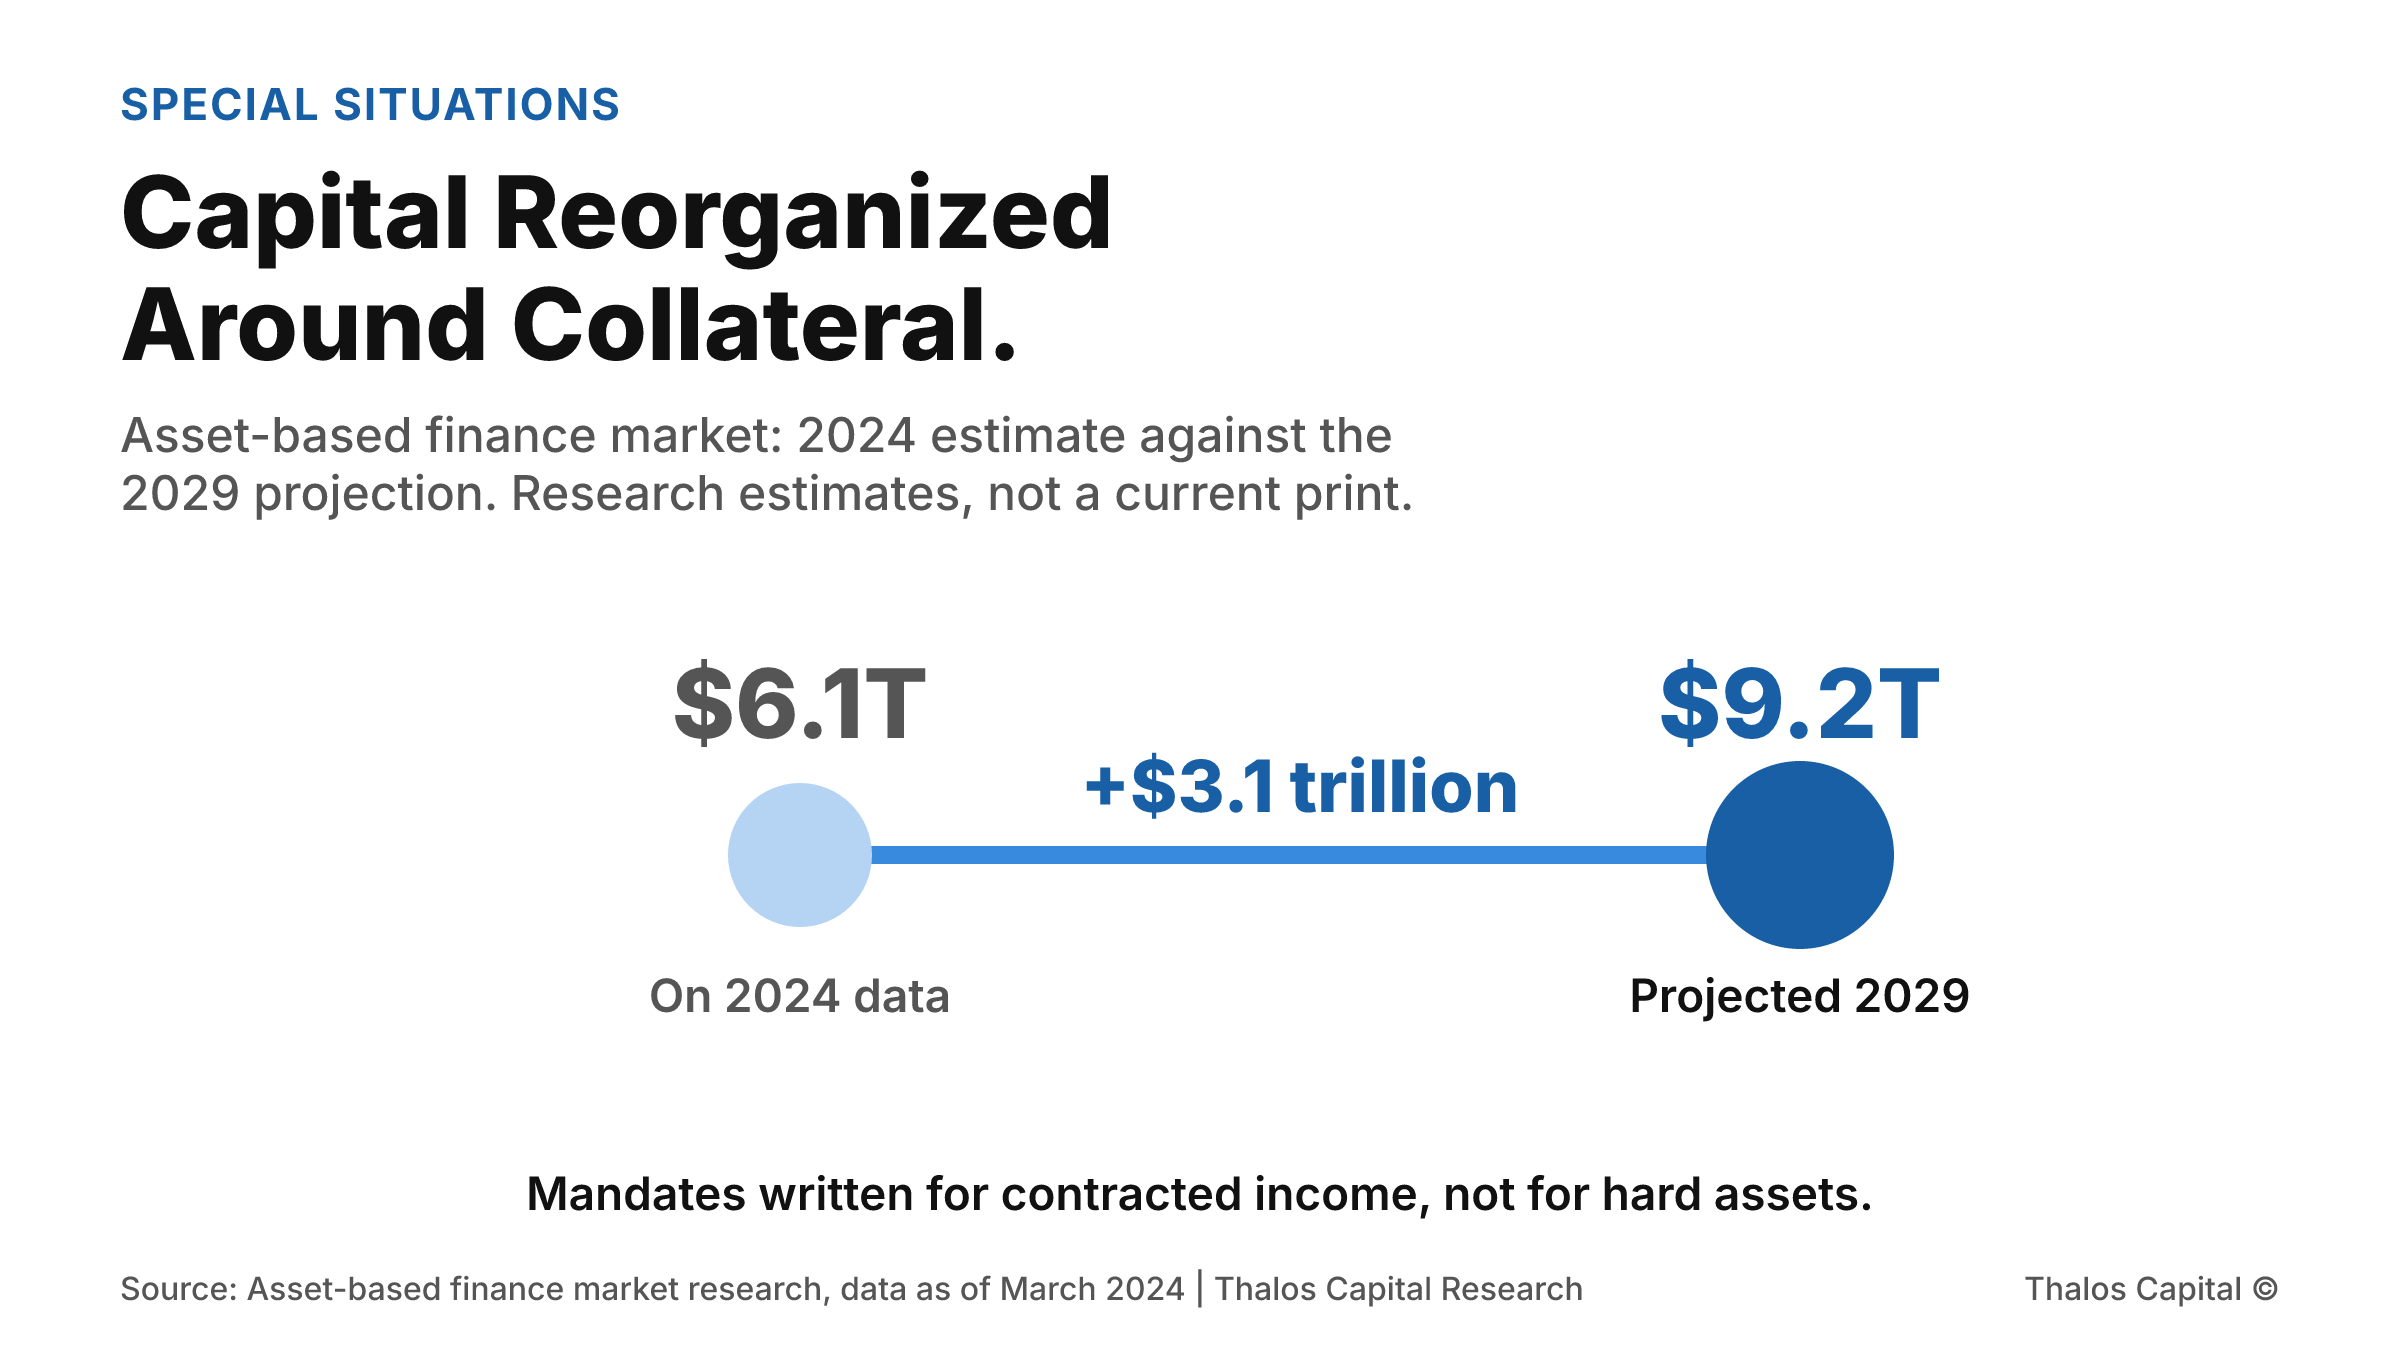
Two point range chart showing the asset-based finance market estimated at more than $6.1 trillion on 2024 data and projected to reach $9.2 trillion by 2029, an increase of roughly $3.1 trillion.

Capital Reorganized Around Collateral. Your Contracts Are Collateral.

Asset-based finance was estimated at more than $6.1 trillion on 2024 data and projected to reach $9.2 trillion by 2029. Inside it are mandates written for contracted and intangible cash flows rather than for hard assets.
Read More
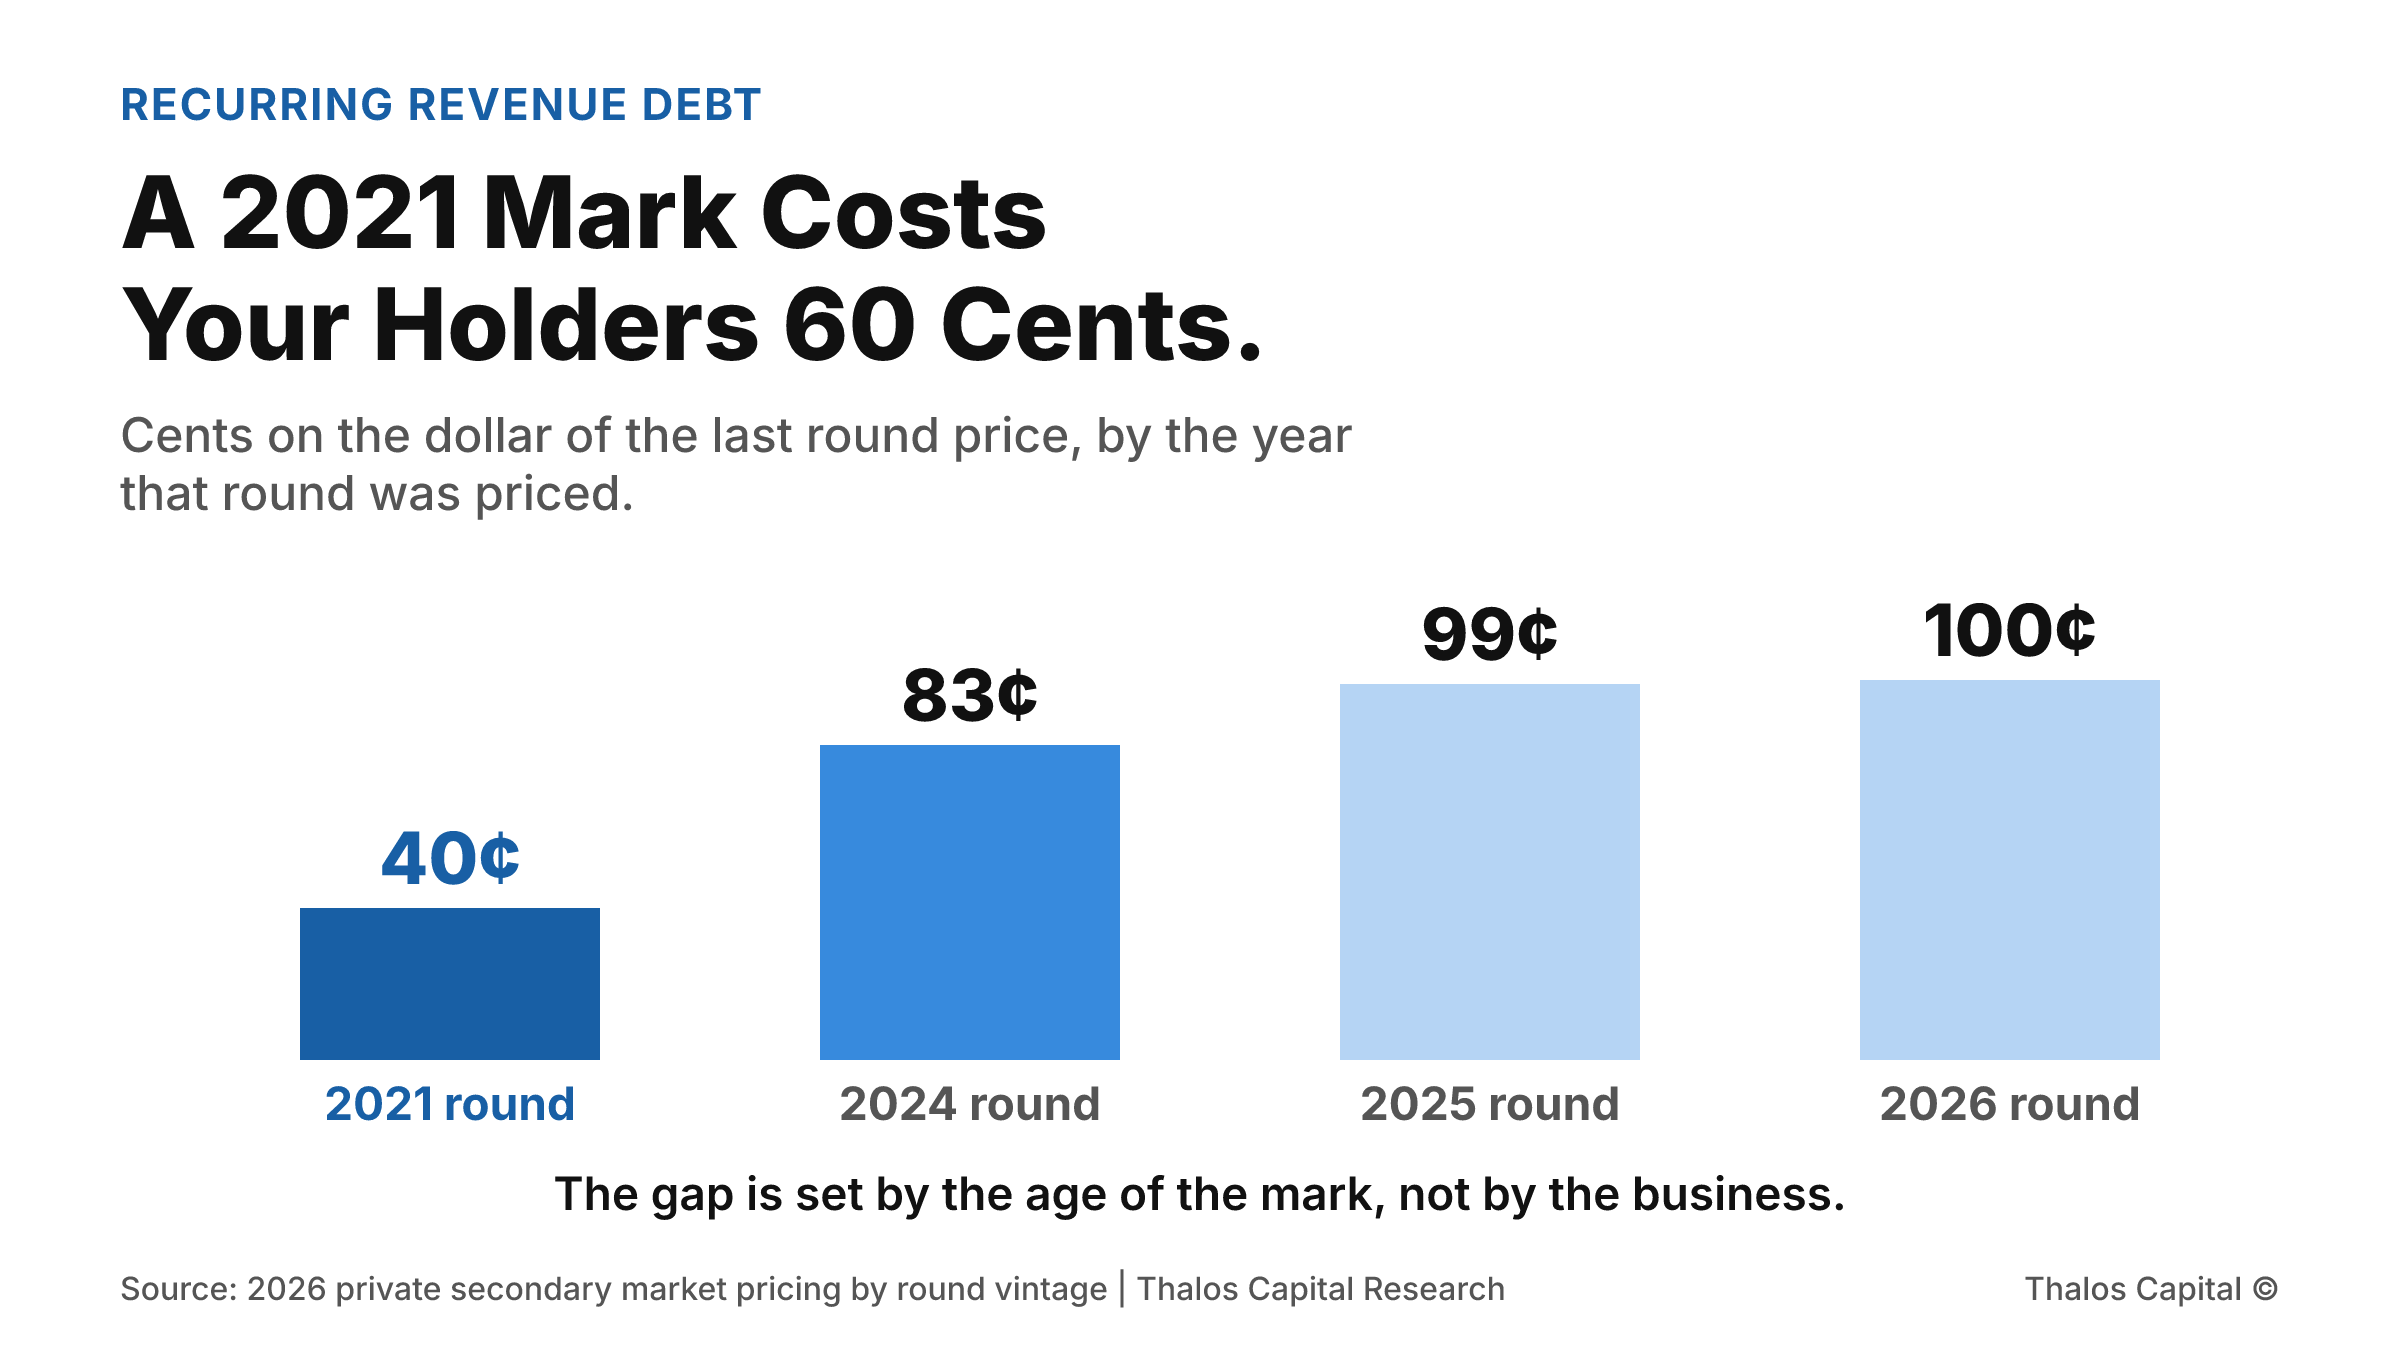
Column chart of what private shares fetch as cents on the dollar of the last round price, by the year that round was priced: about 40 cents for a 2021 mark shown in the darkest navy, 83 cents for 2024, 99 cents for 2025 and 100 cents for 2026.

A 2021 Mark Costs Your Holders 60 Cents.

Private shares trade below the last round price, and how far below depends on when that round was priced. A 2021 mark trades around 60 percent under. A 2025 mark trades around 1 percent under. What that costs an early holder.
Read More
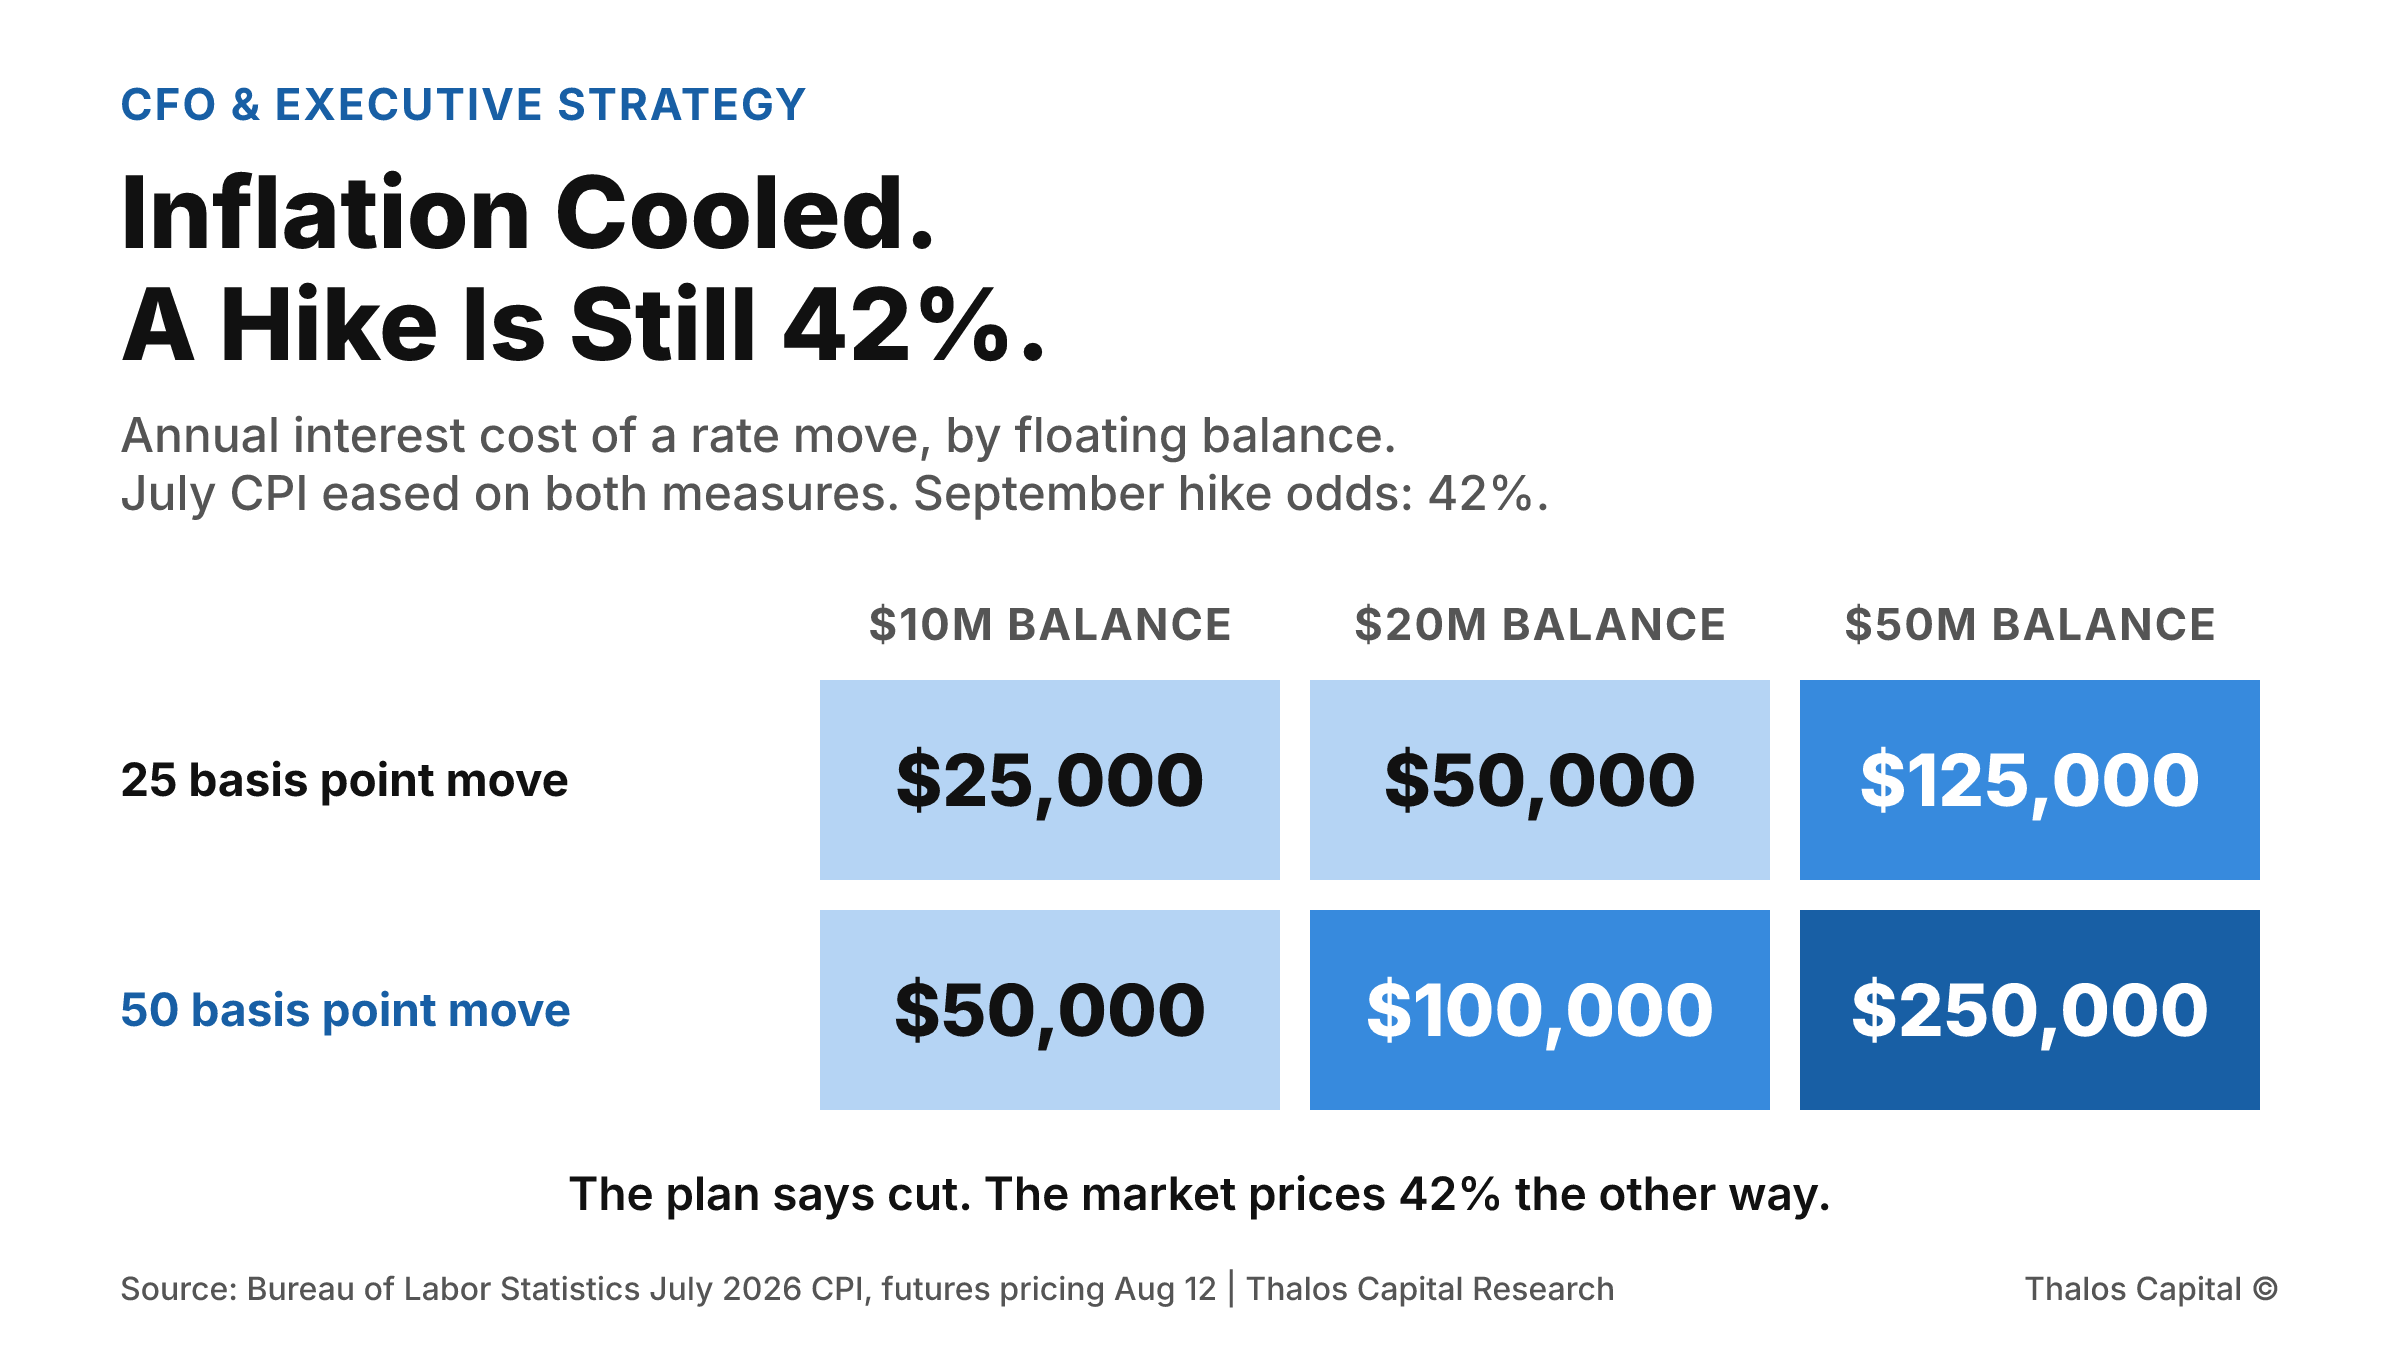
Shaded grid of the annual interest cost of a rate move across three floating balances: a 25 basis point move costs $25,000 on $10 million, $50,000 on $20 million and $125,000 on $50 million, and a 50 basis point move costs $50,000, $100,000 and $250,000 respectively.

Inflation Cooled. A Hike Is Still a 42 Percent Bet.

July CPI came in exactly as forecast, both measures eased, and Treasury yields fell across the board. Futures still priced a 42 percent chance of a September hike. What that asymmetry is worth on a floating balance.
Read More
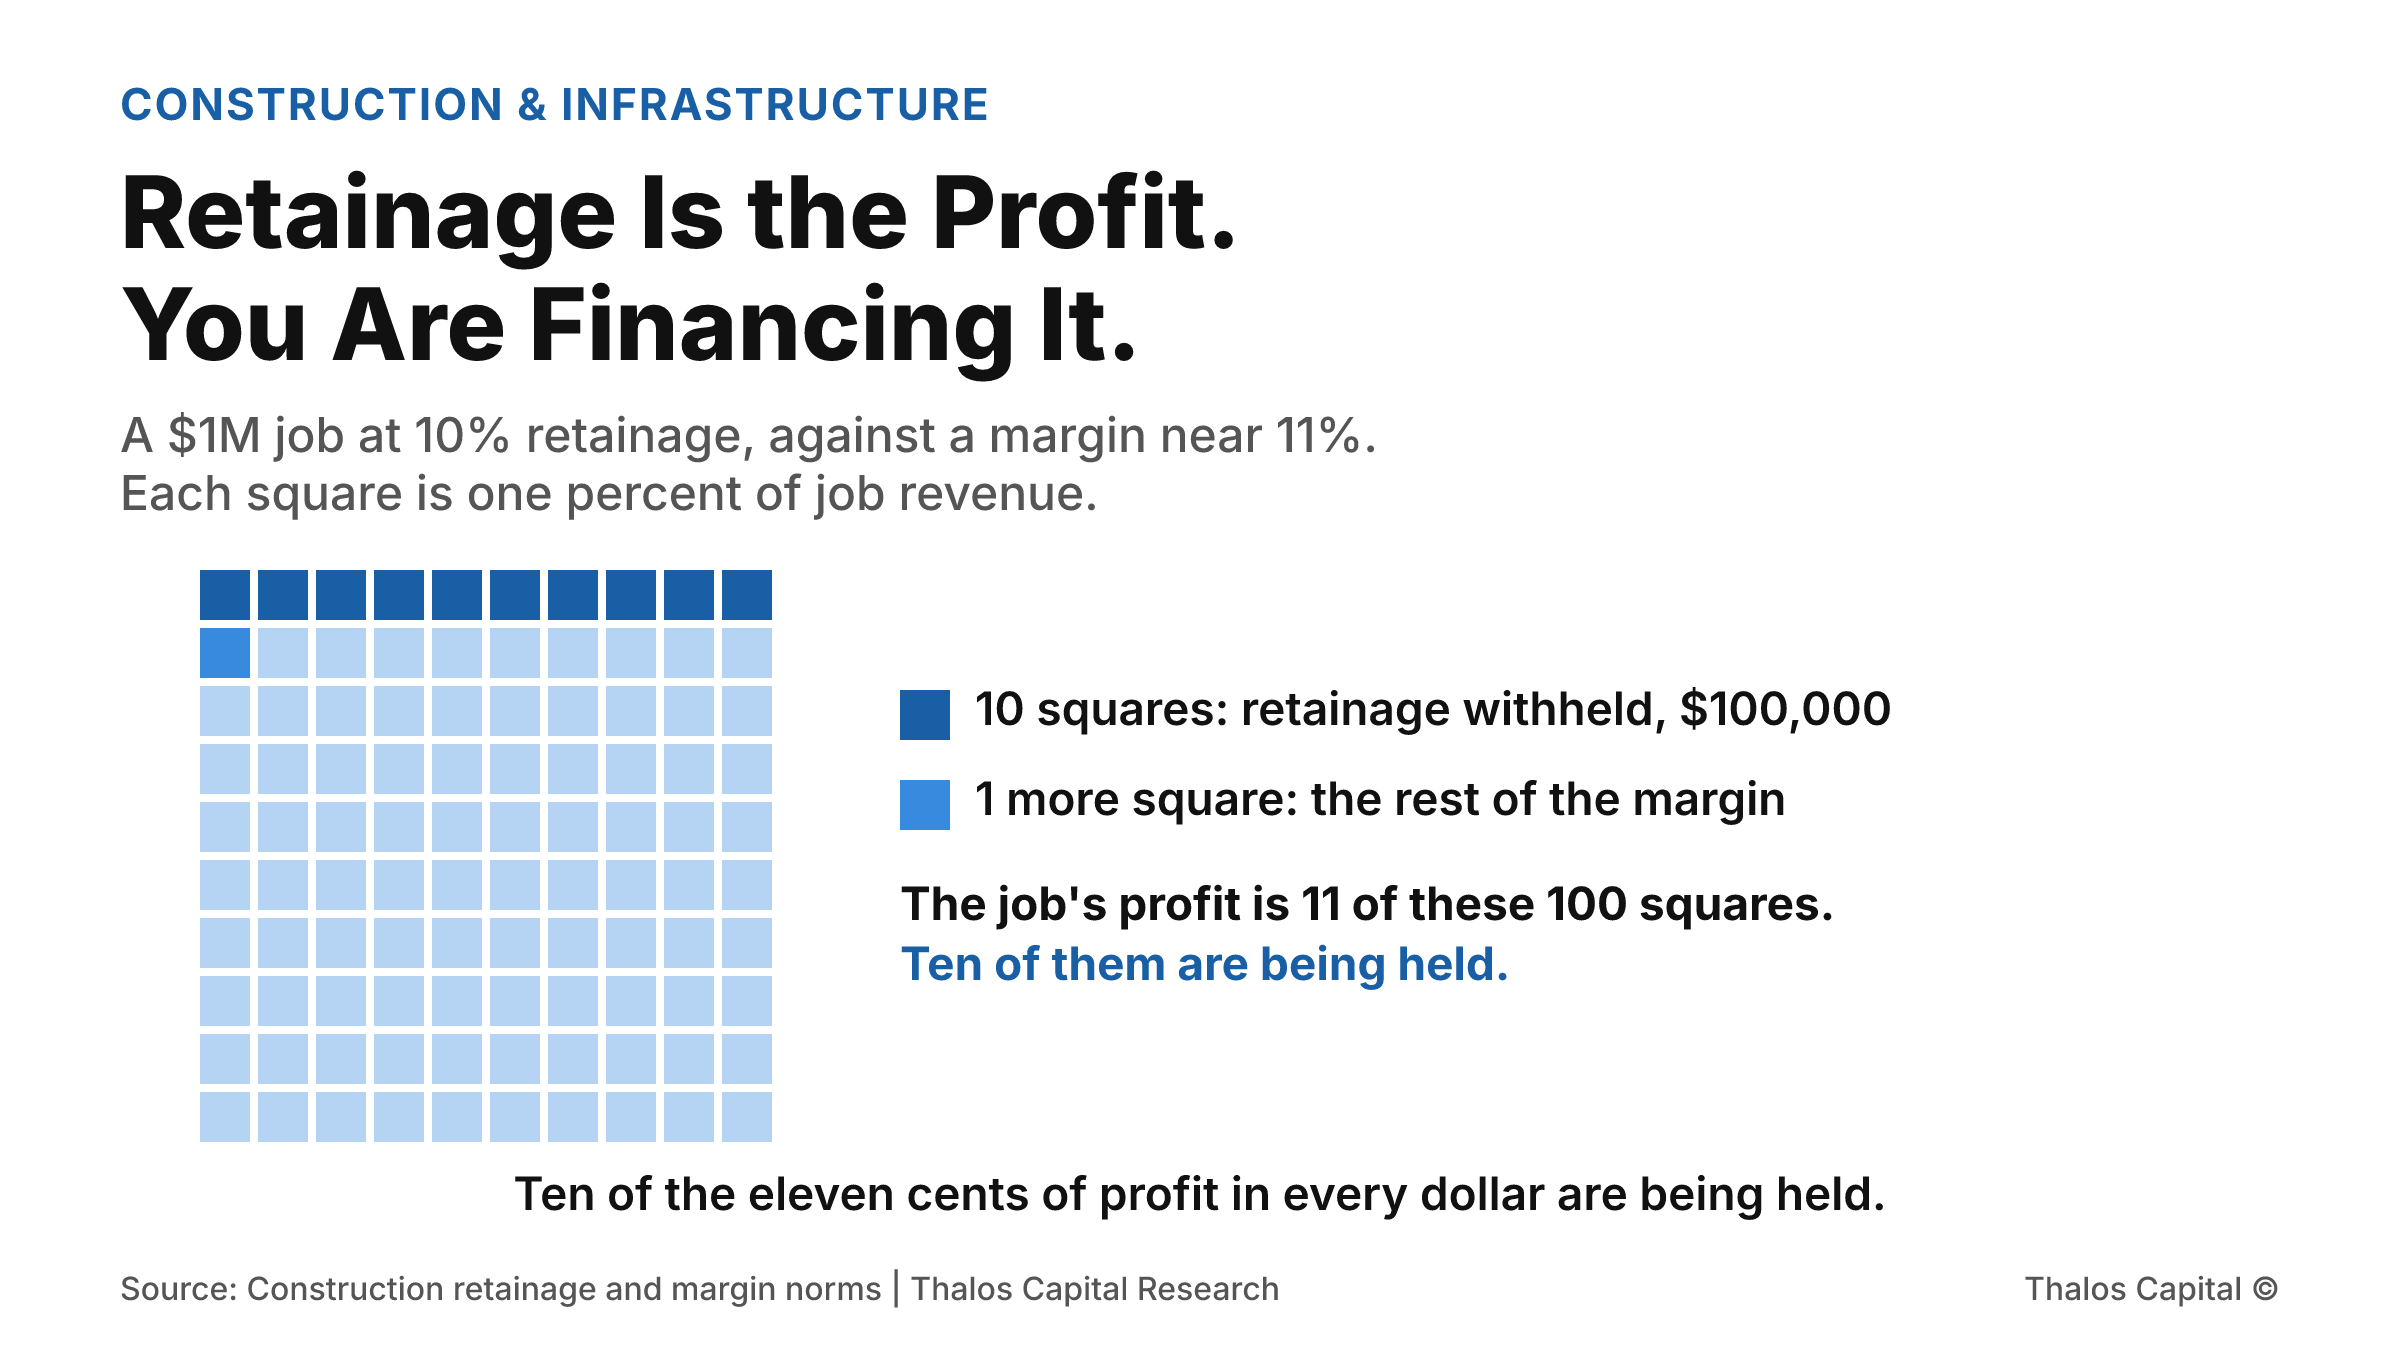
Waffle grid of 100 squares representing a $1 million job. Ten squares in dark navy show the $100,000 withheld as retainage and one further square in mid blue completes the roughly 11 percent margin, so ten of the eleven profit squares are being held.

Retainage Is the Profit. You Are Financing It.

A ten-month job billing $100,000 a month withholds $100,000 by closeout. At builder margins near 11 percent that is almost the entire profit on the job, and a standard receivables facility gives you nothing against it.
Read More
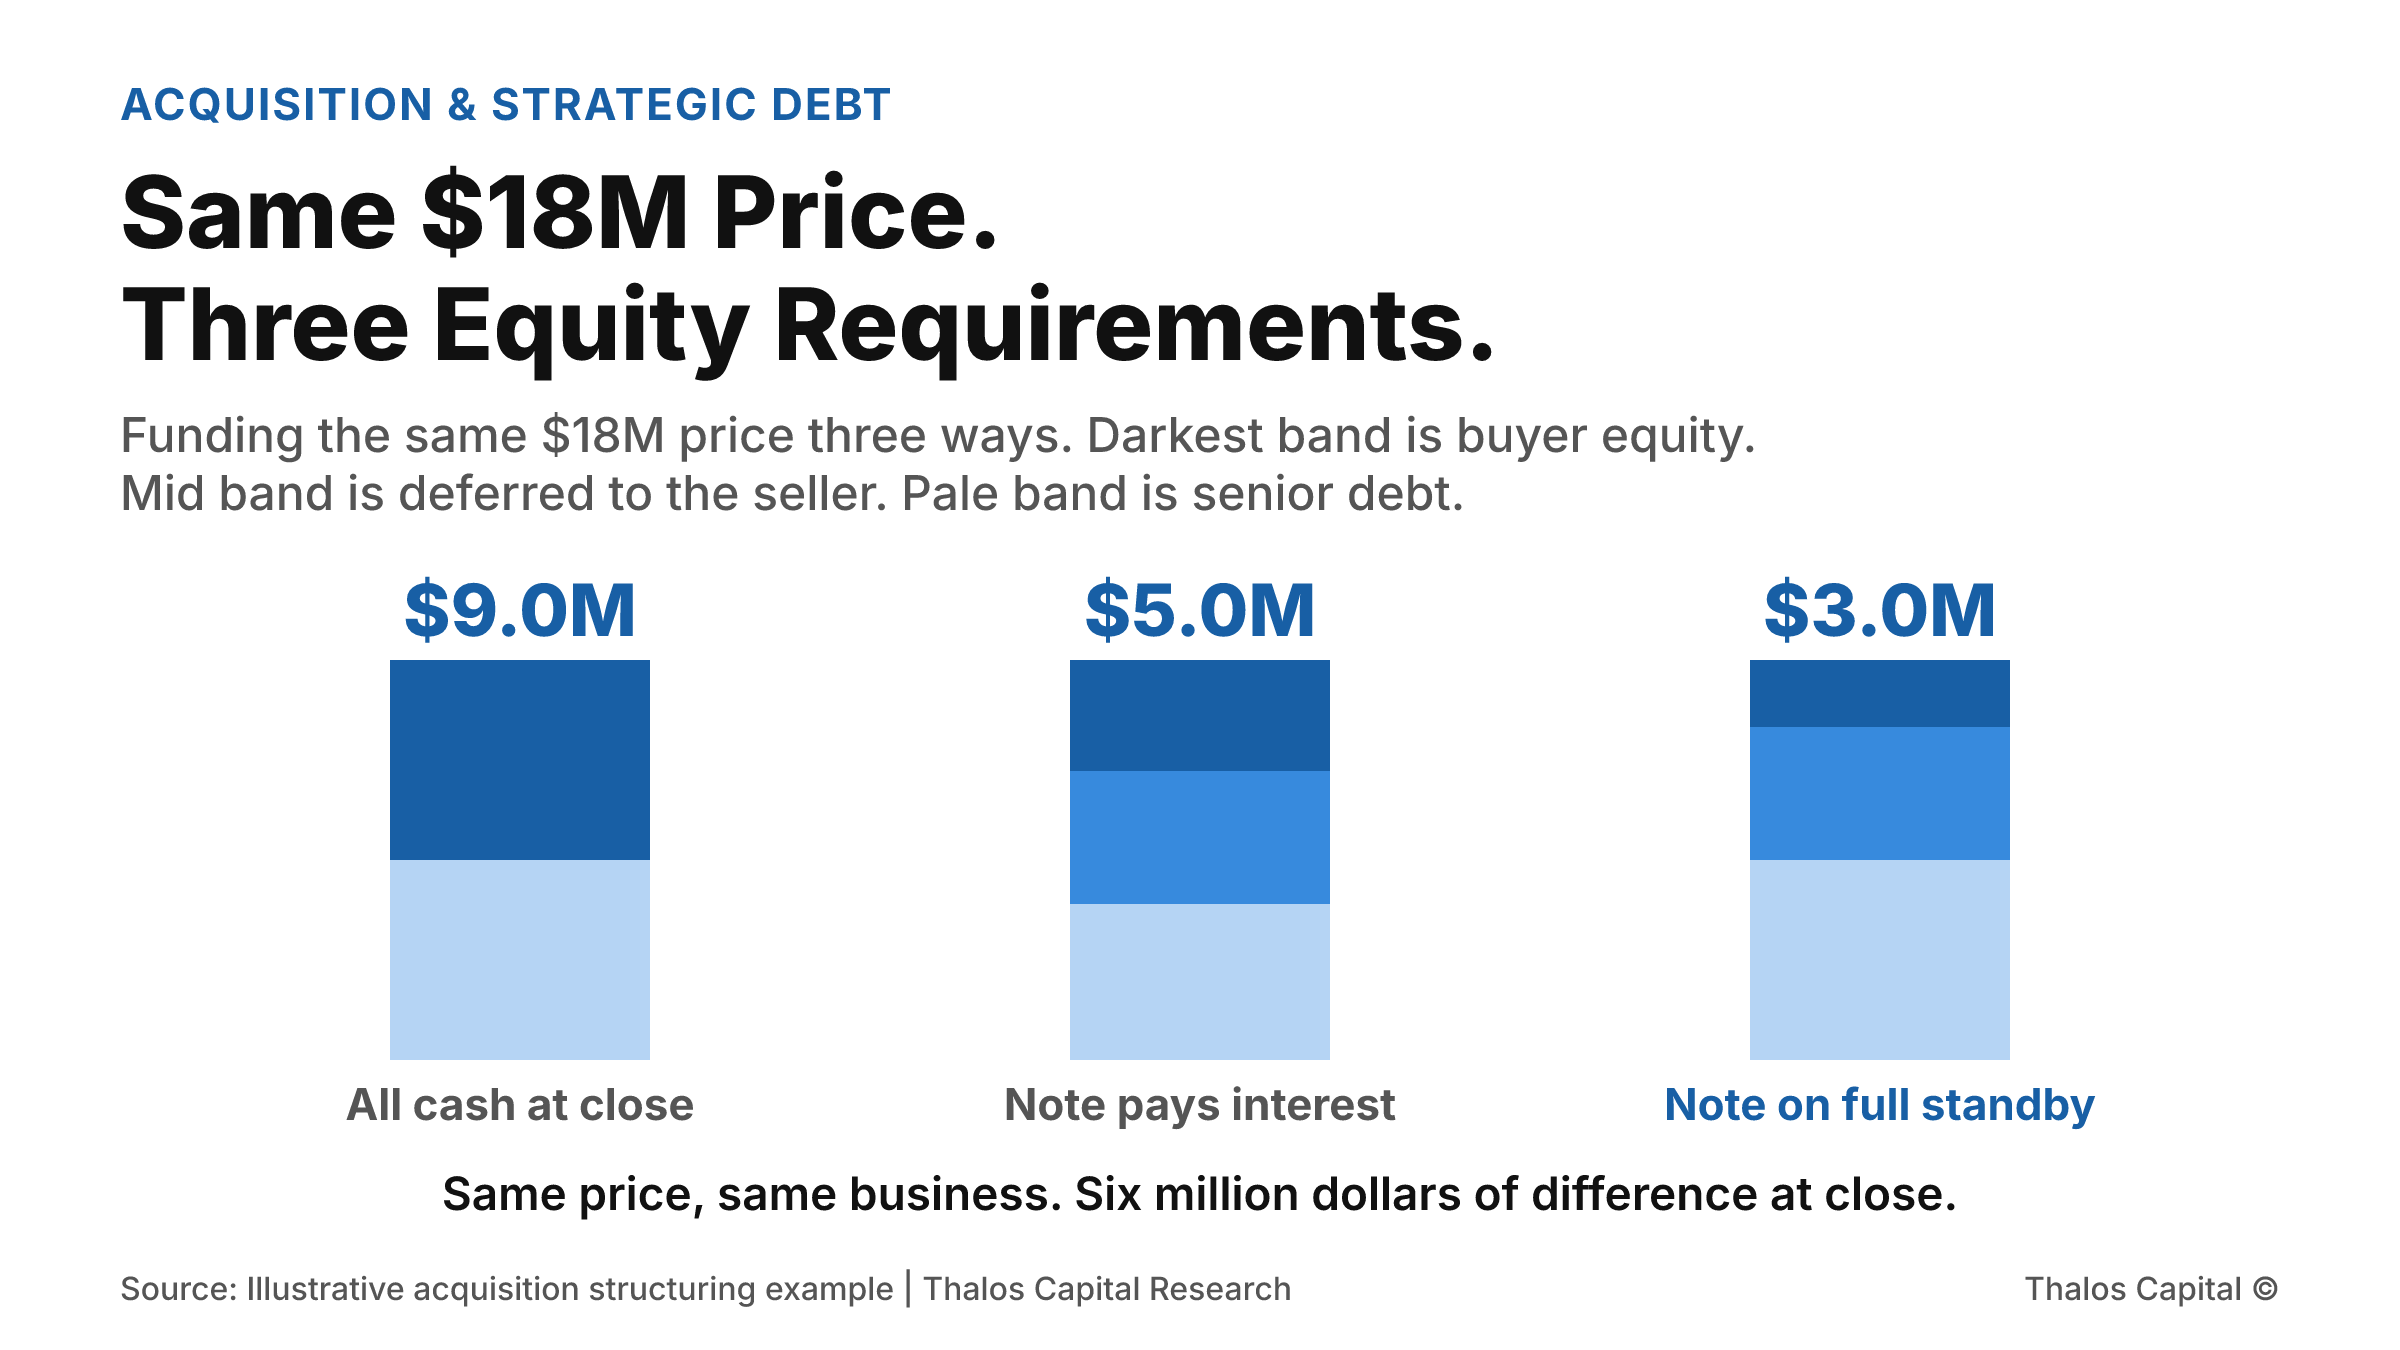
Three small stacked columns funding the same $18 million purchase price, showing buyer equity at close of $9 million on an all-cash deal, $5 million when the seller note pays current interest, and $3 million when the seller note sits on full standby.

Same $18M Price. Three Different Equity Requirements.

Two buyers agree the same $18 million price for the same business. Depending on how the deferred consideration is structured, the cash the buyer needs at close is $9 million, $5 million, or $3 million. The price never changed.
Read More
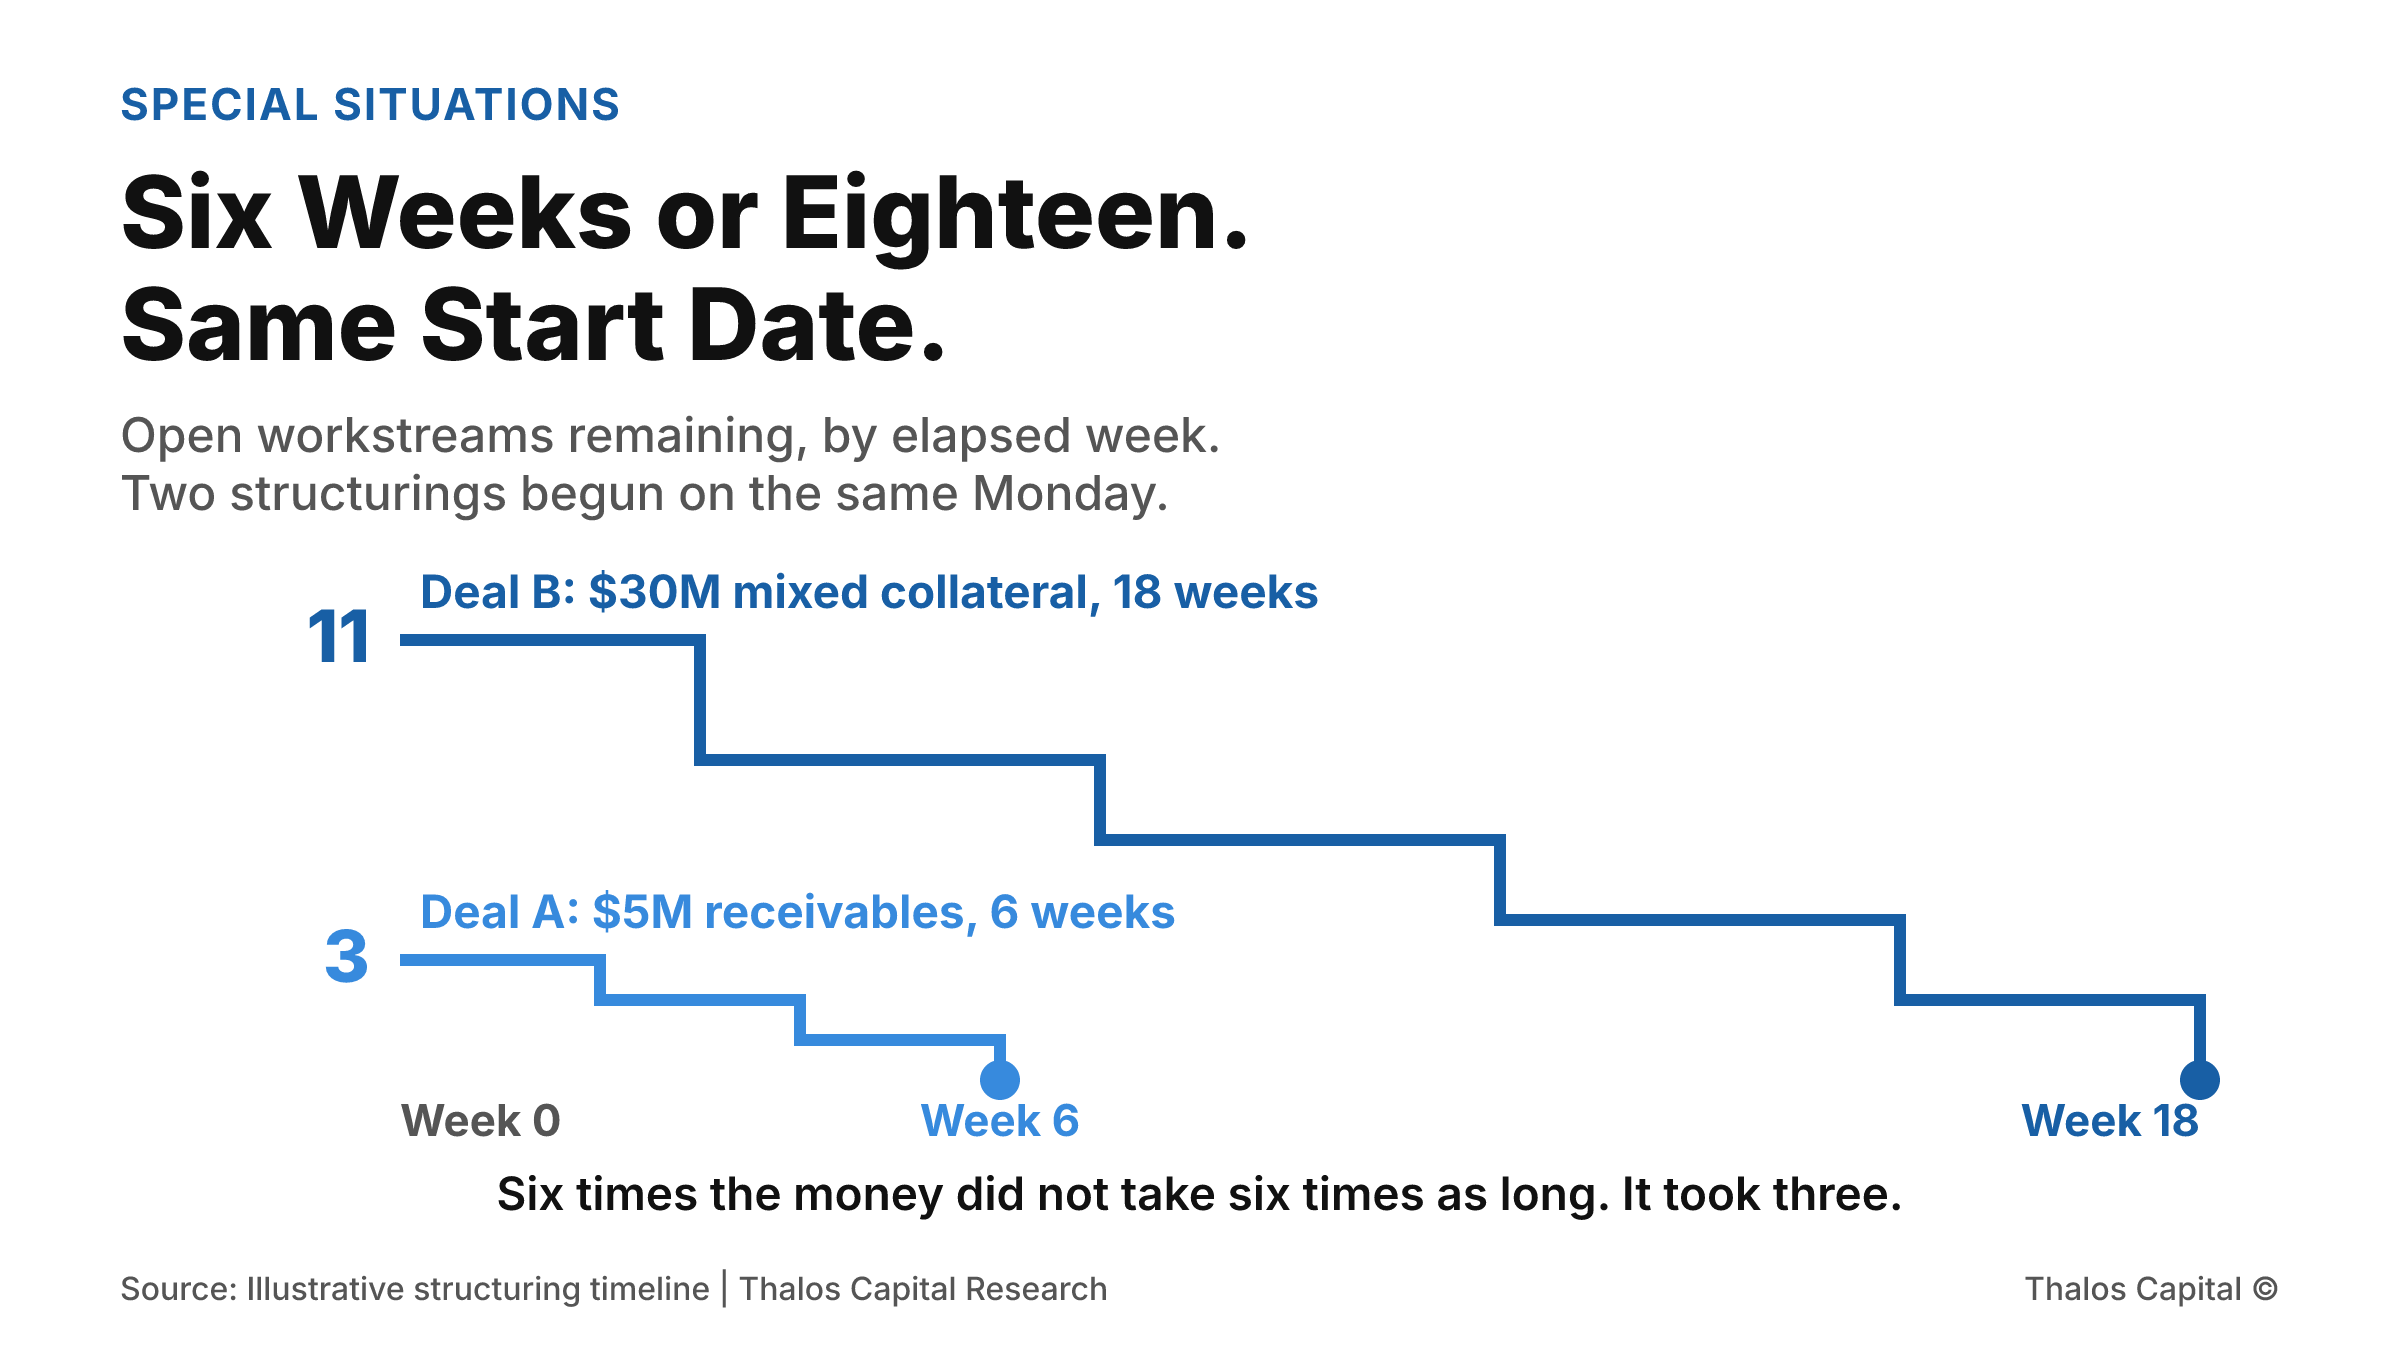
Stepped line chart of open workstreams by elapsed week for two structurings begun the same day: a $5 million receivables facility starting with three workstreams and closing in six weeks, and a $30 million mixed-collateral facility starting with eleven and closing in eighteen.

Six Weeks or Eighteen Weeks. Same Start Date.

Two principals began structuring on the same Monday. A $5 million facility against receivables closed in six weeks. A $30 million facility against mixed collateral took eighteen. Where the twelve extra weeks actually go.
Read More
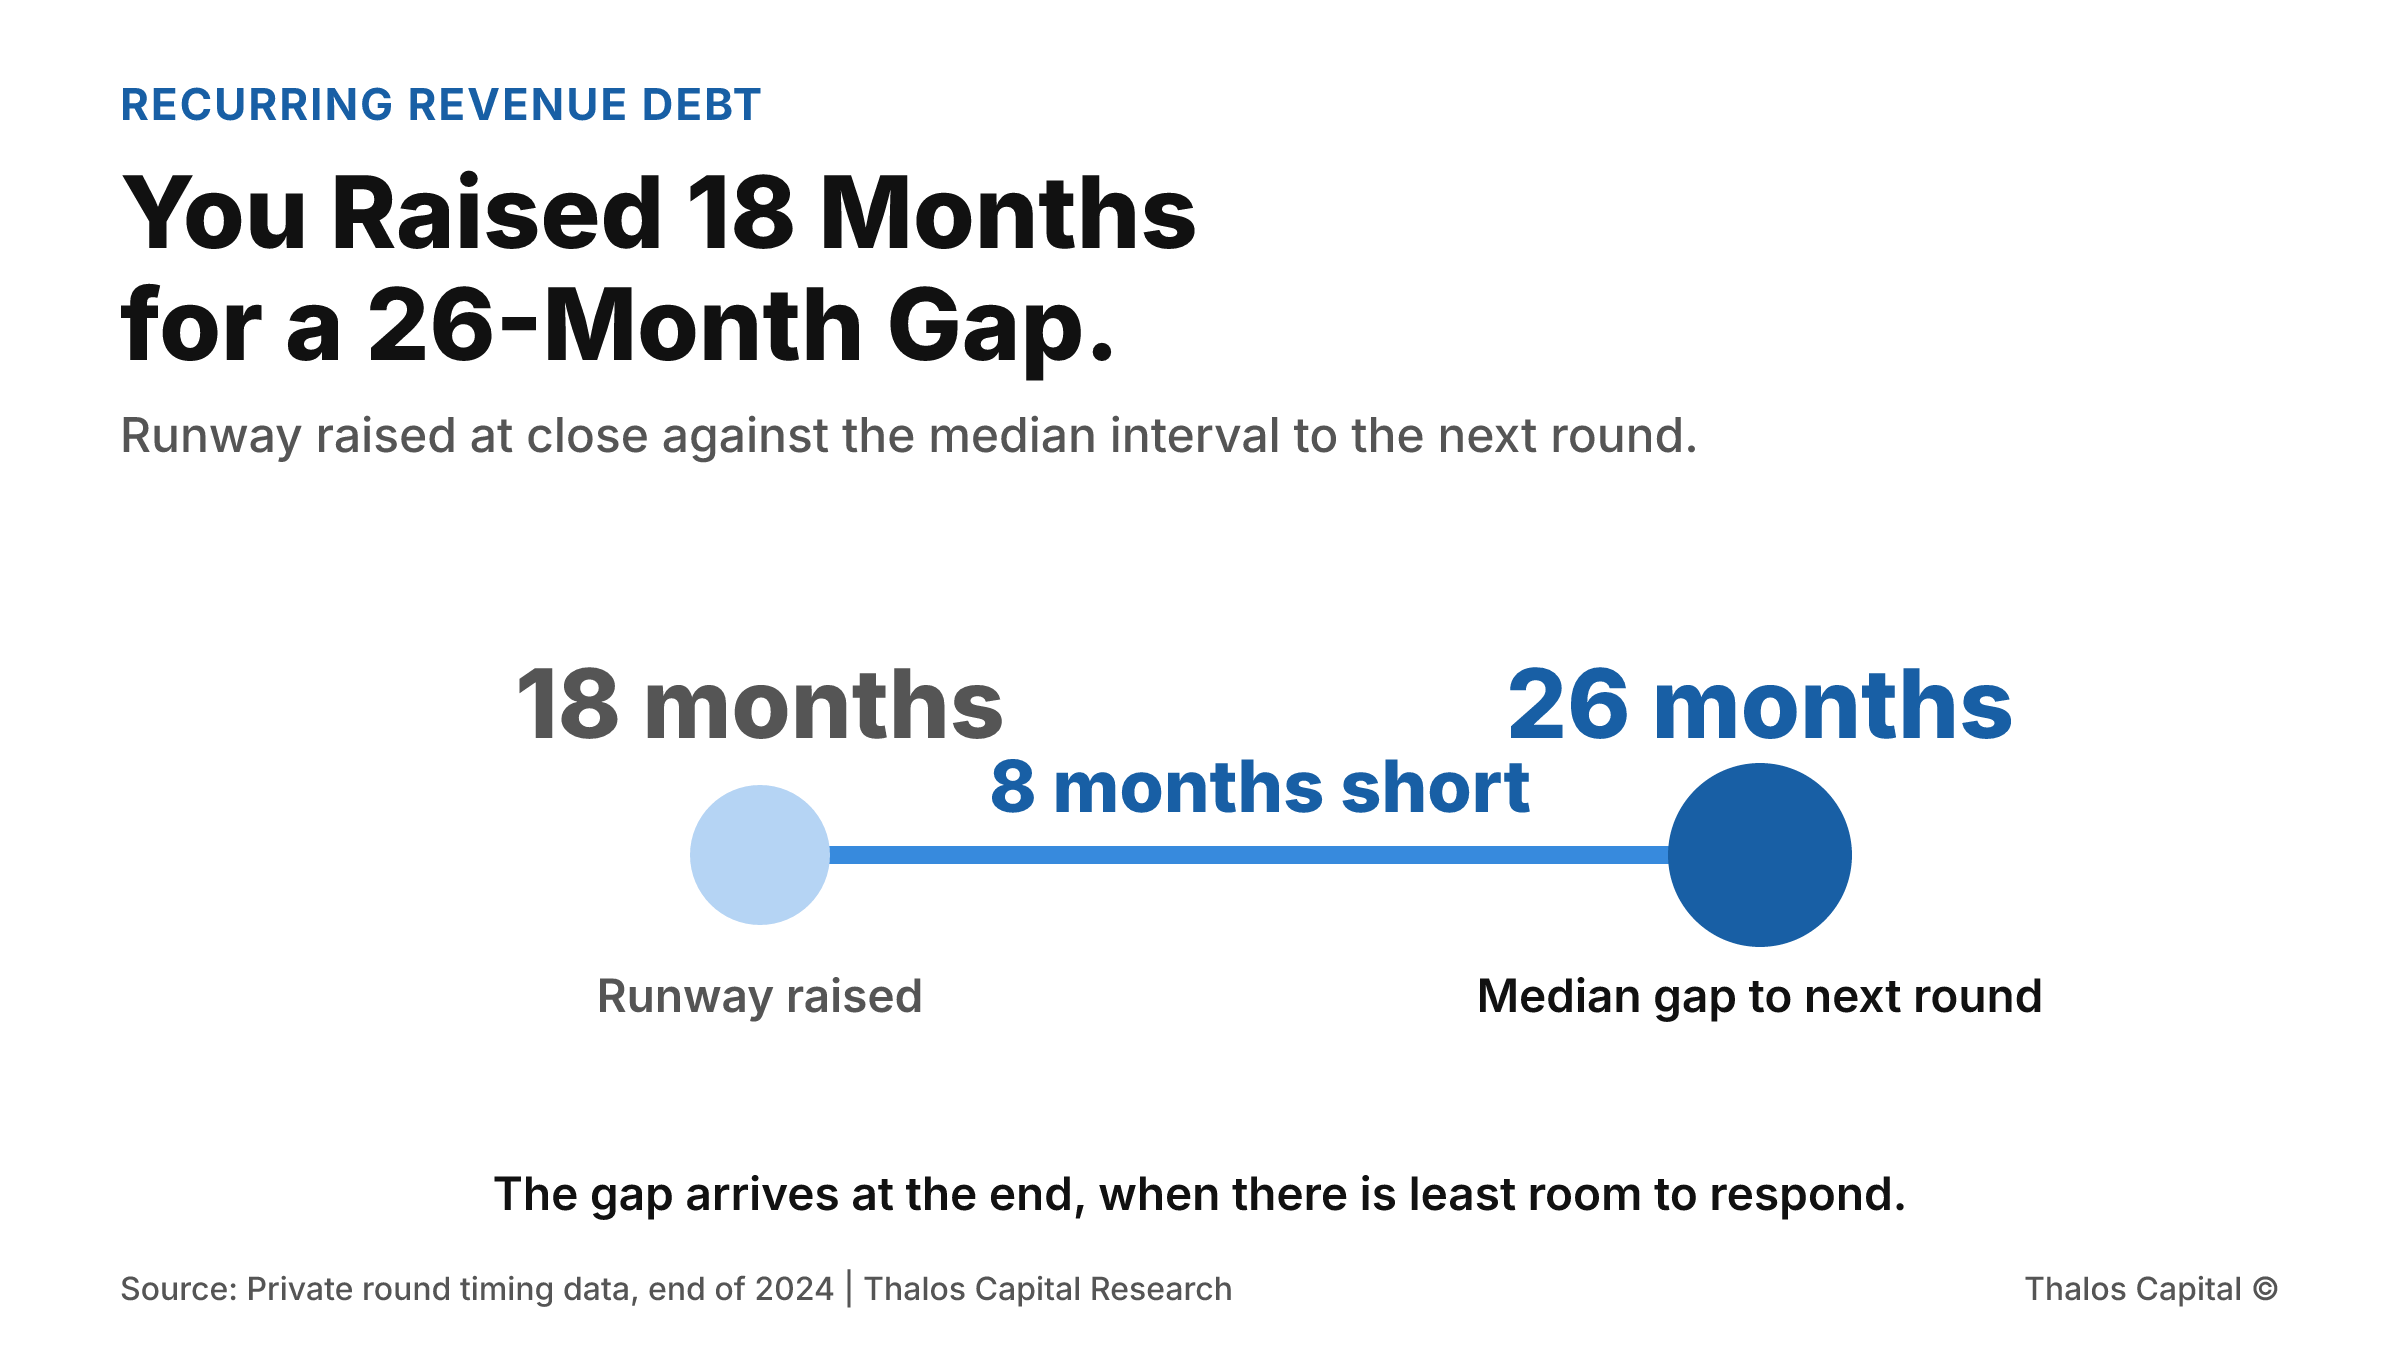
Two point range chart contrasting 18 months of runway raised at close against a median 26 month interval to the next round, with the eight month shortfall marked in navy.

You Raised 18 Months of Runway for a 26-Month Gap.

The median interval from seed to Series A has stretched to roughly 2.2 years. A company that closed with 18 months of cash is eight months short before it does anything wrong. What the decision looks like at month 10 against month 16.
Read More
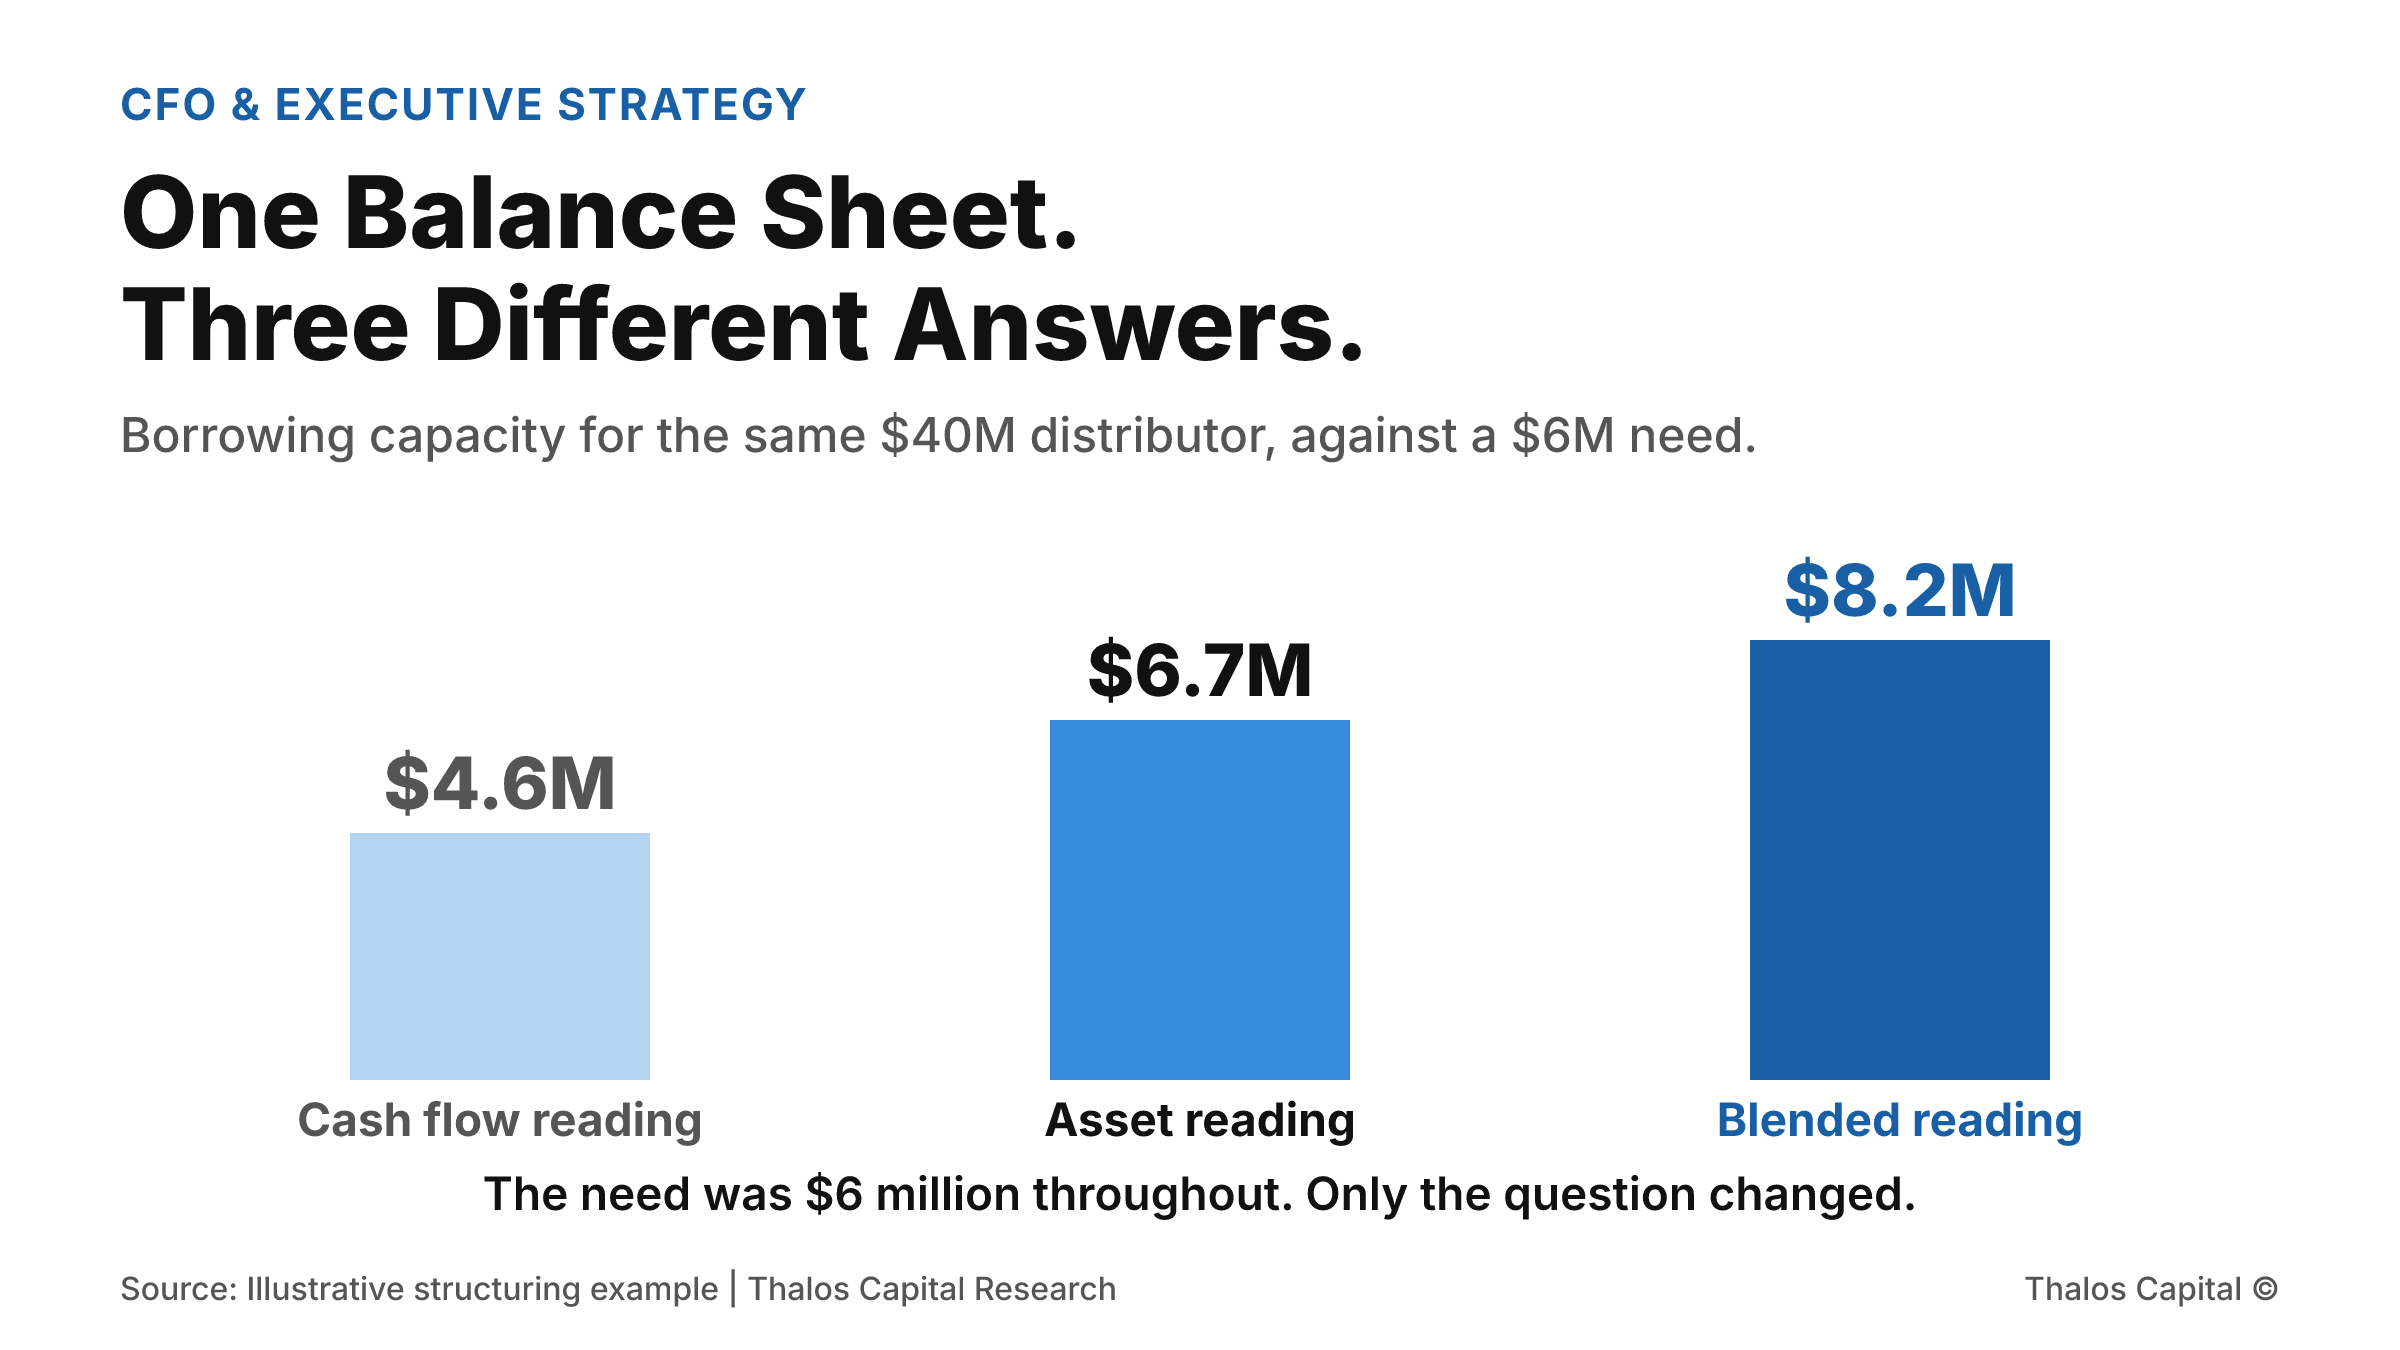
Column chart showing three borrowing capacity readings for the same distributor: $4.6 million on a cash flow reading, $6.7 million on an asset reading, and $8.2 million on a blended reading shown in the darkest navy, against a $6 million financing need.

One Balance Sheet. Three Different Answers.

A distributor doing $40 million in revenue needs $6 million. Read against cash flow it is short. Read against its assets it clears. Read as a blend it borrows $8.2 million. Same company, same week, three answers.
Read More
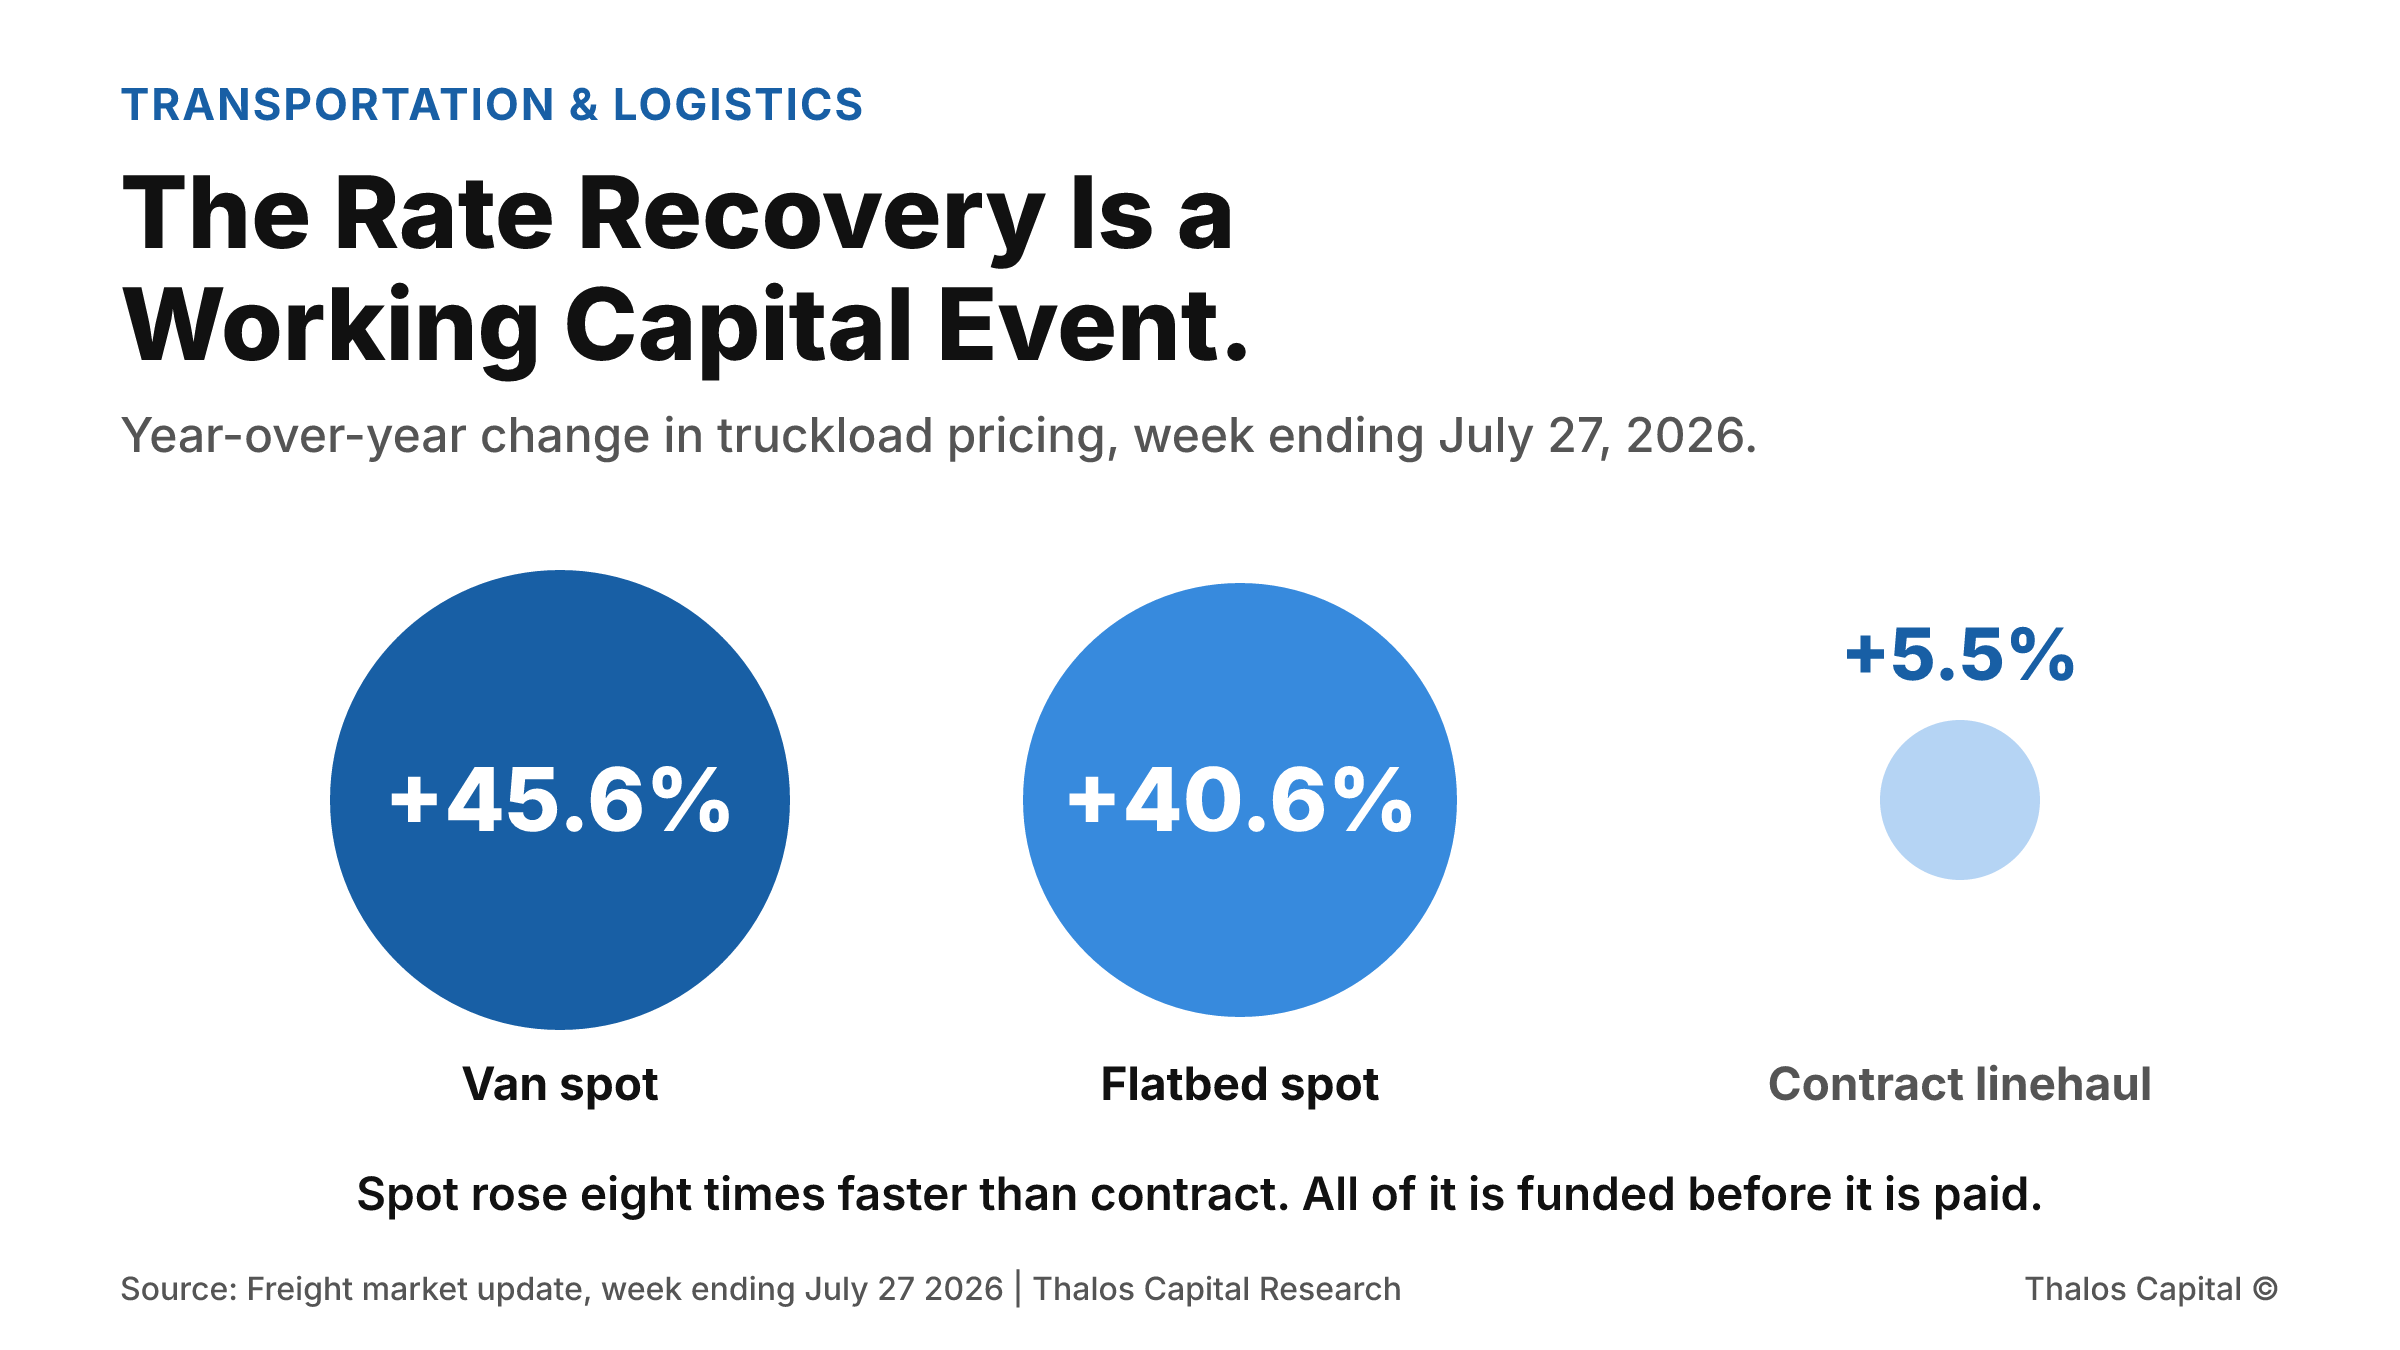
Three proportional circles comparing year-over-year price change in the week ending July 27, 2026: van spot up 45.6 percent shown as the largest navy circle, flatbed spot up 40.6 percent, and contract linehaul pricing up 5.5 percent as a much smaller pale circle.

The Rate Recovery Is a Working Capital Event.

Van spot rates ran 45.6 percent above a year ago in late July while diesel climbed 13.8 percent in four weeks. Both movements enlarge the cash a carrier funds before it gets paid. Why a better freight market consumes capital.
Read More
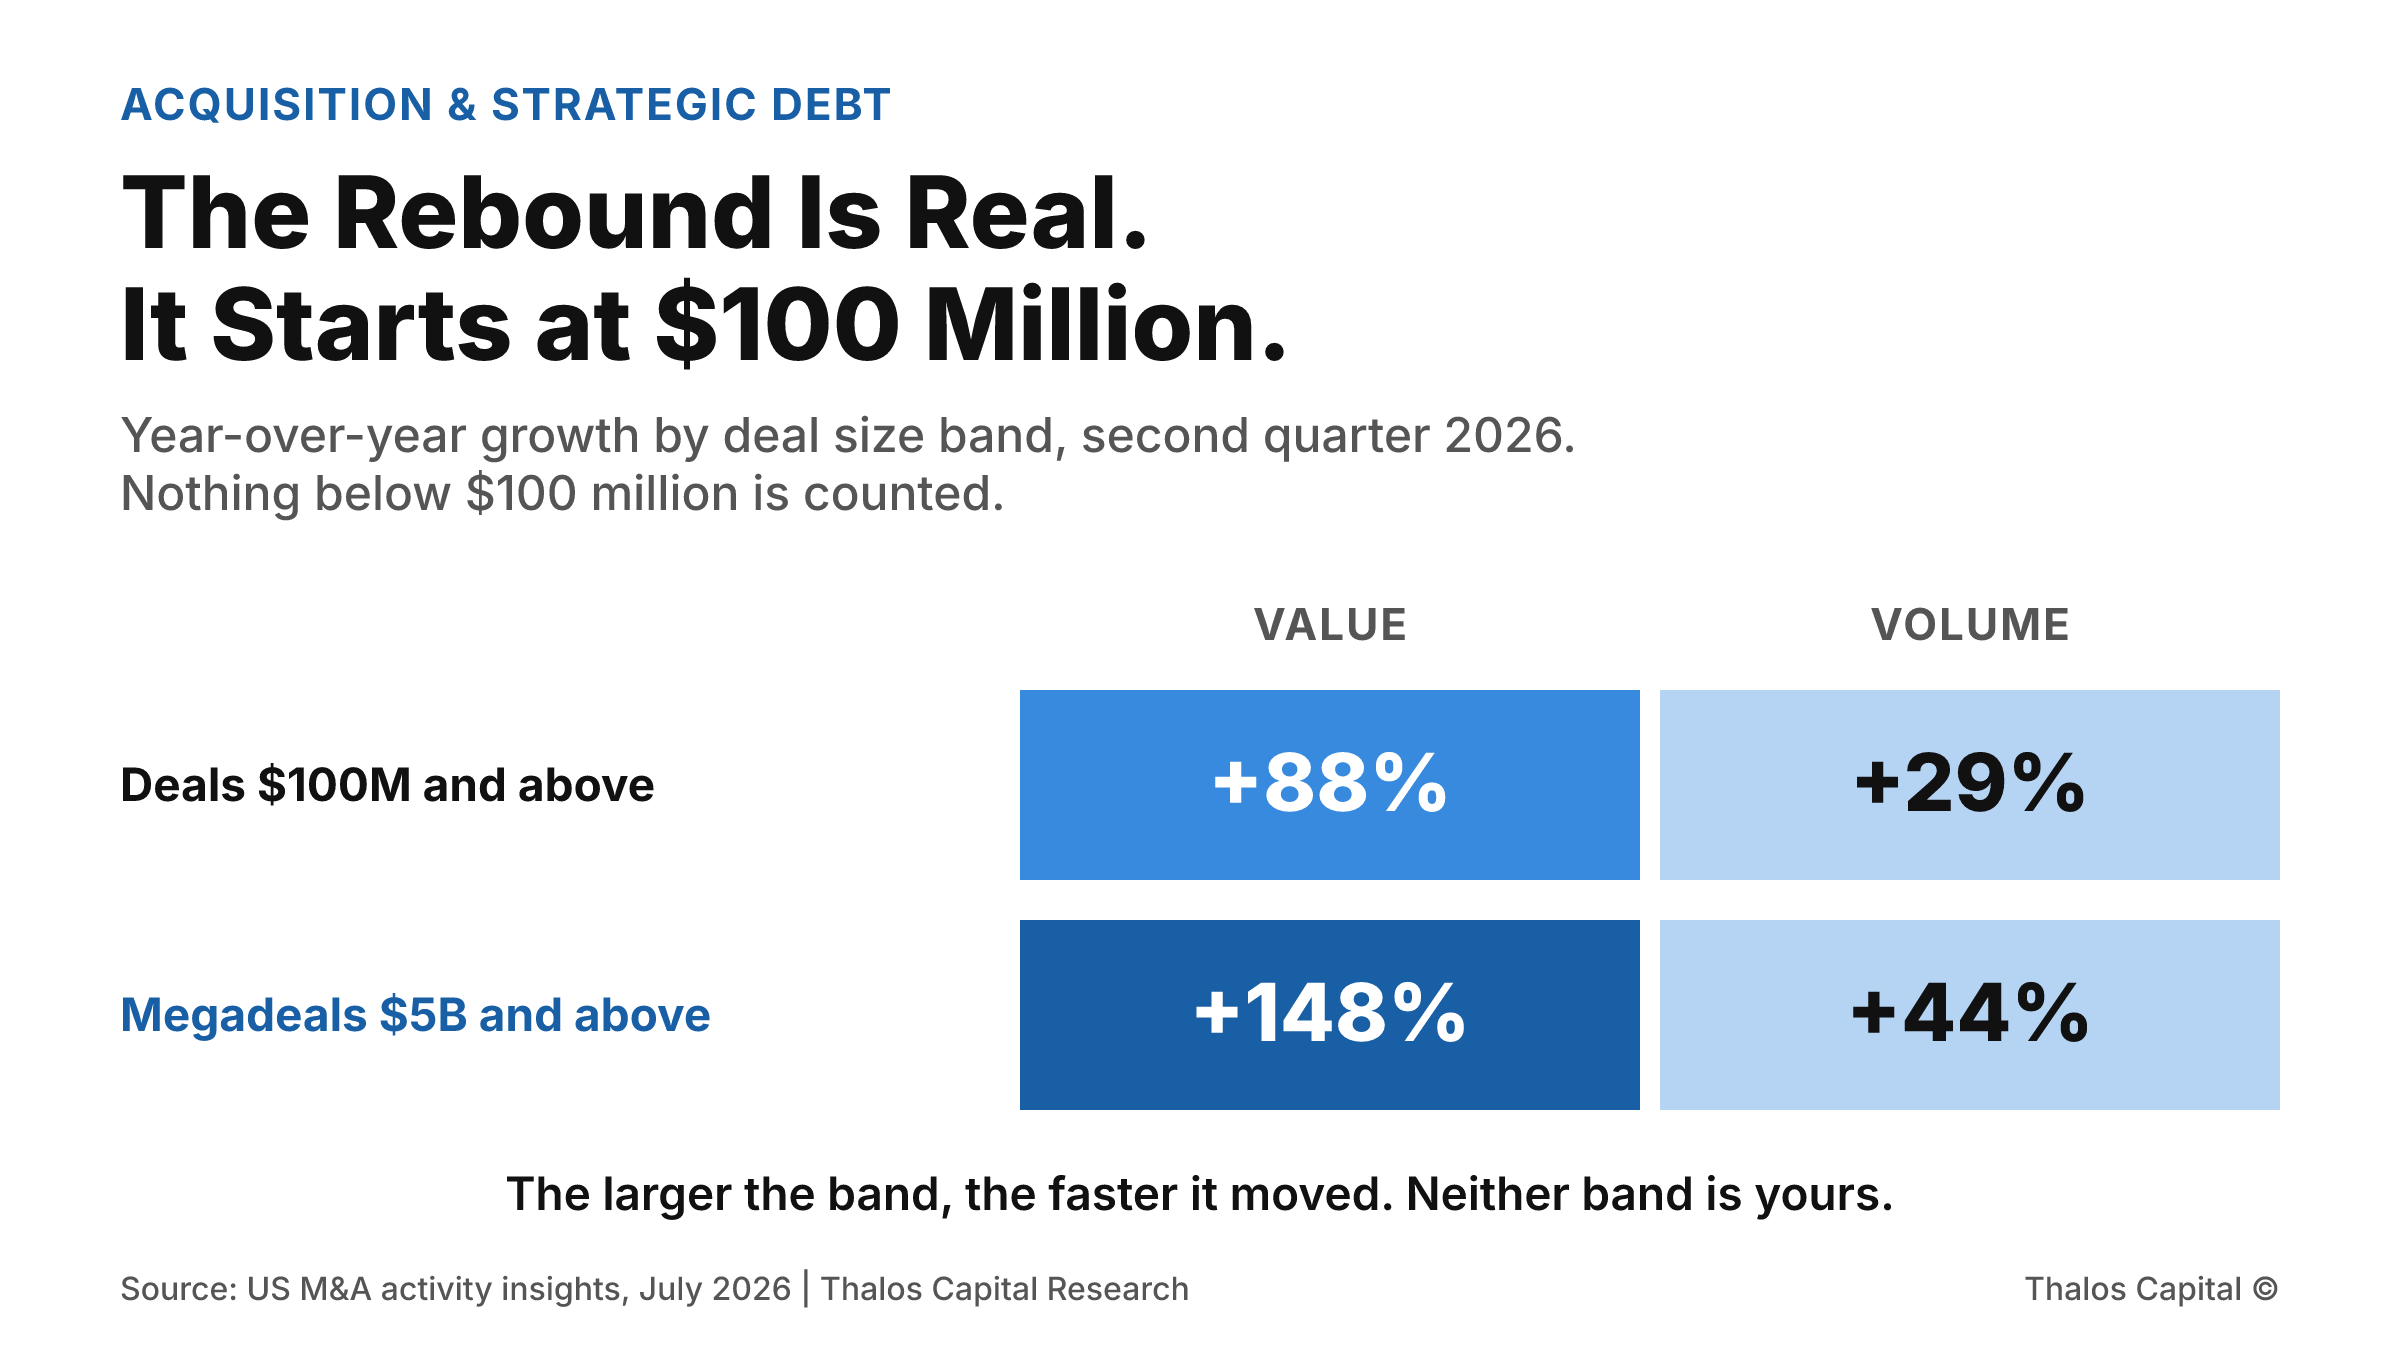
Shaded grid comparing year-over-year growth in the second quarter of 2026 for two deal size bands: transactions of $100 million or more grew 88 percent in value and 29 percent in volume, while megadeals of $5 billion or more grew 148 percent in value and 44 percent in volume, with the 148 percent figure shown in the darkest navy.

The Rebound Is Real. It Starts at $100 Million.

Second-quarter deals of $100 million or more rose 88 percent in value and 29 percent in volume, and the data that reports it does not count anything smaller. What that means for a buyer working a $5 to $50 million acquisition.
Read More
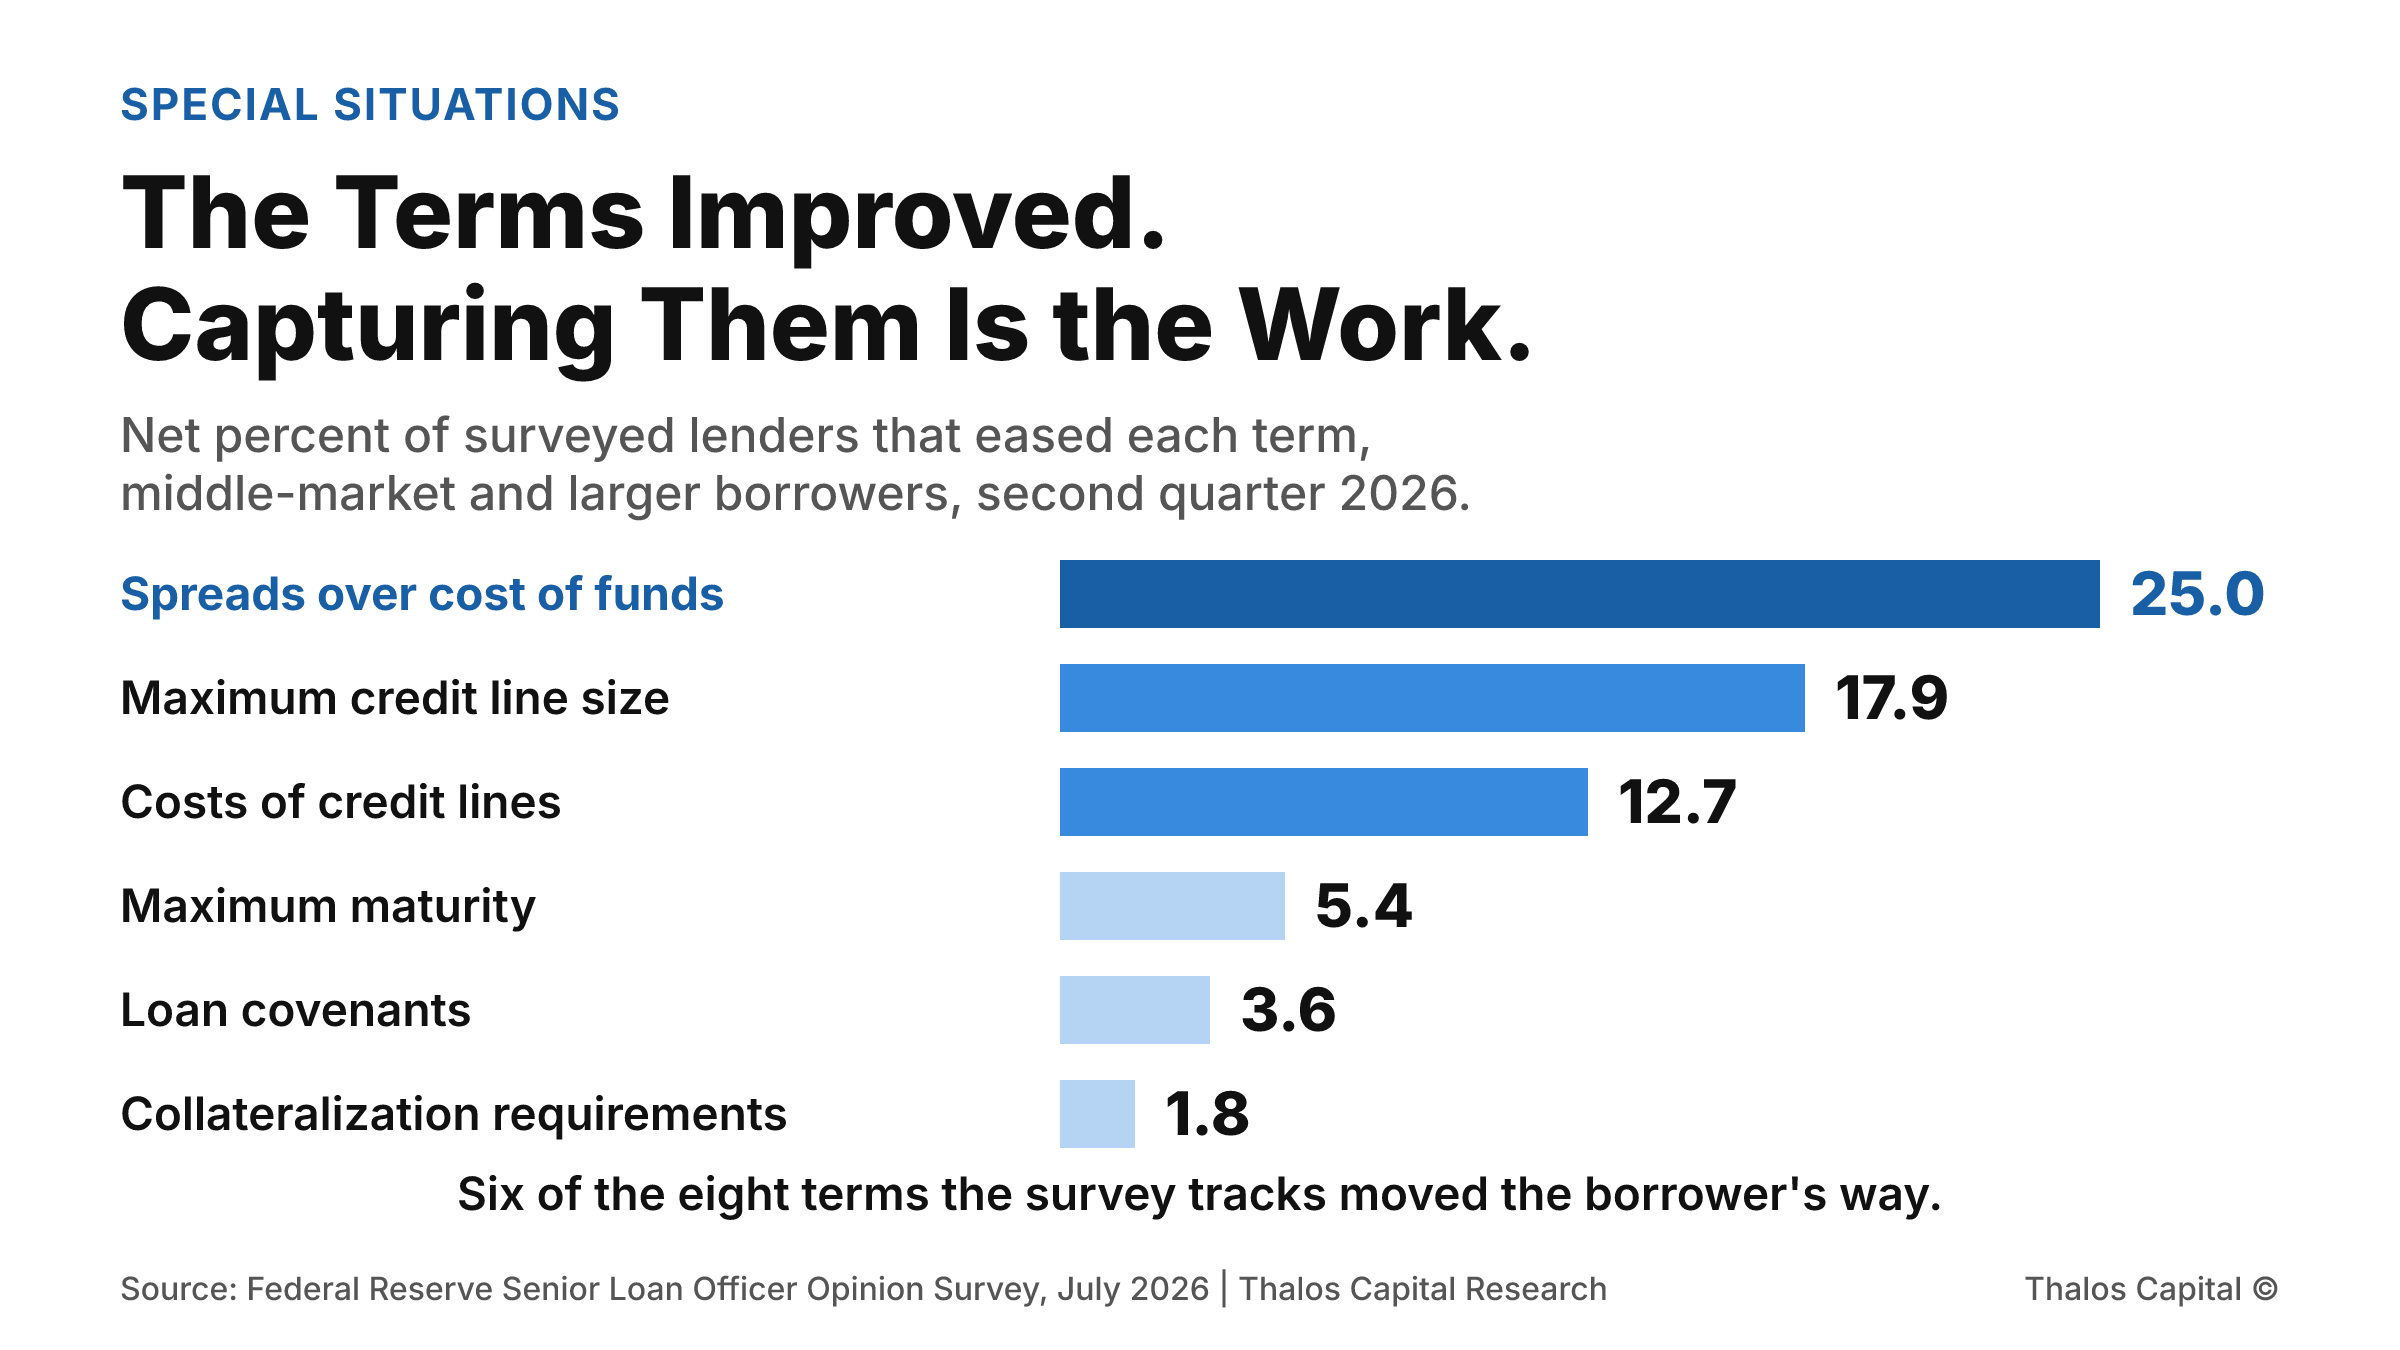
Ordered horizontal bars showing the net percent of surveyed lenders that eased each commercial and industrial loan term in the second quarter of 2026, led by spreads over cost of funds at 25.0 percent, then credit line size at 17.9, cost of credit lines at 12.7, maturity at 5.4, covenants at 3.6, and collateralization at 1.8.

The Terms Improved. Capturing Them Is the Work.

A net 25 percent of surveyed lenders narrowed spreads on middle-market loans last quarter, and six of eight tracked terms moved the borrower's way. Complex, regulated, and non-sponsor situations capture that only if the file fits the mandate.
Read More
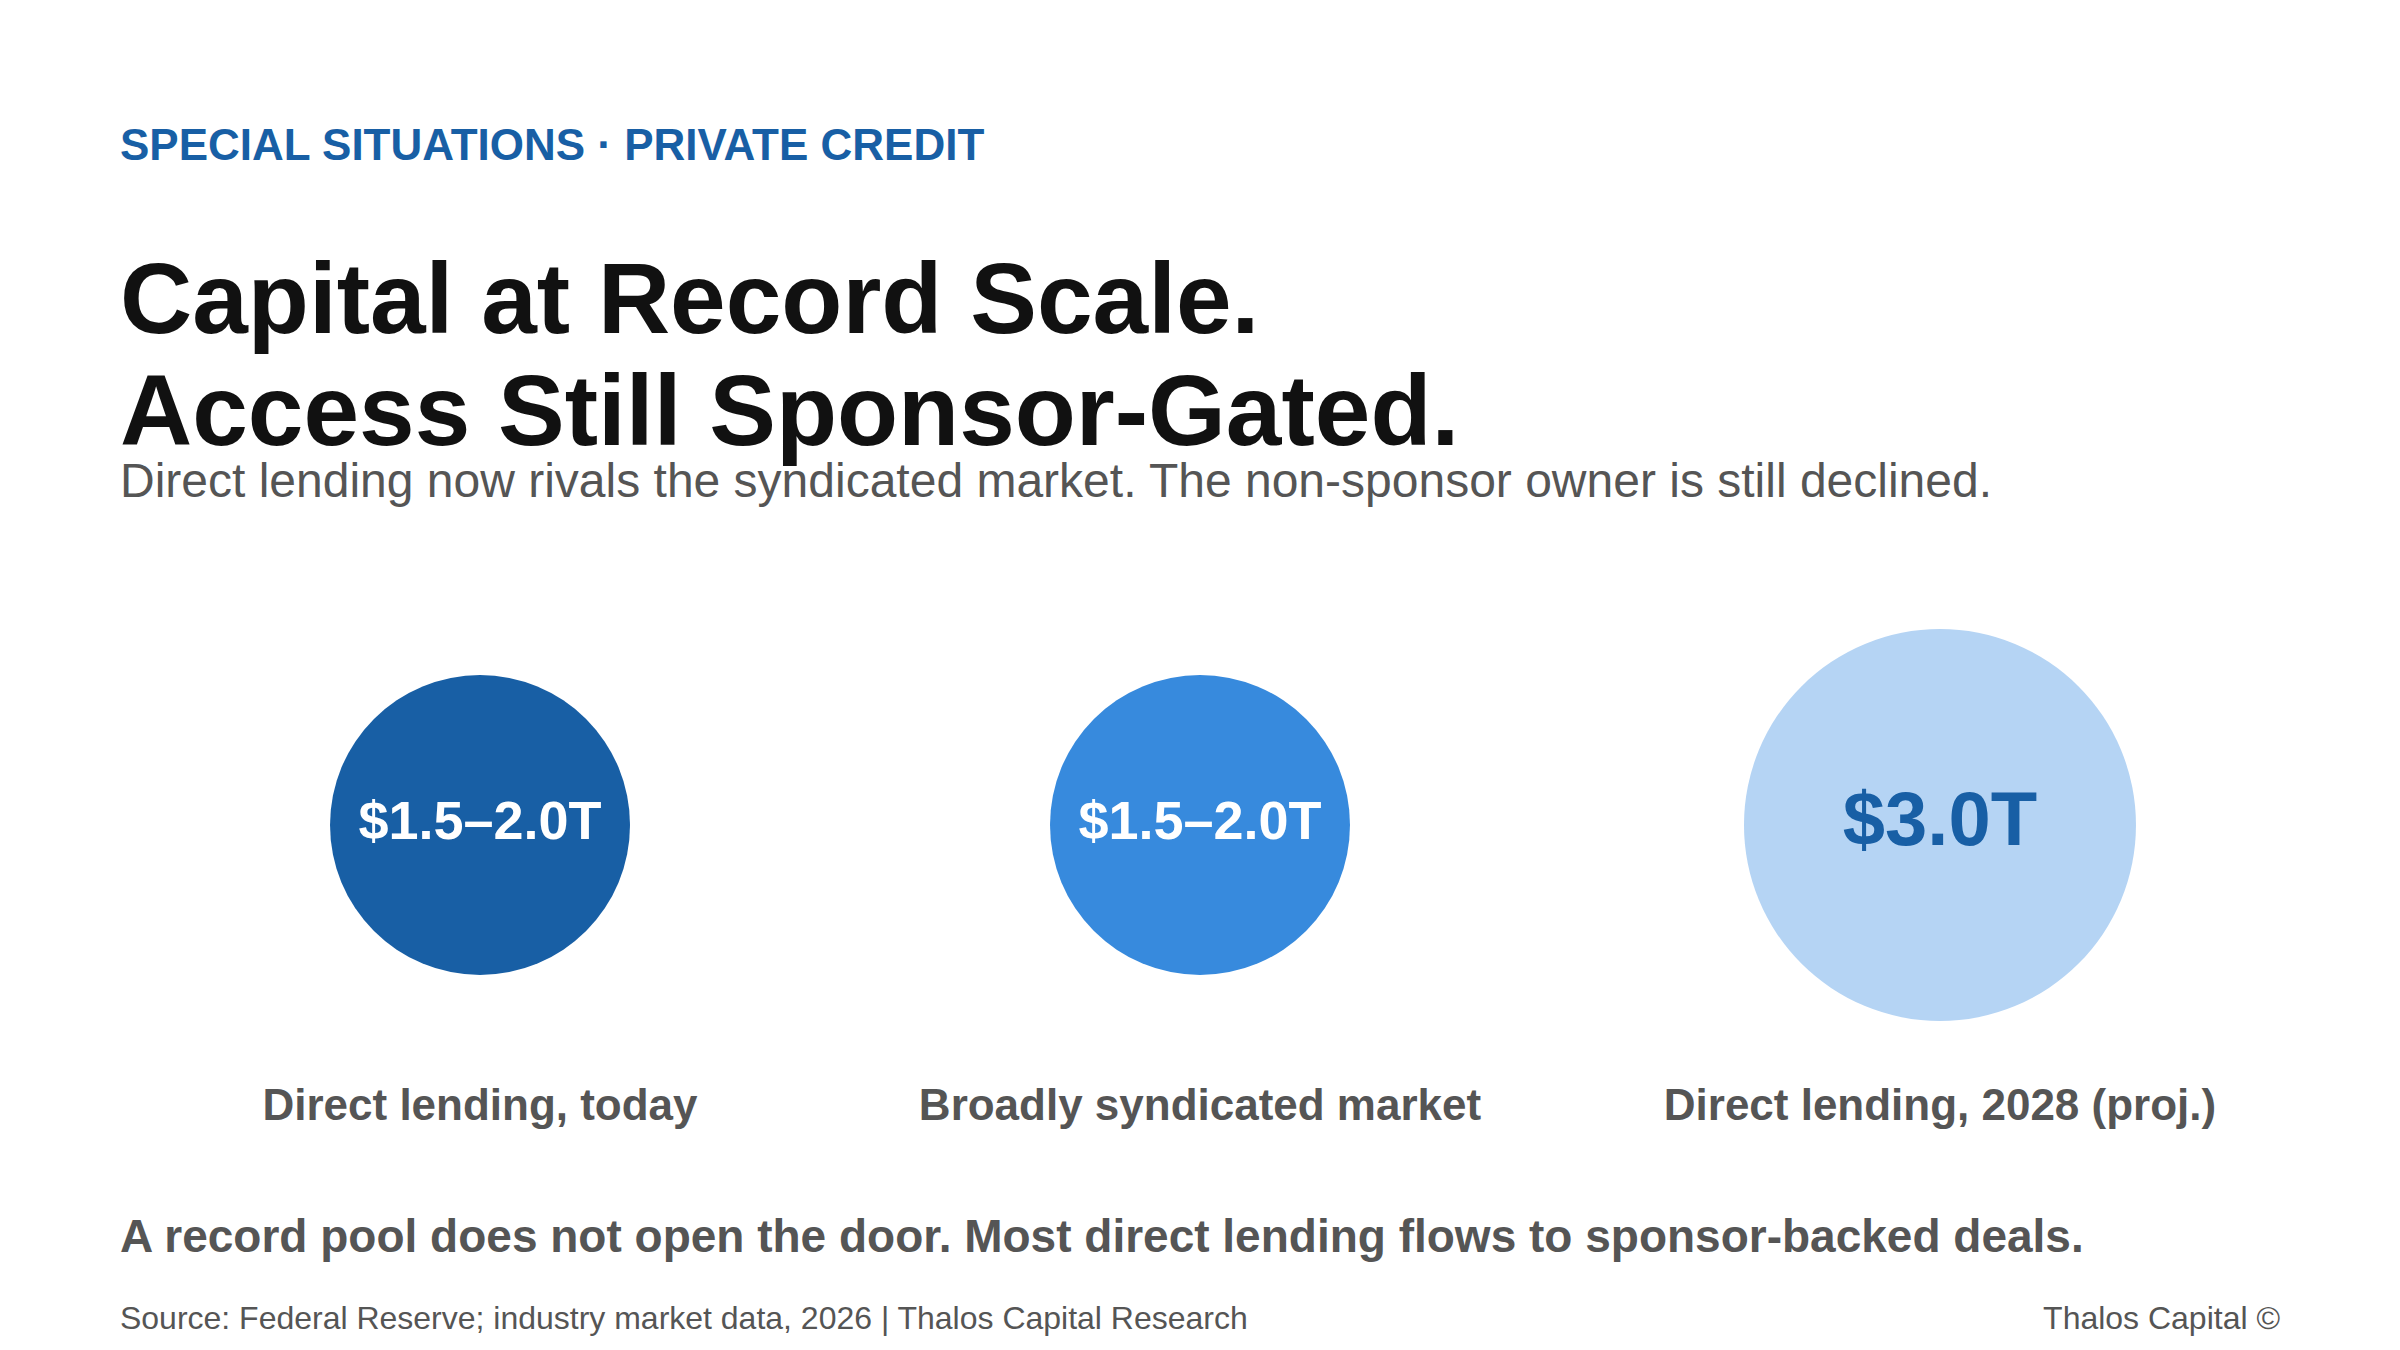
Proportional circles comparing direct lending today at $1.5 to $2 trillion, the broadly syndicated market at a comparable size, and a projected $3 trillion direct lending market by 2028.

Private Credit Has Never Had More Money. The Independent Owner Still Hears No.

Direct lending now rivals the syndicated market at $1.5 to $2 trillion, but the majority flows to sponsor-backed deals. Why non-sponsor owners get declined, and what closes the gap.
Read More
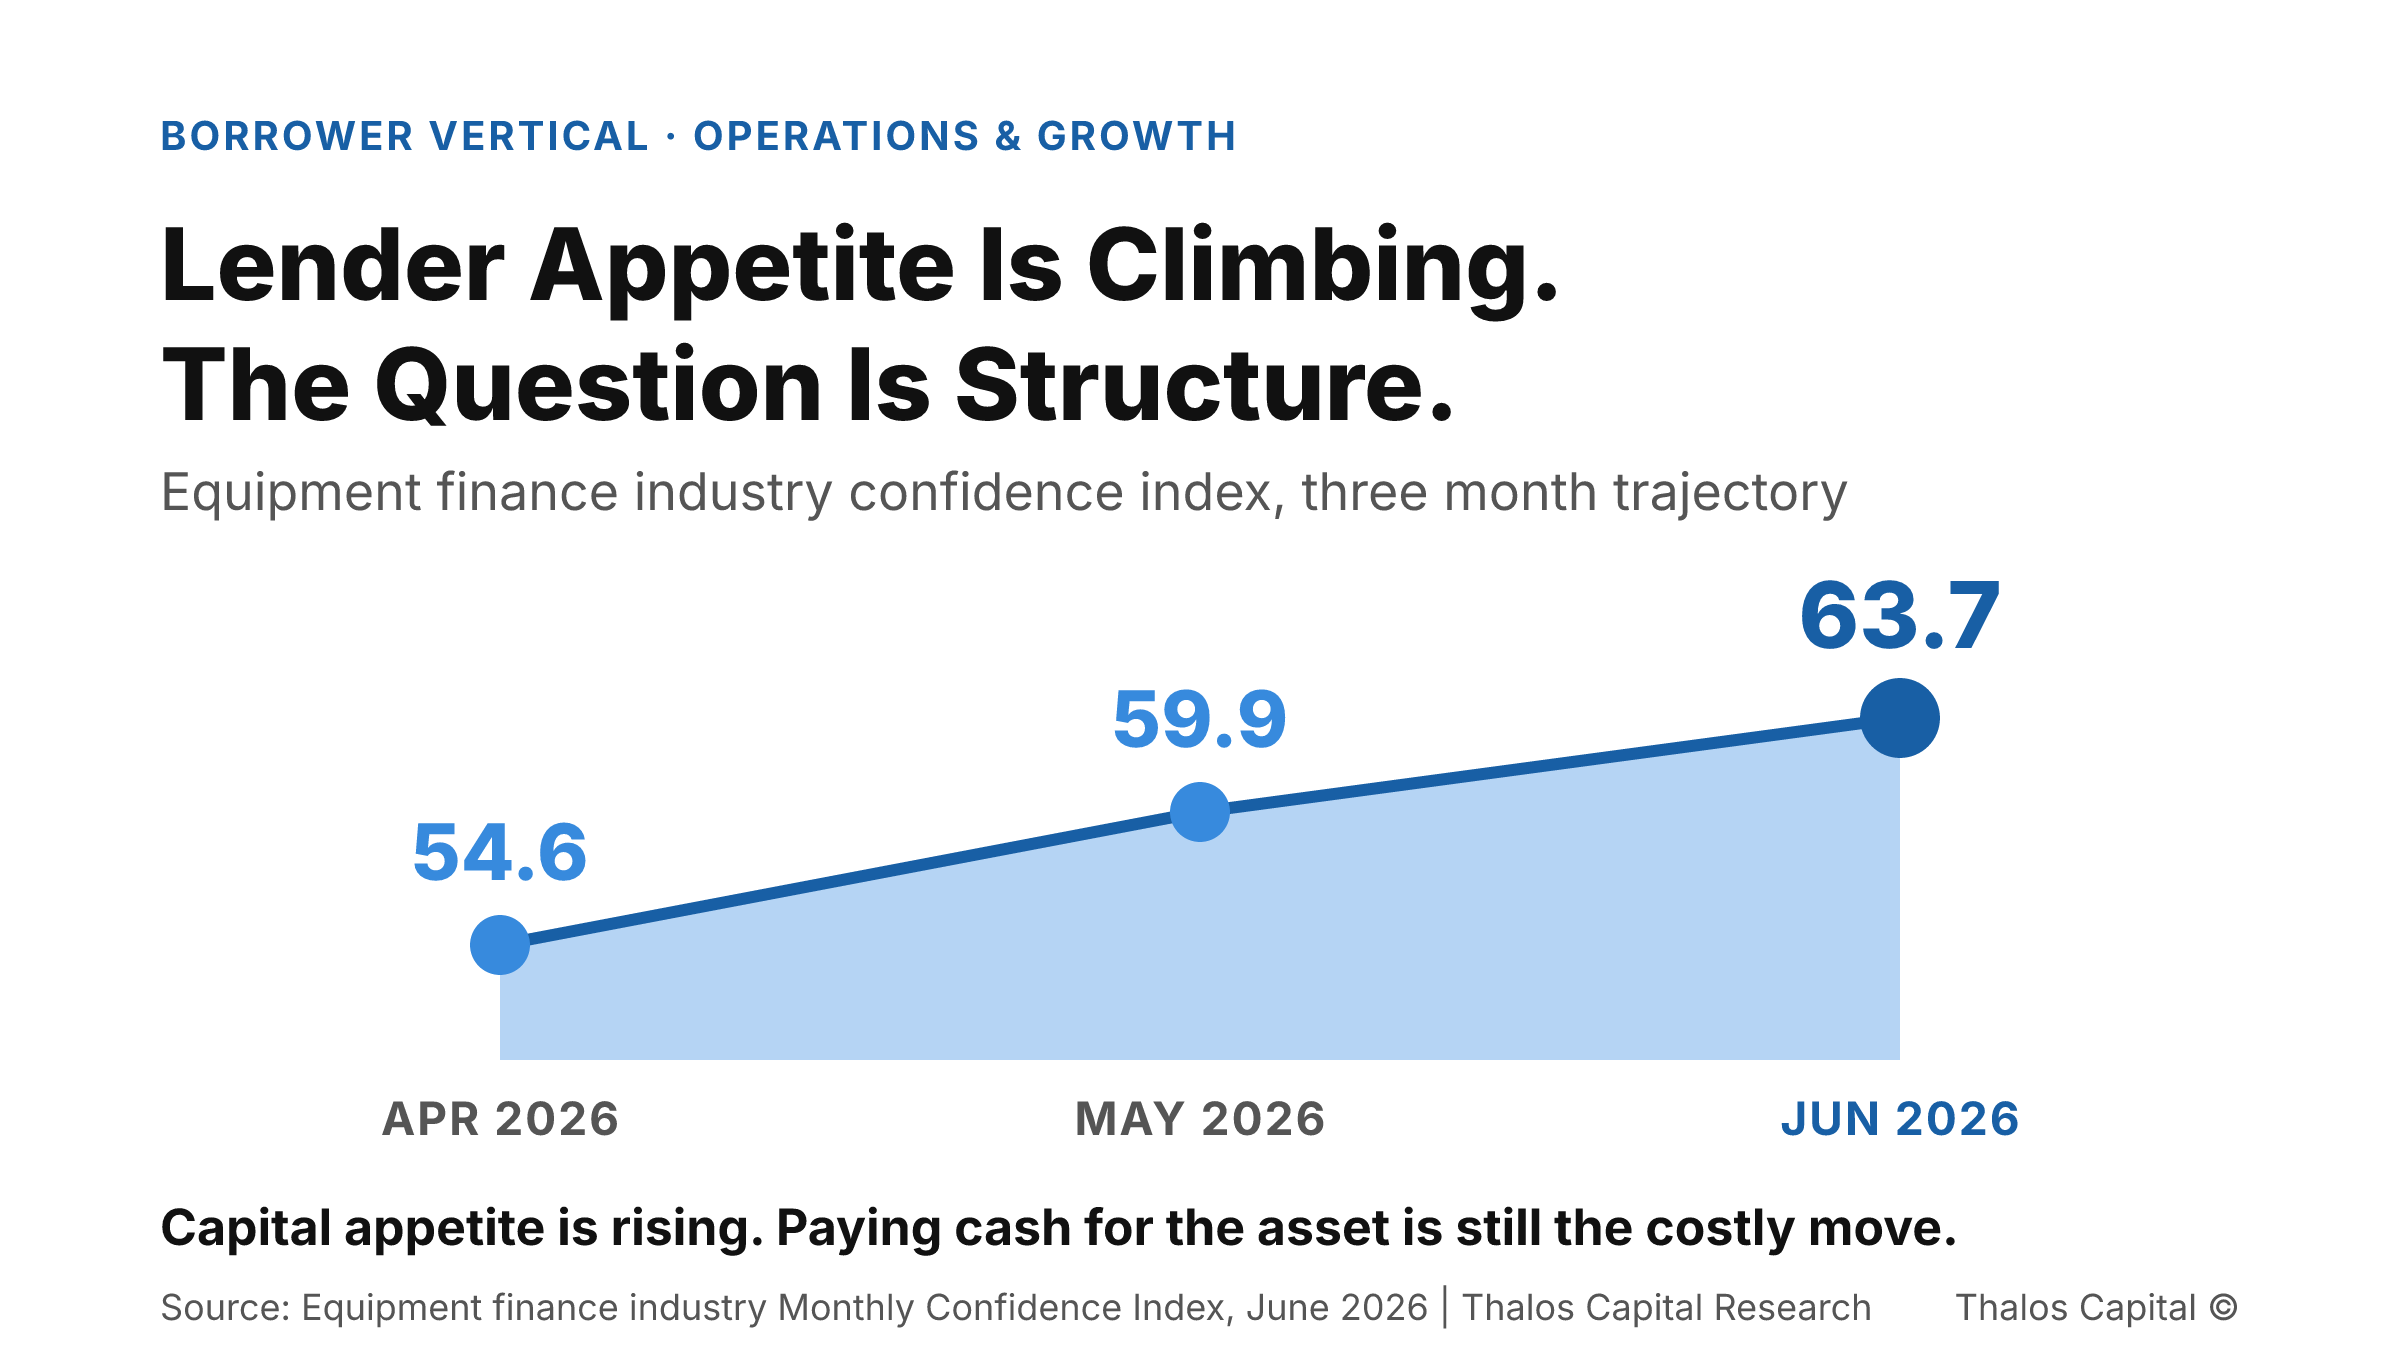
Filled area trend chart showing the equipment finance industry monthly confidence index climbing from 54.6 in April 2026 to 59.9 in May to 63.7 in June.

Paying Cash for Equipment Is Not the Conservative Move. It Is the Expensive One.

Capex demand is rising into a working capital squeeze. Why paying cash for equipment is the expensive move, and how layering the structure preserves the liquidity growth consumes.
Read More
Working through a financing decision?
Insights are a starting point. A conversation maps your actual options.
Tell us what you are financing and we will map the structures and sources that fit.
Submit your financing request →
Explore our financing solutions
Equipment FinancingWorking CapitalAsset-Based LendingStrategic Debt