Category

Capital Markets & Trends

25 insights · page 1 of 4

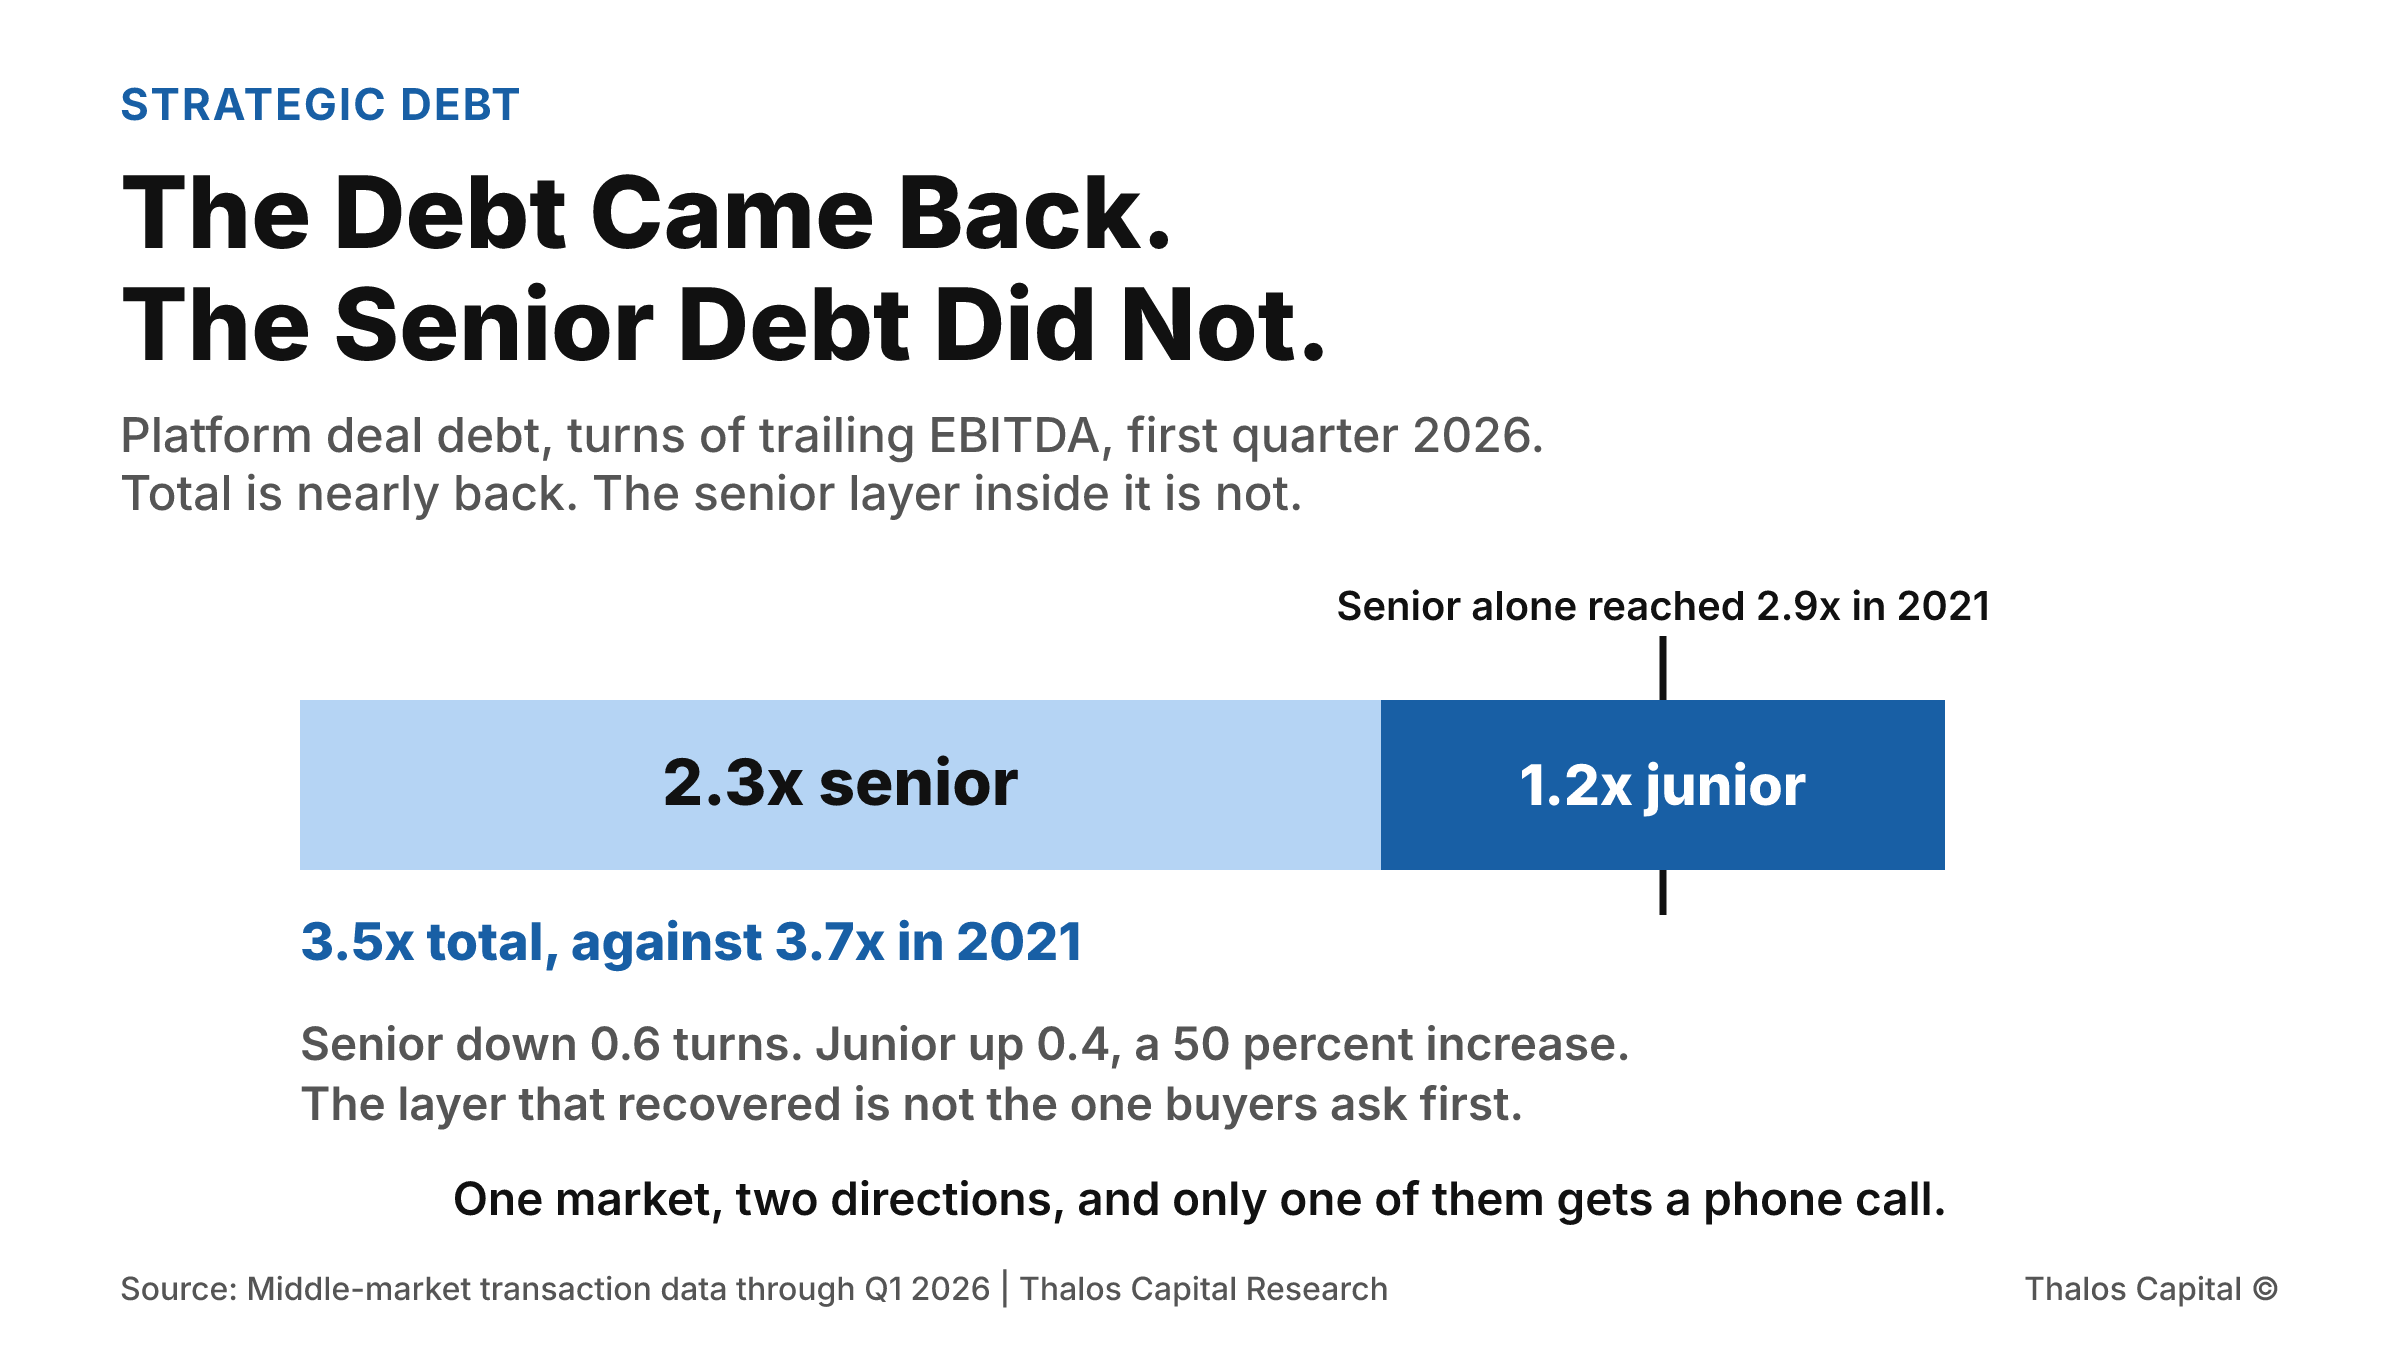
A single stacked bar showing platform deal debt at 3.5 times EBITDA in Q1 2026, split between 2.3 times of senior debt and 1.2 times of junior capital, with a marker showing that senior debt alone reached 2.9 times in 2021.

The Debt Came Back. The Senior Debt Did Not.

Acquisition leverage has recovered to roughly where it stood at the 2021 peak. On platform deals the senior layer has not, and the gap was filled by junior capital, which is not the pool most buyers approach first.
Read More
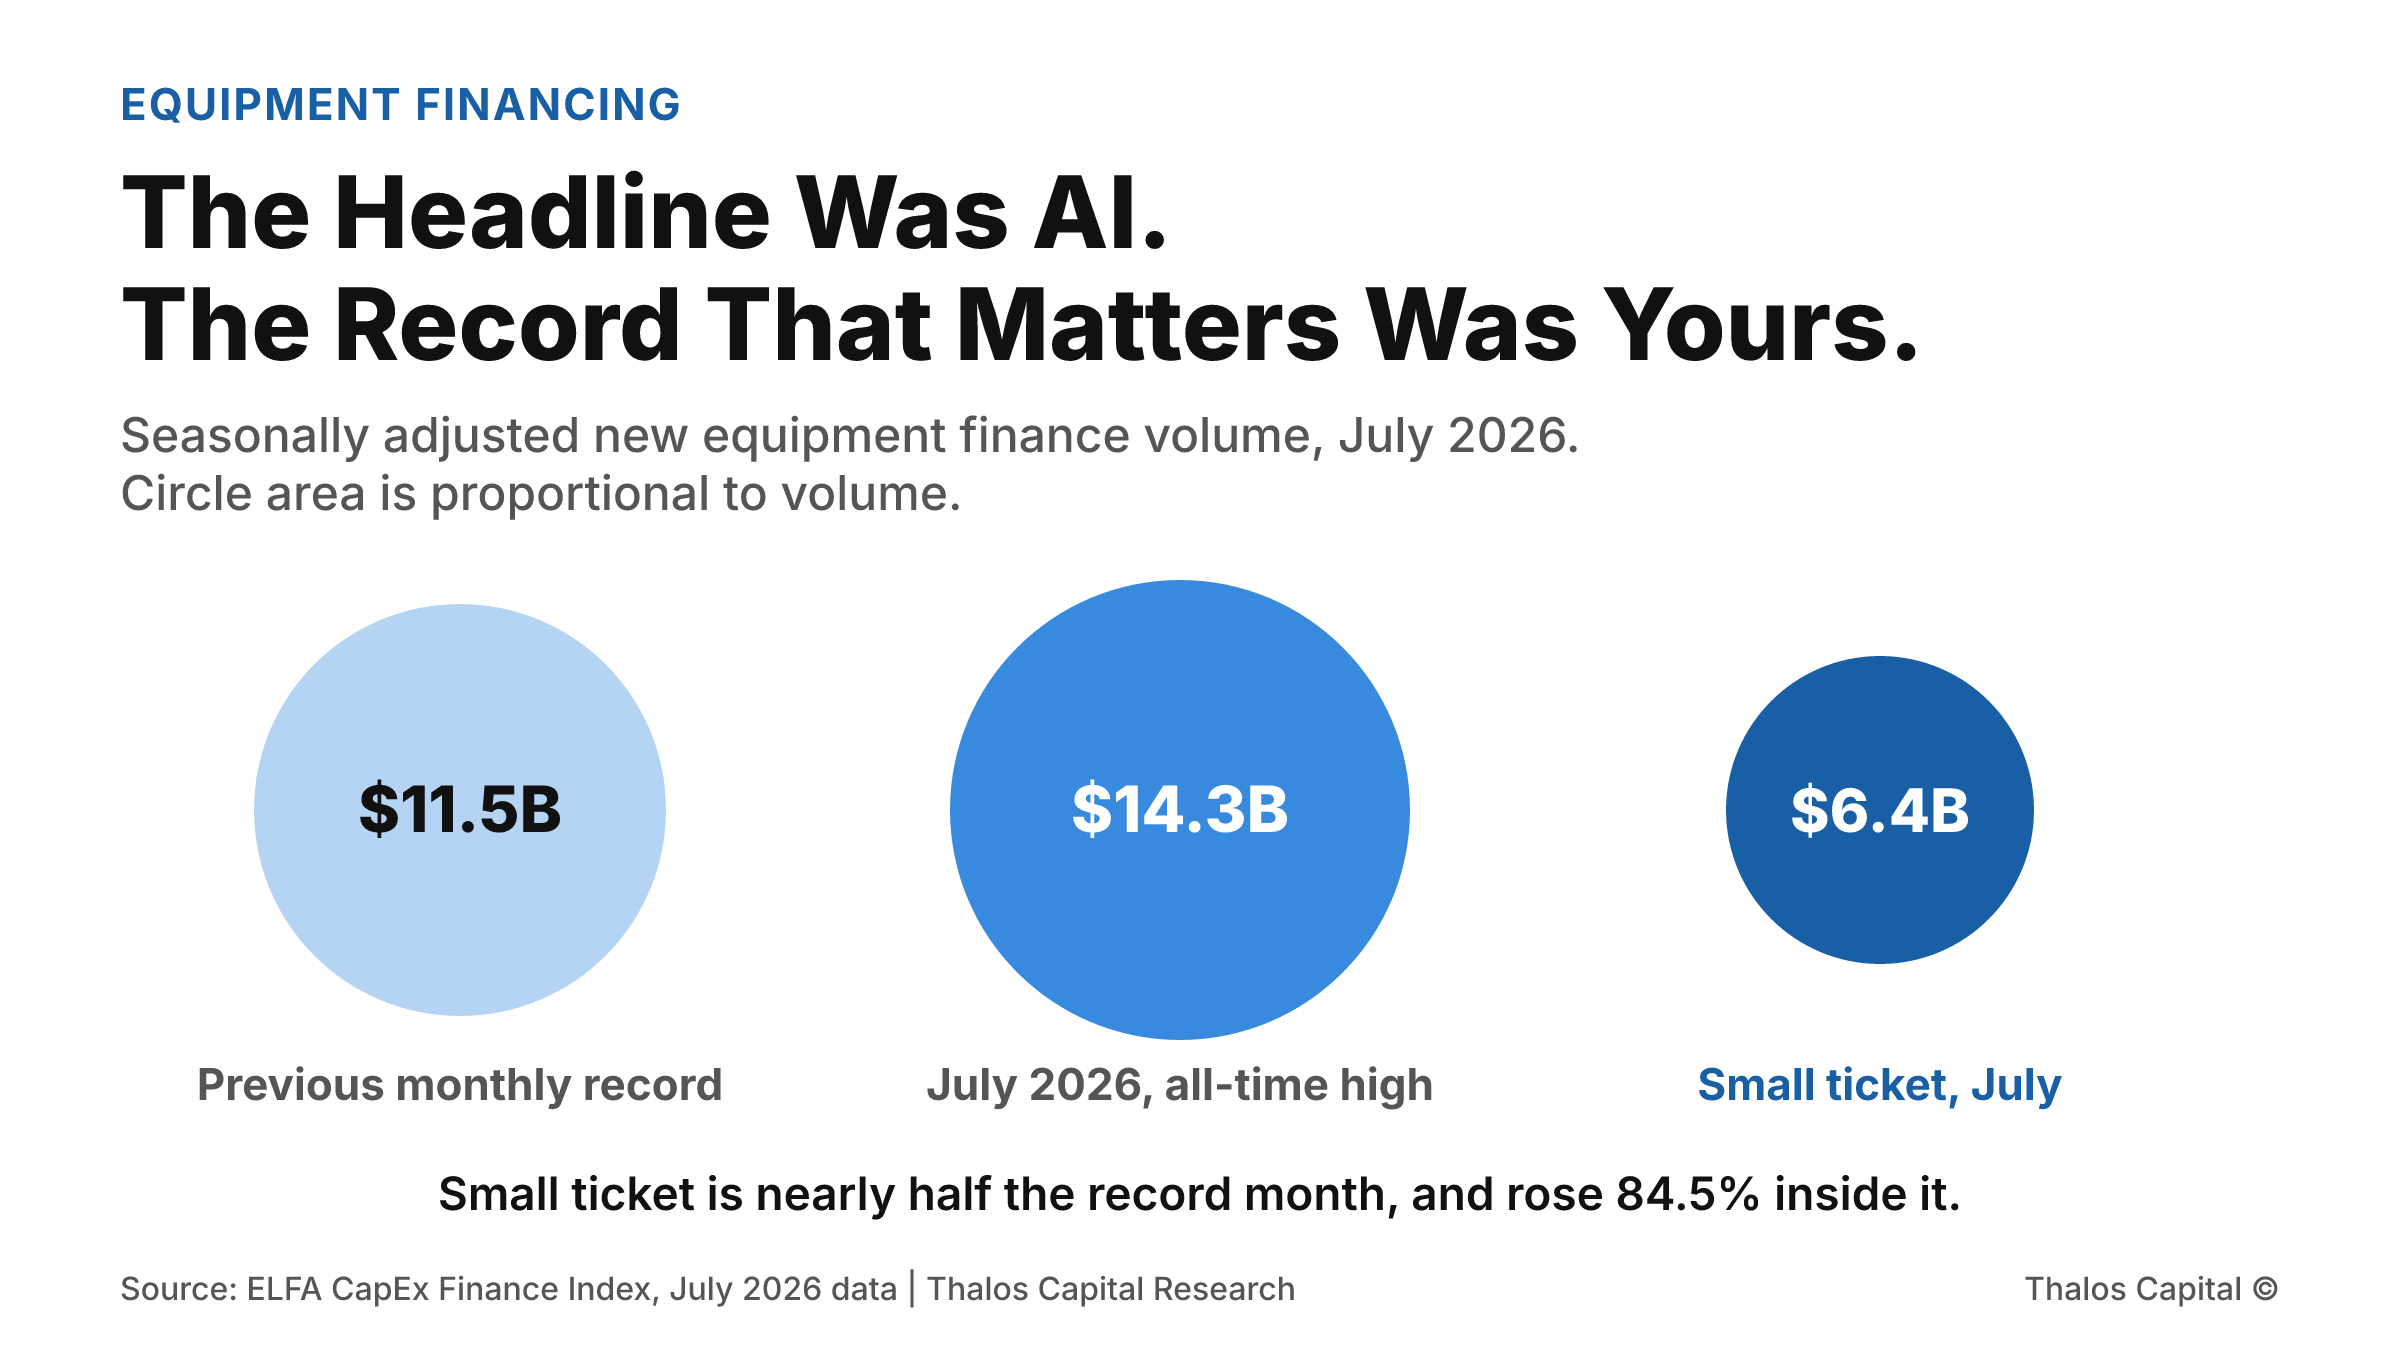
Three proportional circles comparing July 2026 equipment finance volume of $14.3 billion against the previous all-time monthly high of $11.5 billion, with small-ticket volume of $6.4 billion shown as nearly half of the record month.

The Headline Was AI. The Record That Matters Was Yours.

July set an all-time monthly record in equipment finance, and the coverage credited AI capital expenditure. Small-ticket volume set its own record in the same month, up 84.5 percent, and that is the segment mid-market borrowers actually borrow in.
Read More
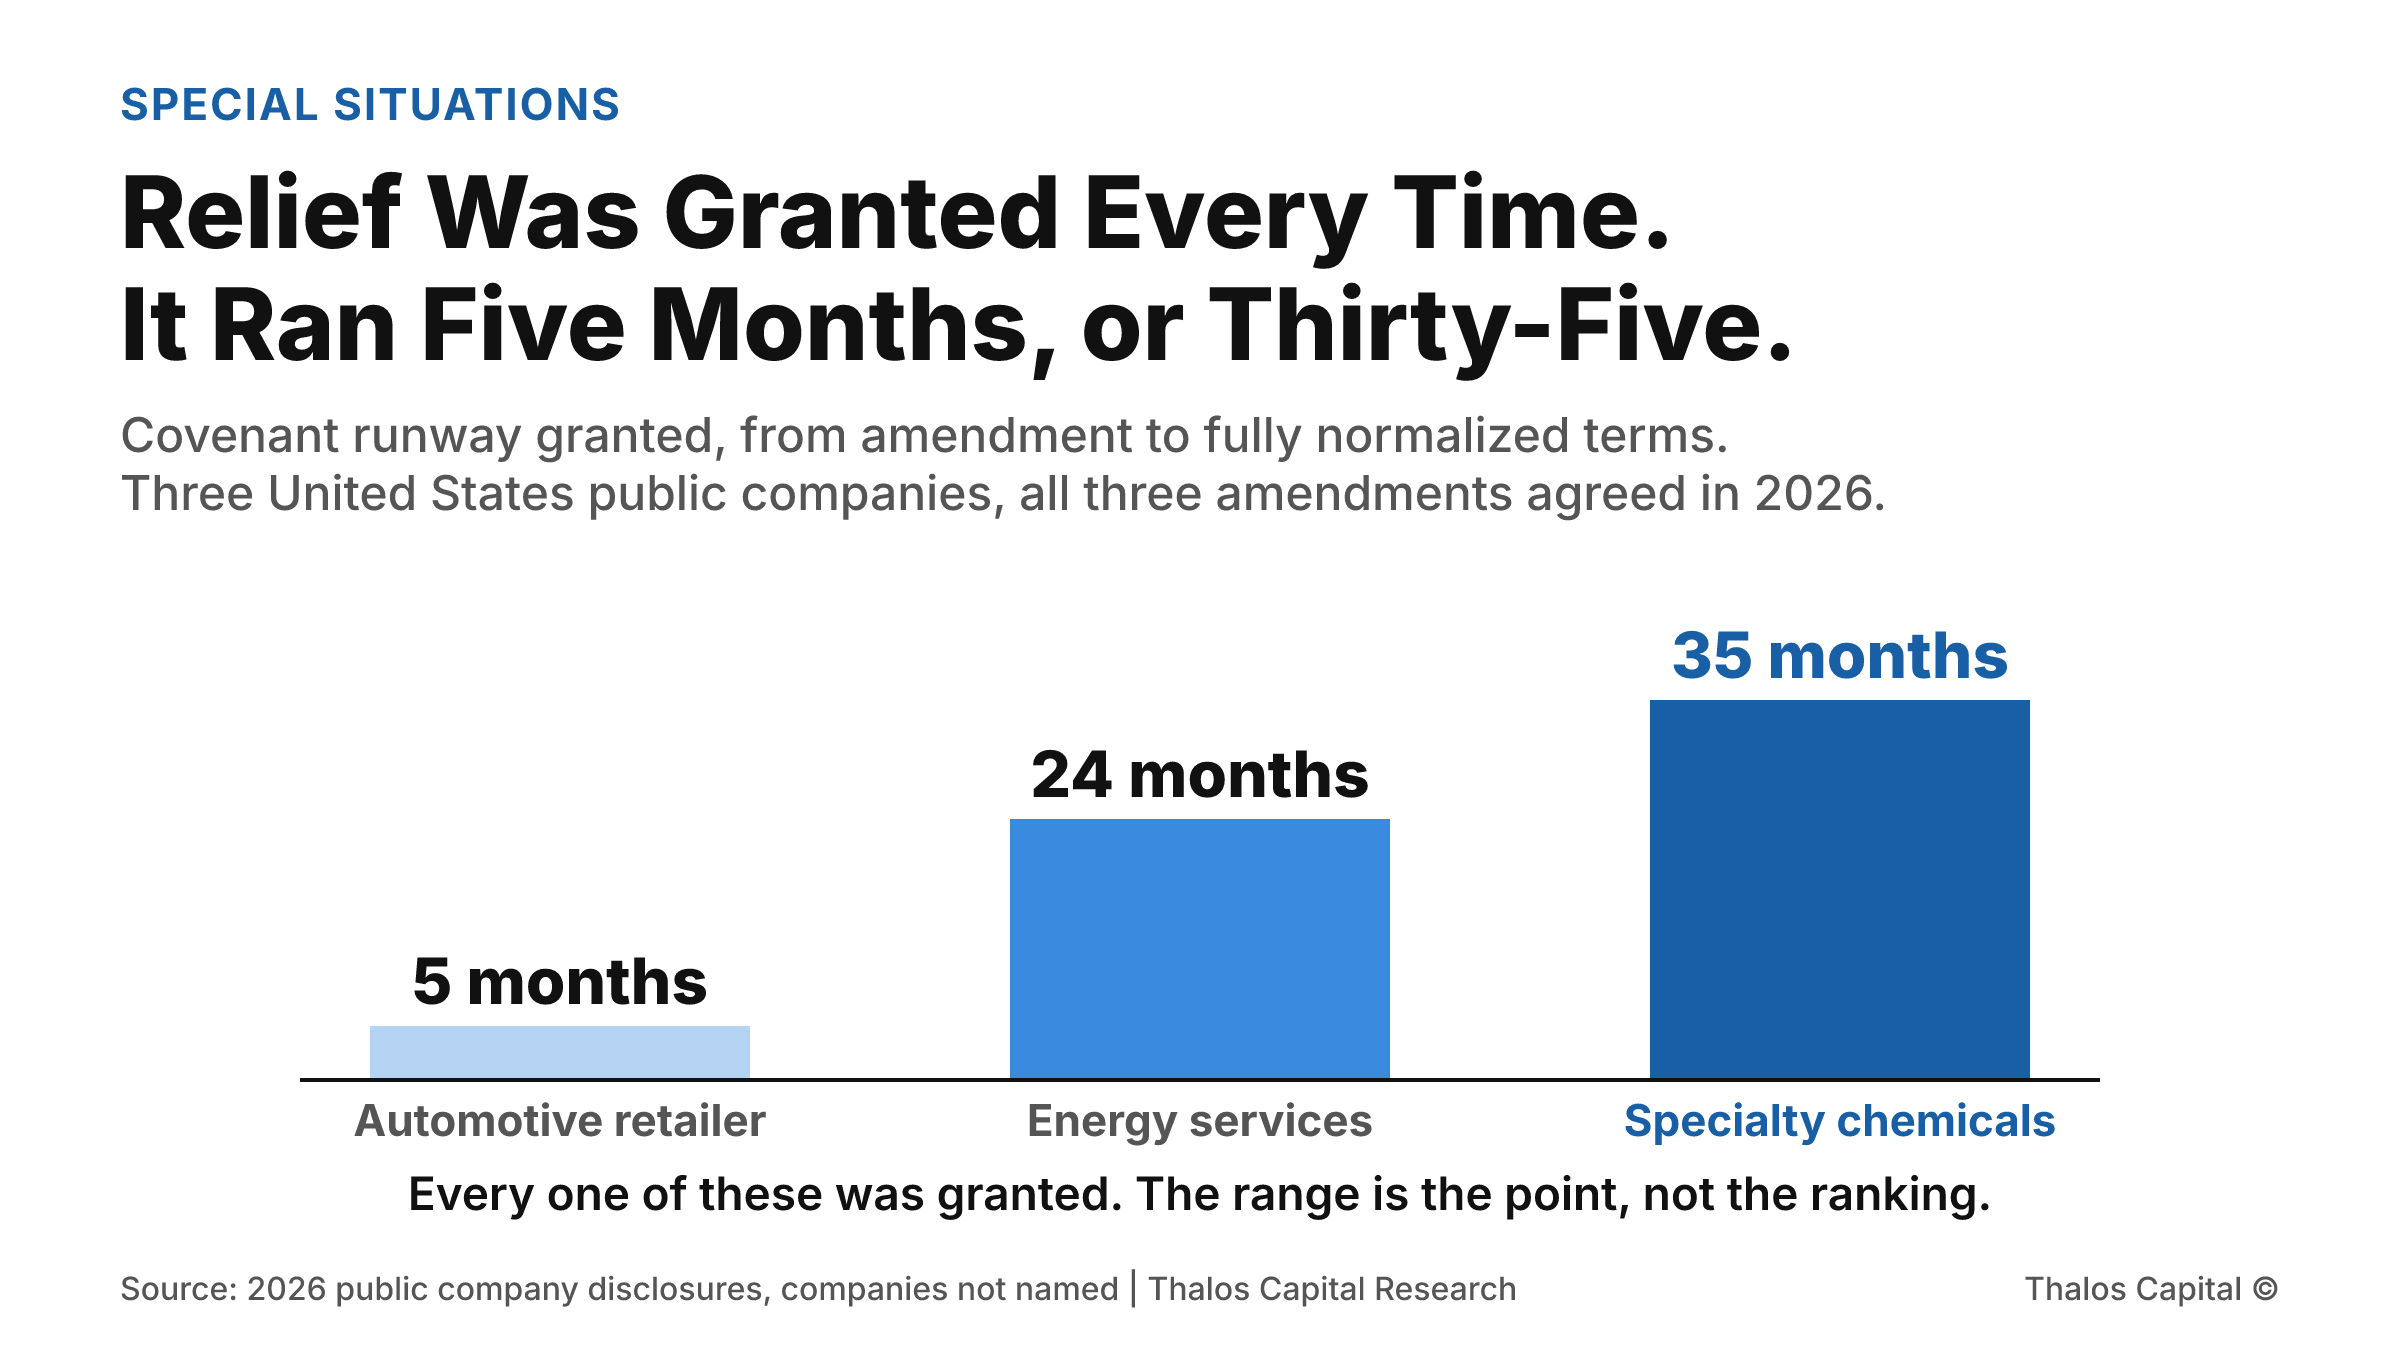
Three columns comparing covenant runway granted in 2026 amendments by three United States public companies: about five months for an automotive retailer, twenty-four months for an energy services company, and thirty-five months for a specialty chemicals company.

Relief Was Granted Every Time. It Ran Five Months, or Thirty-Five.

Three United States public companies disclosed covenant amendments in 2026. Every creditor group said yes. One got a conditional bridge of a few months, another two years, a third nearly three. The breach severity is not what separated them.
Read More
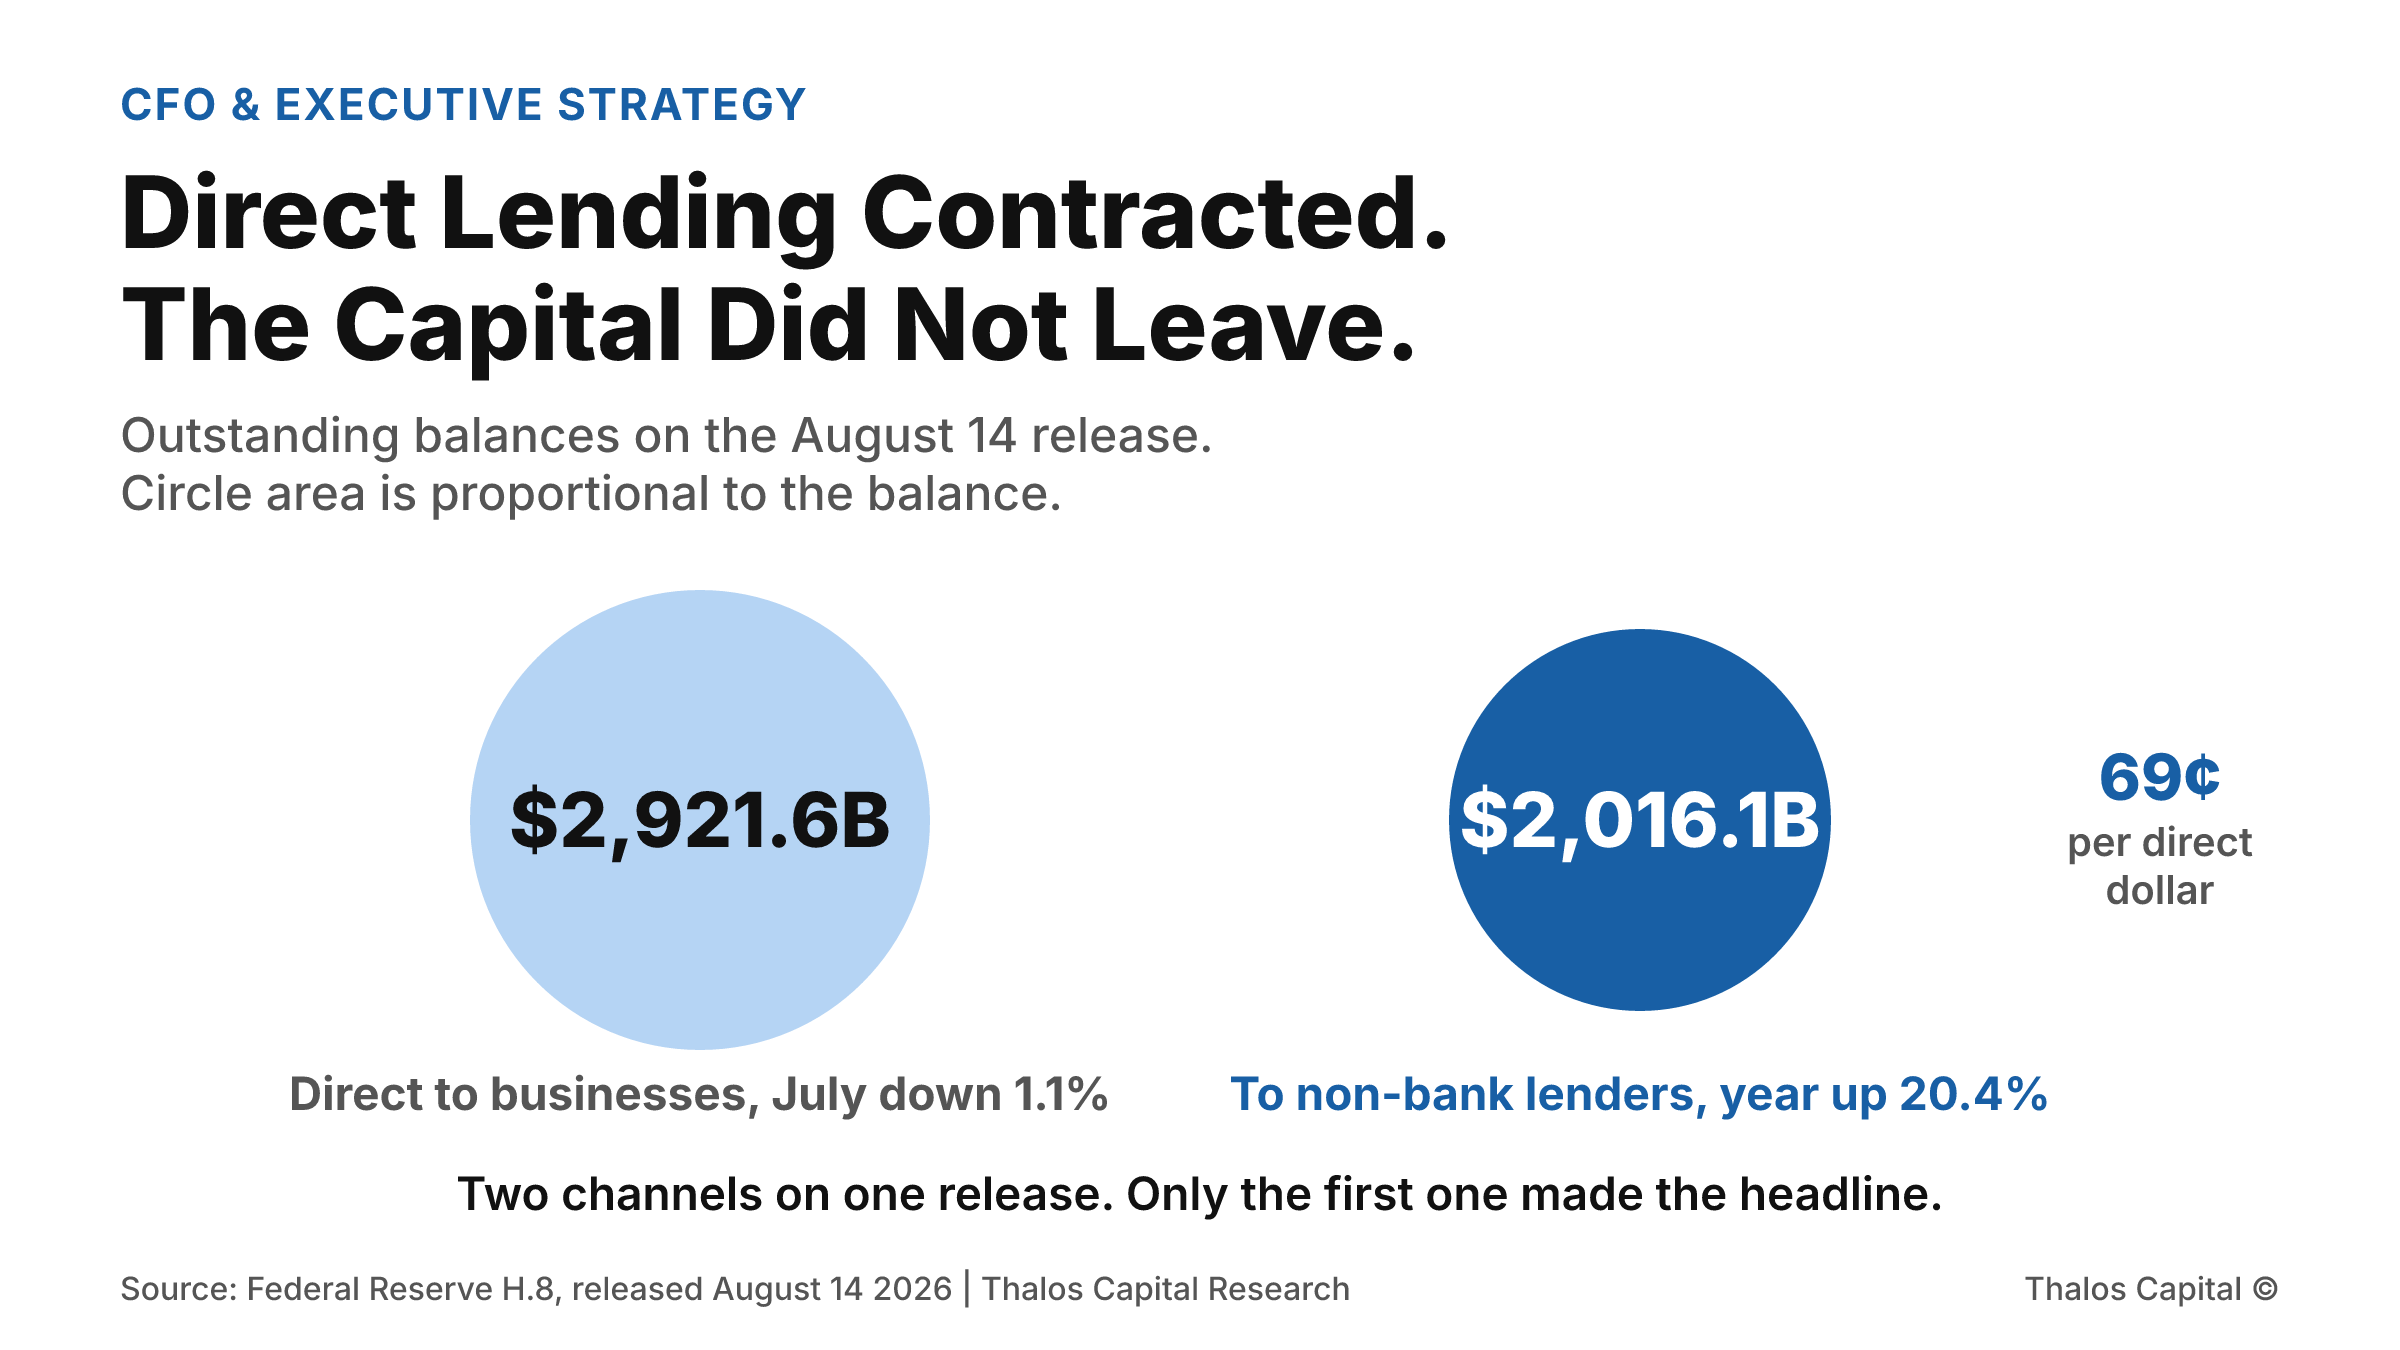
Two proportional circles comparing commercial and industrial loan balances of $2,921.6 billion, which contracted 1.1 percent annualized in July, against lending to non-depository financial institutions of $2,016.1 billion, up 20.4 percent on the year.

Direct Lending Contracted. The Capital Did Not Leave.

July brought the first contraction in commercial and industrial balances all year, at minus 1.1 percent annualized. Over the same stretch, lending to non-bank financial institutions reached $2,016.1 billion, up 20.4 percent.
Read More
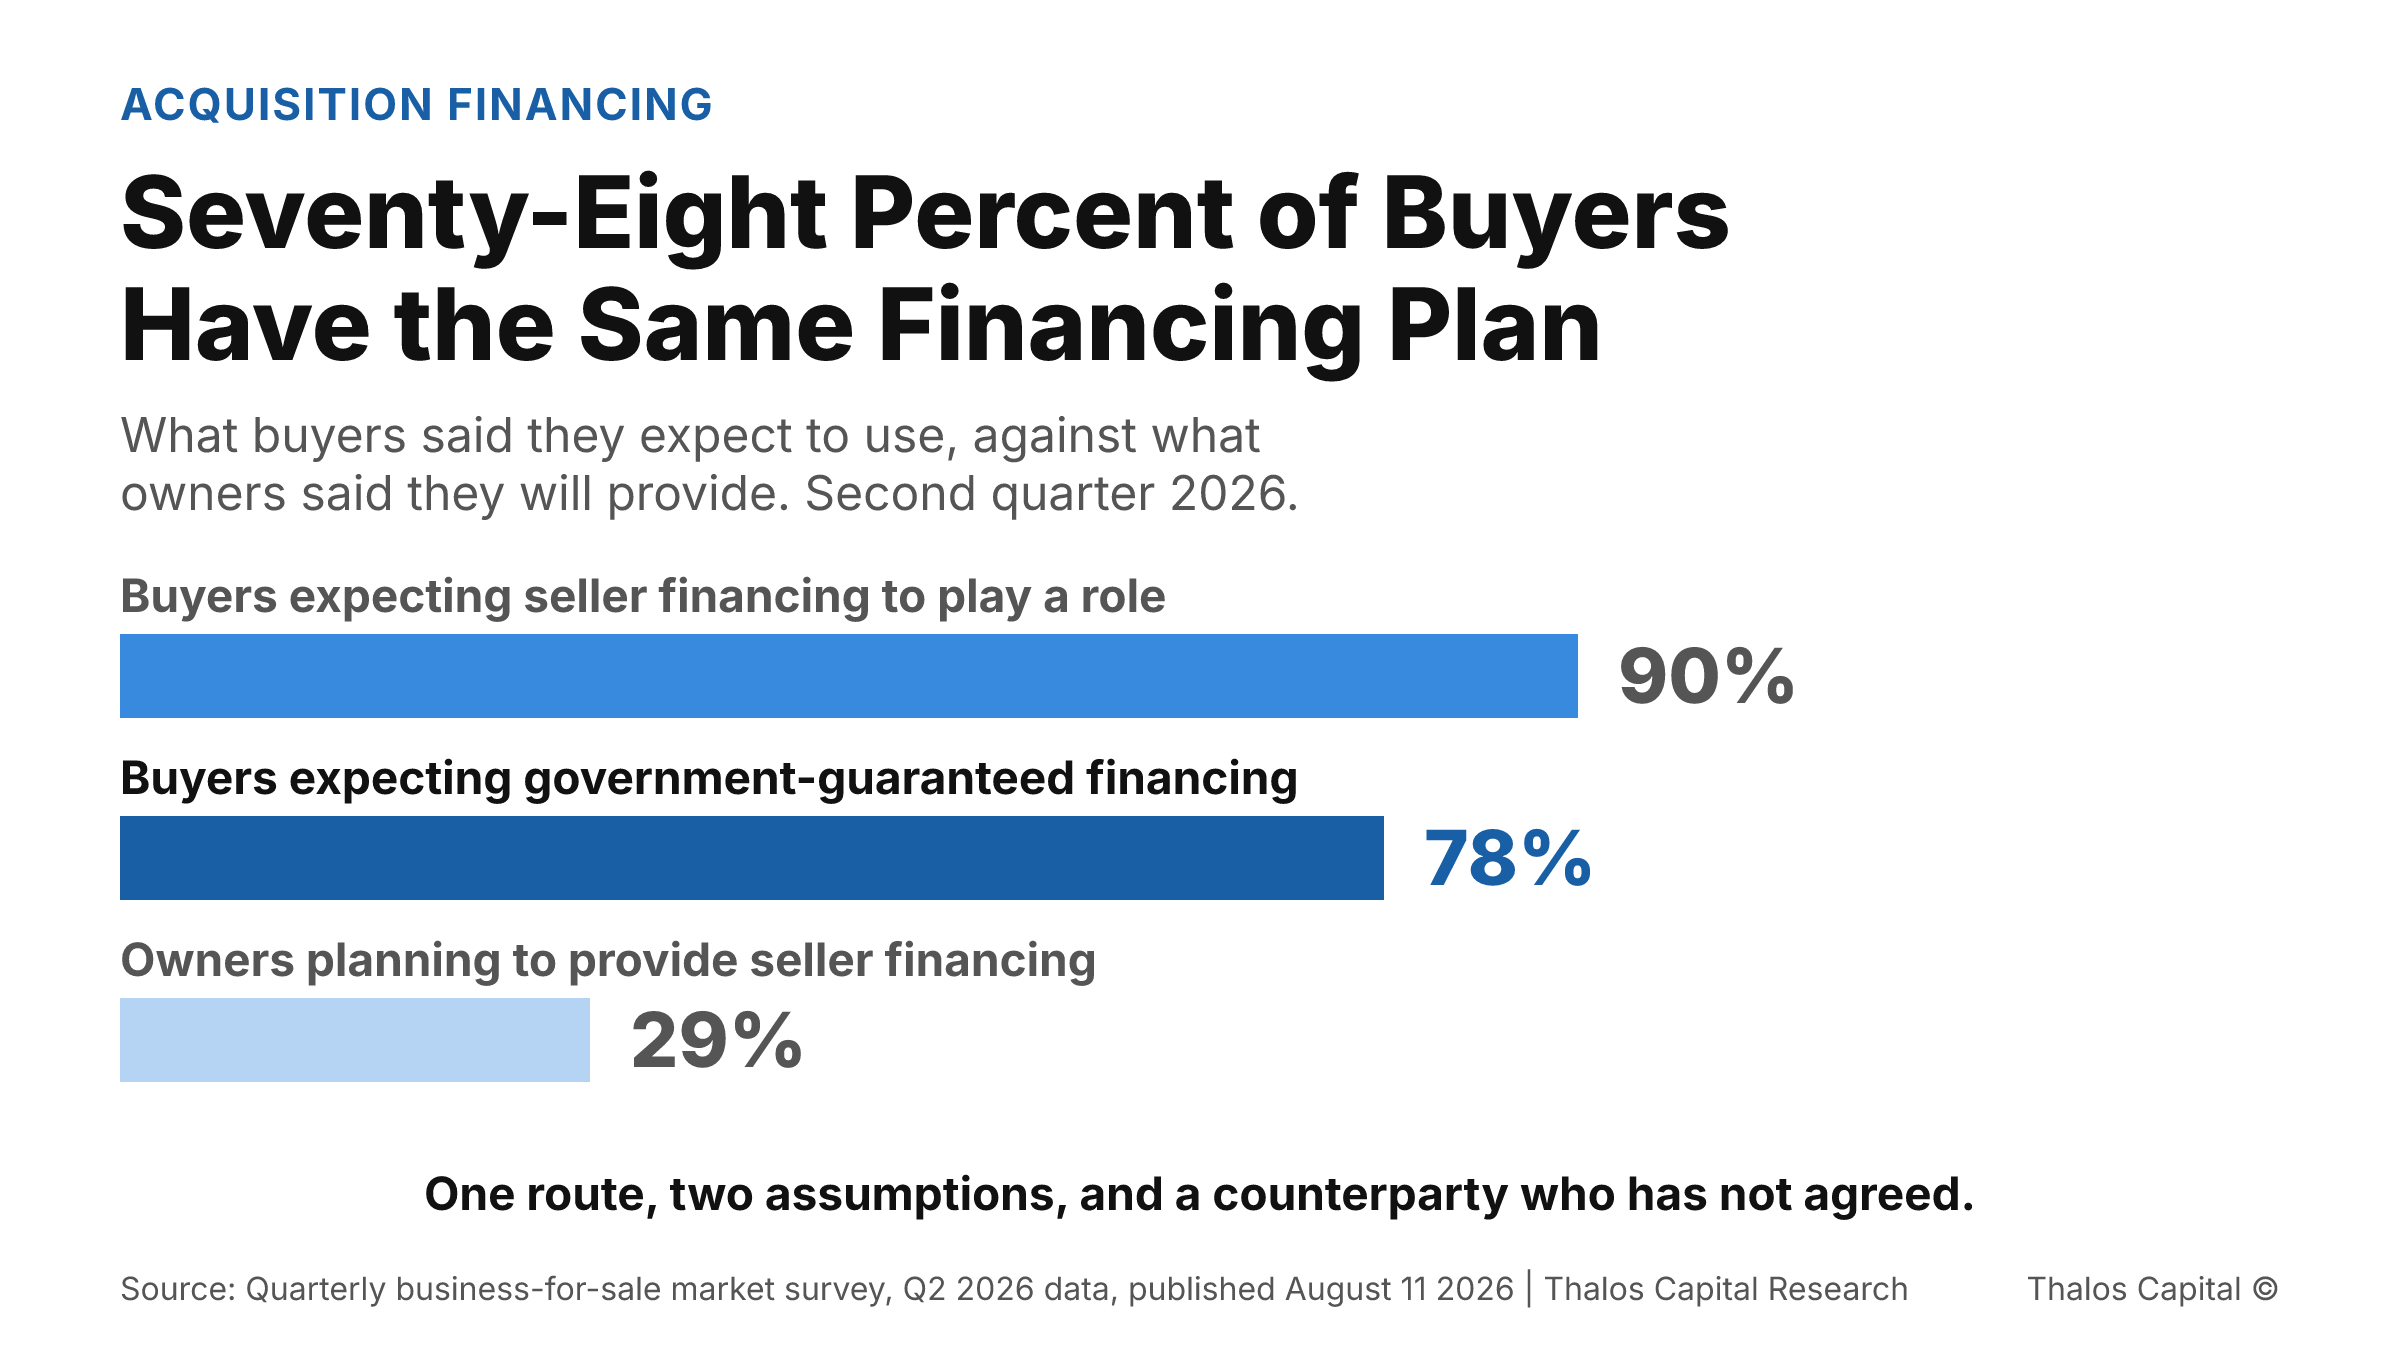
Horizontal bar chart of three survey figures from the second quarter of 2026. Ninety percent of buyers expect seller financing to play a role, seventy-eight percent expect financing backed by the U.S. Small Business Administration, shown in the darkest navy as the value argued, and twenty-nine percent of owners plan to provide seller financing.

Seventy-Eight Percent of Buyers Have the Same Financing Plan

Nearly eight in ten buyers expect to fund an acquisition through one government-guaranteed program, and ninety percent expect a seller note that only twenty-nine percent of owners plan to write.
Read More
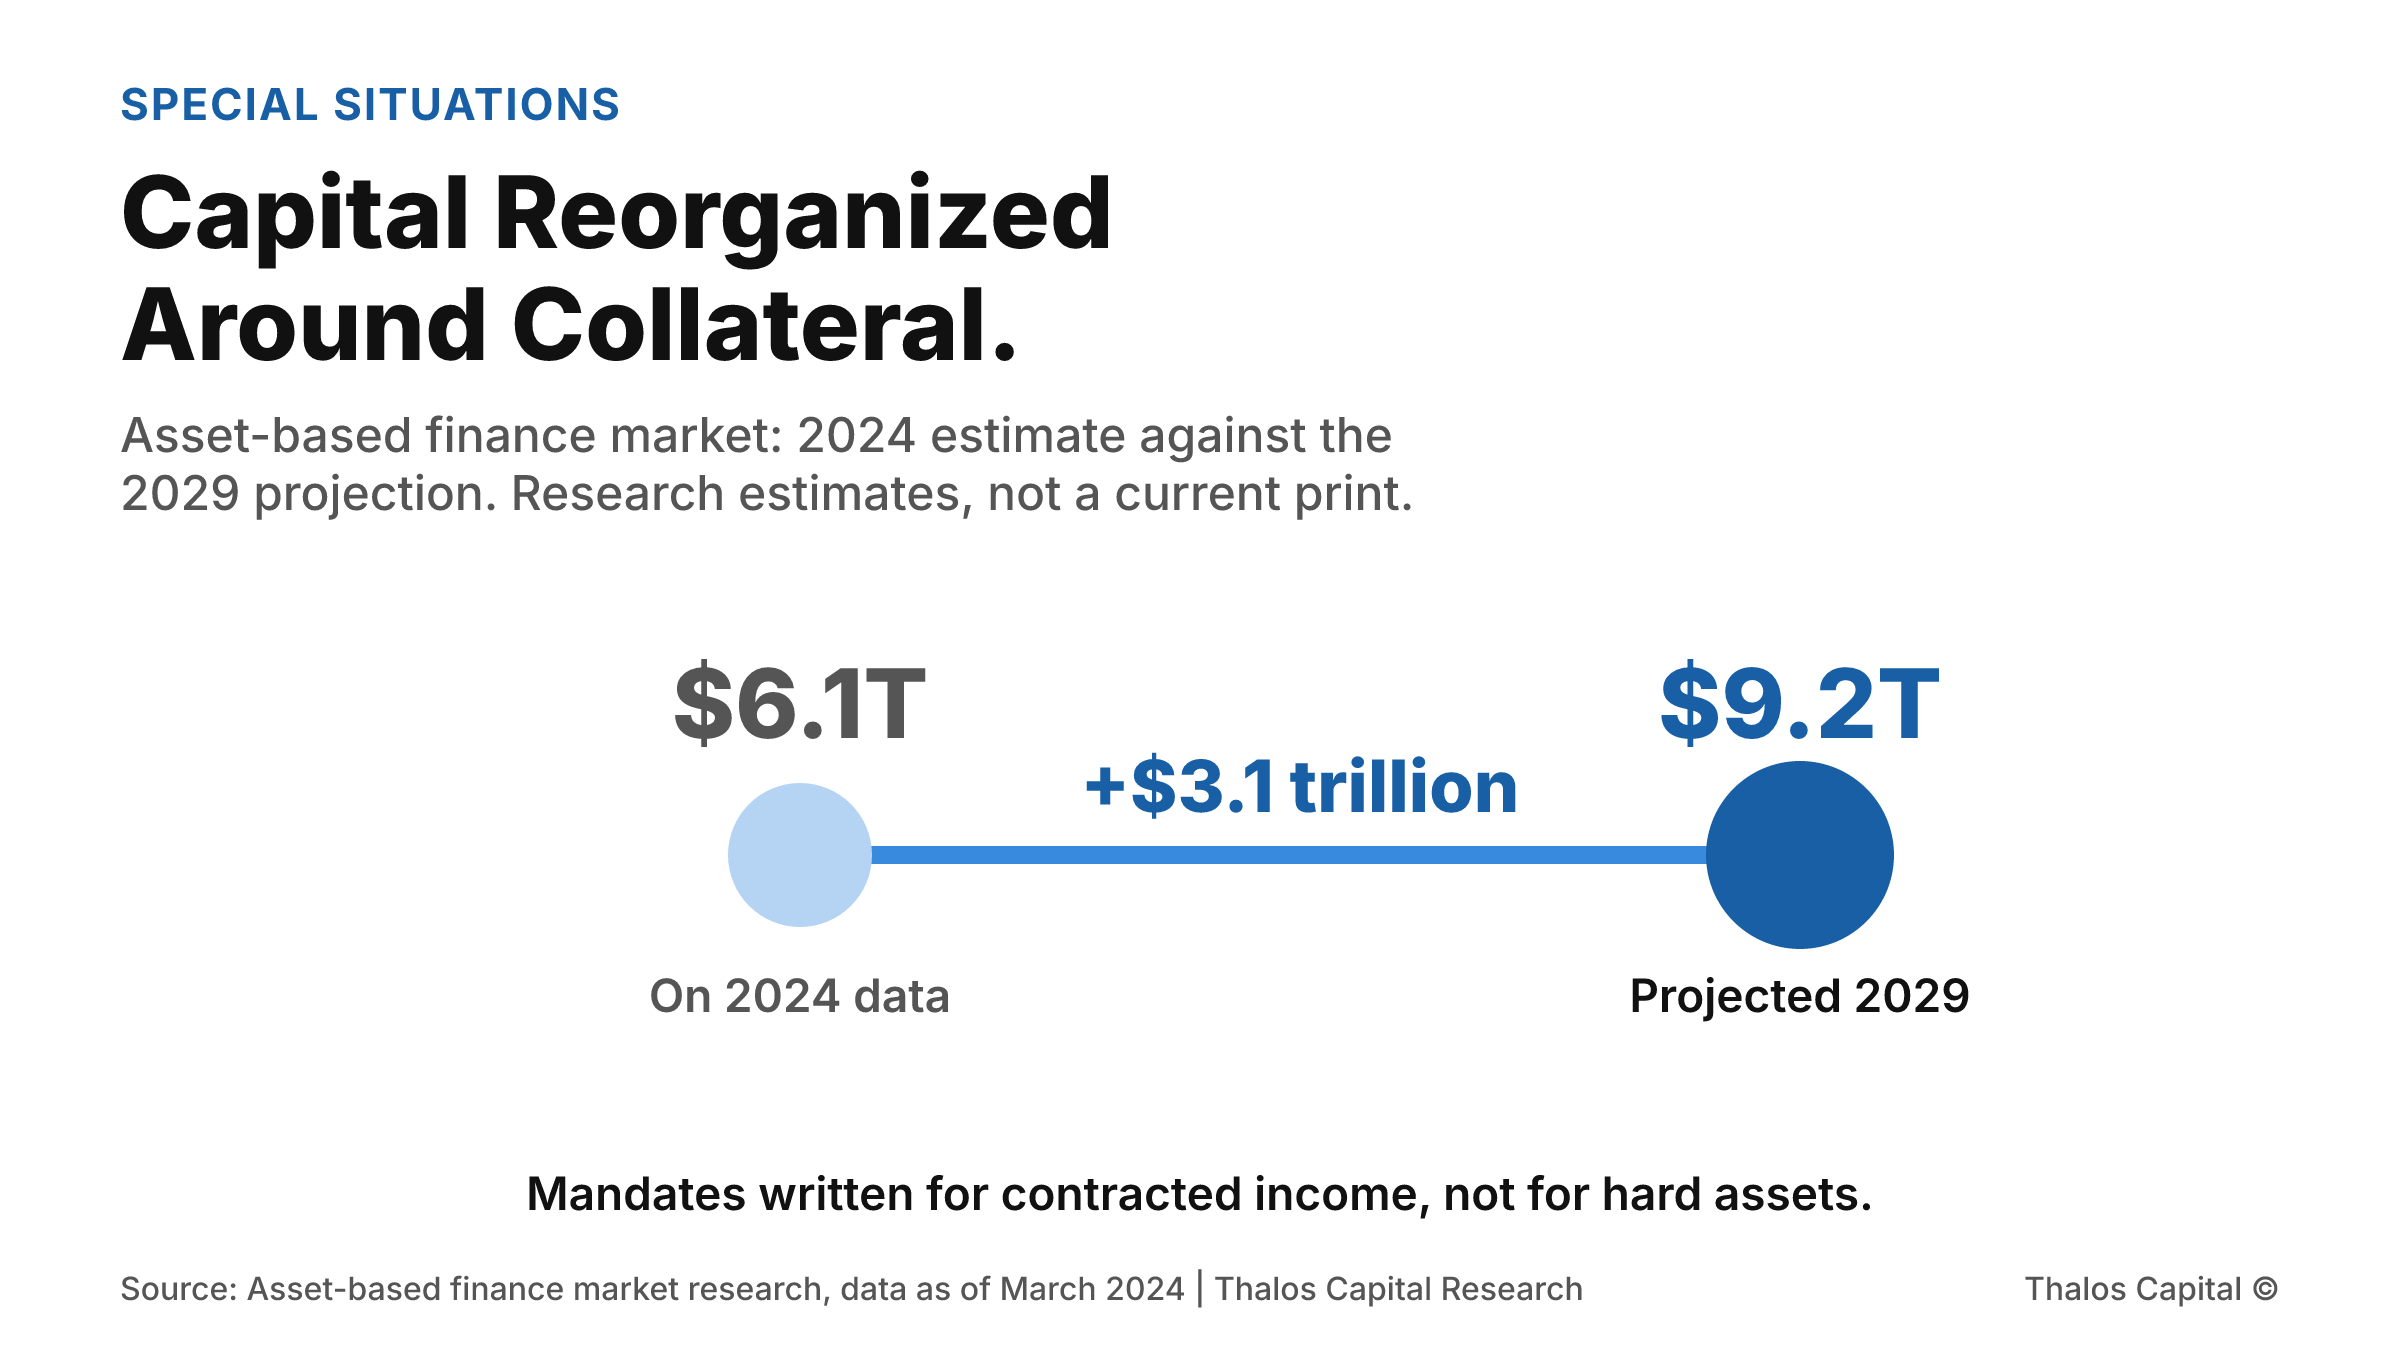
Two point range chart showing the asset-based finance market estimated at more than $6.1 trillion on 2024 data and projected to reach $9.2 trillion by 2029, an increase of roughly $3.1 trillion.

Capital Reorganized Around Collateral. Your Contracts Are Collateral.

Asset-based finance was estimated at more than $6.1 trillion on 2024 data and projected to reach $9.2 trillion by 2029. Inside it are mandates written for contracted and intangible cash flows rather than for hard assets.
Read More
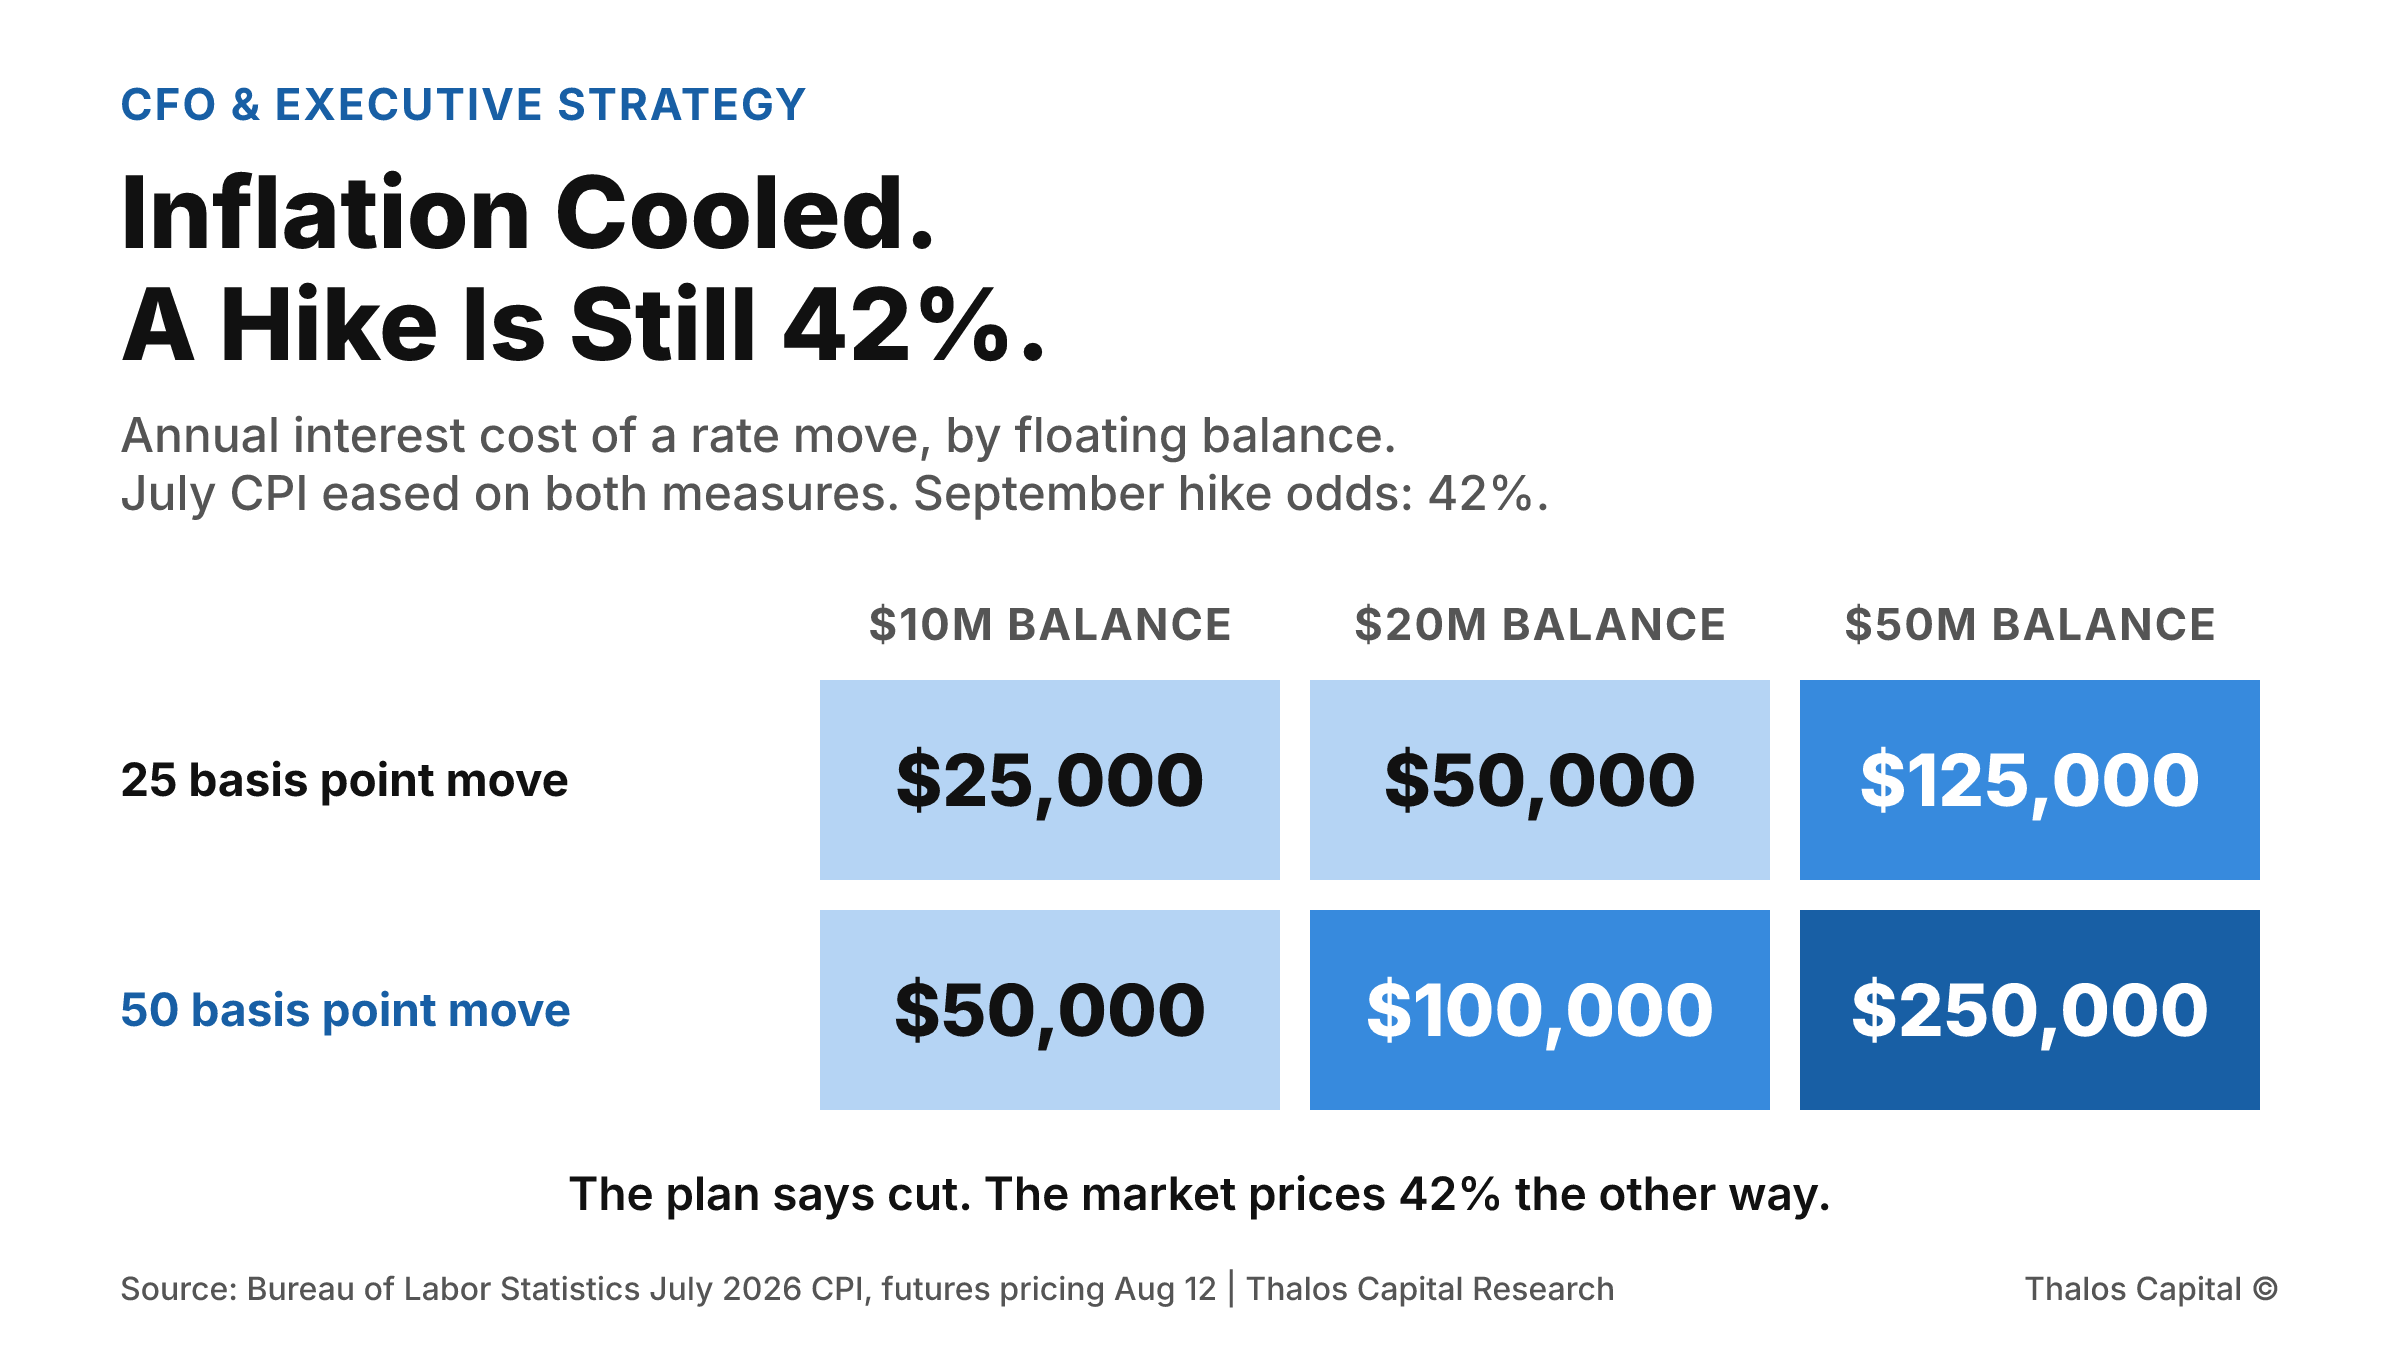
Shaded grid of the annual interest cost of a rate move across three floating balances: a 25 basis point move costs $25,000 on $10 million, $50,000 on $20 million and $125,000 on $50 million, and a 50 basis point move costs $50,000, $100,000 and $250,000 respectively.

Inflation Cooled. A Hike Is Still a 42 Percent Bet.

July CPI came in exactly as forecast, both measures eased, and Treasury yields fell across the board. Futures still priced a 42 percent chance of a September hike. What that asymmetry is worth on a floating balance.
Read More
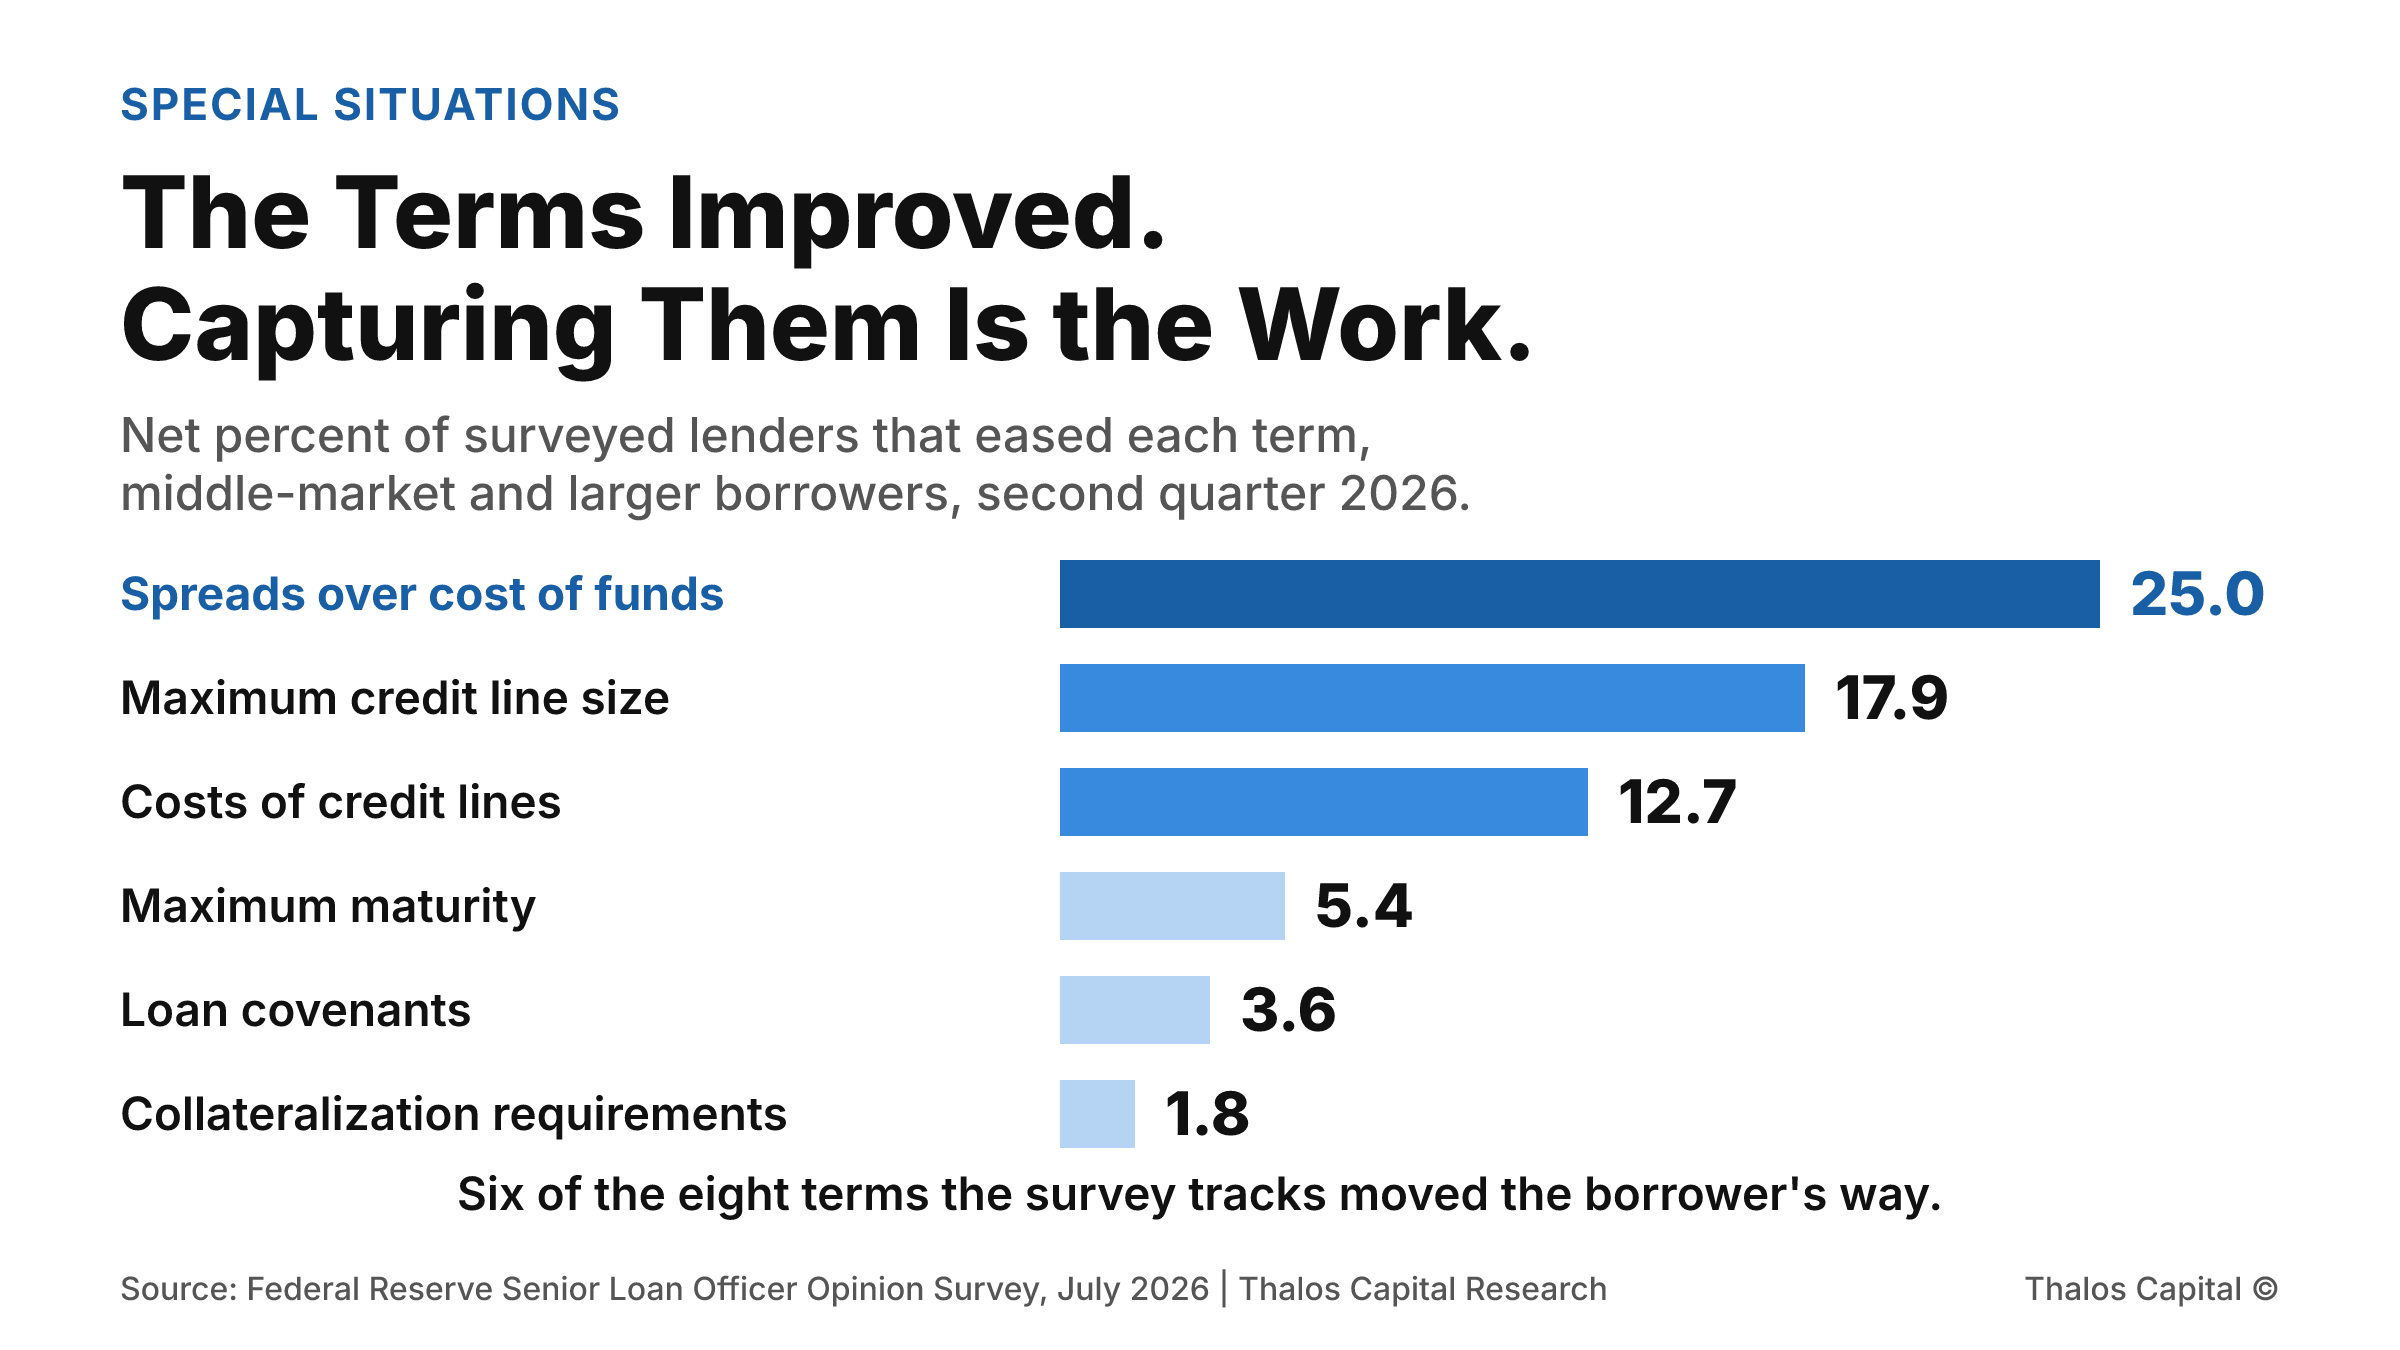
Ordered horizontal bars showing the net percent of surveyed lenders that eased each commercial and industrial loan term in the second quarter of 2026, led by spreads over cost of funds at 25.0 percent, then credit line size at 17.9, cost of credit lines at 12.7, maturity at 5.4, covenants at 3.6, and collateralization at 1.8.

The Terms Improved. Capturing Them Is the Work.

A net 25 percent of surveyed lenders narrowed spreads on middle-market loans last quarter, and six of eight tracked terms moved the borrower's way. Complex, regulated, and non-sponsor situations capture that only if the file fits the mandate.
Read More
Working through a financing decision?
Insights are a starting point. A conversation maps your actual options.
Tell us what you are financing and we will map the structures and sources that fit.
Submit your financing request →
Explore our financing solutions
Equipment FinancingWorking CapitalAsset-Based LendingStrategic Debt