Category

Financing Strategy

17 insights · page 1 of 3

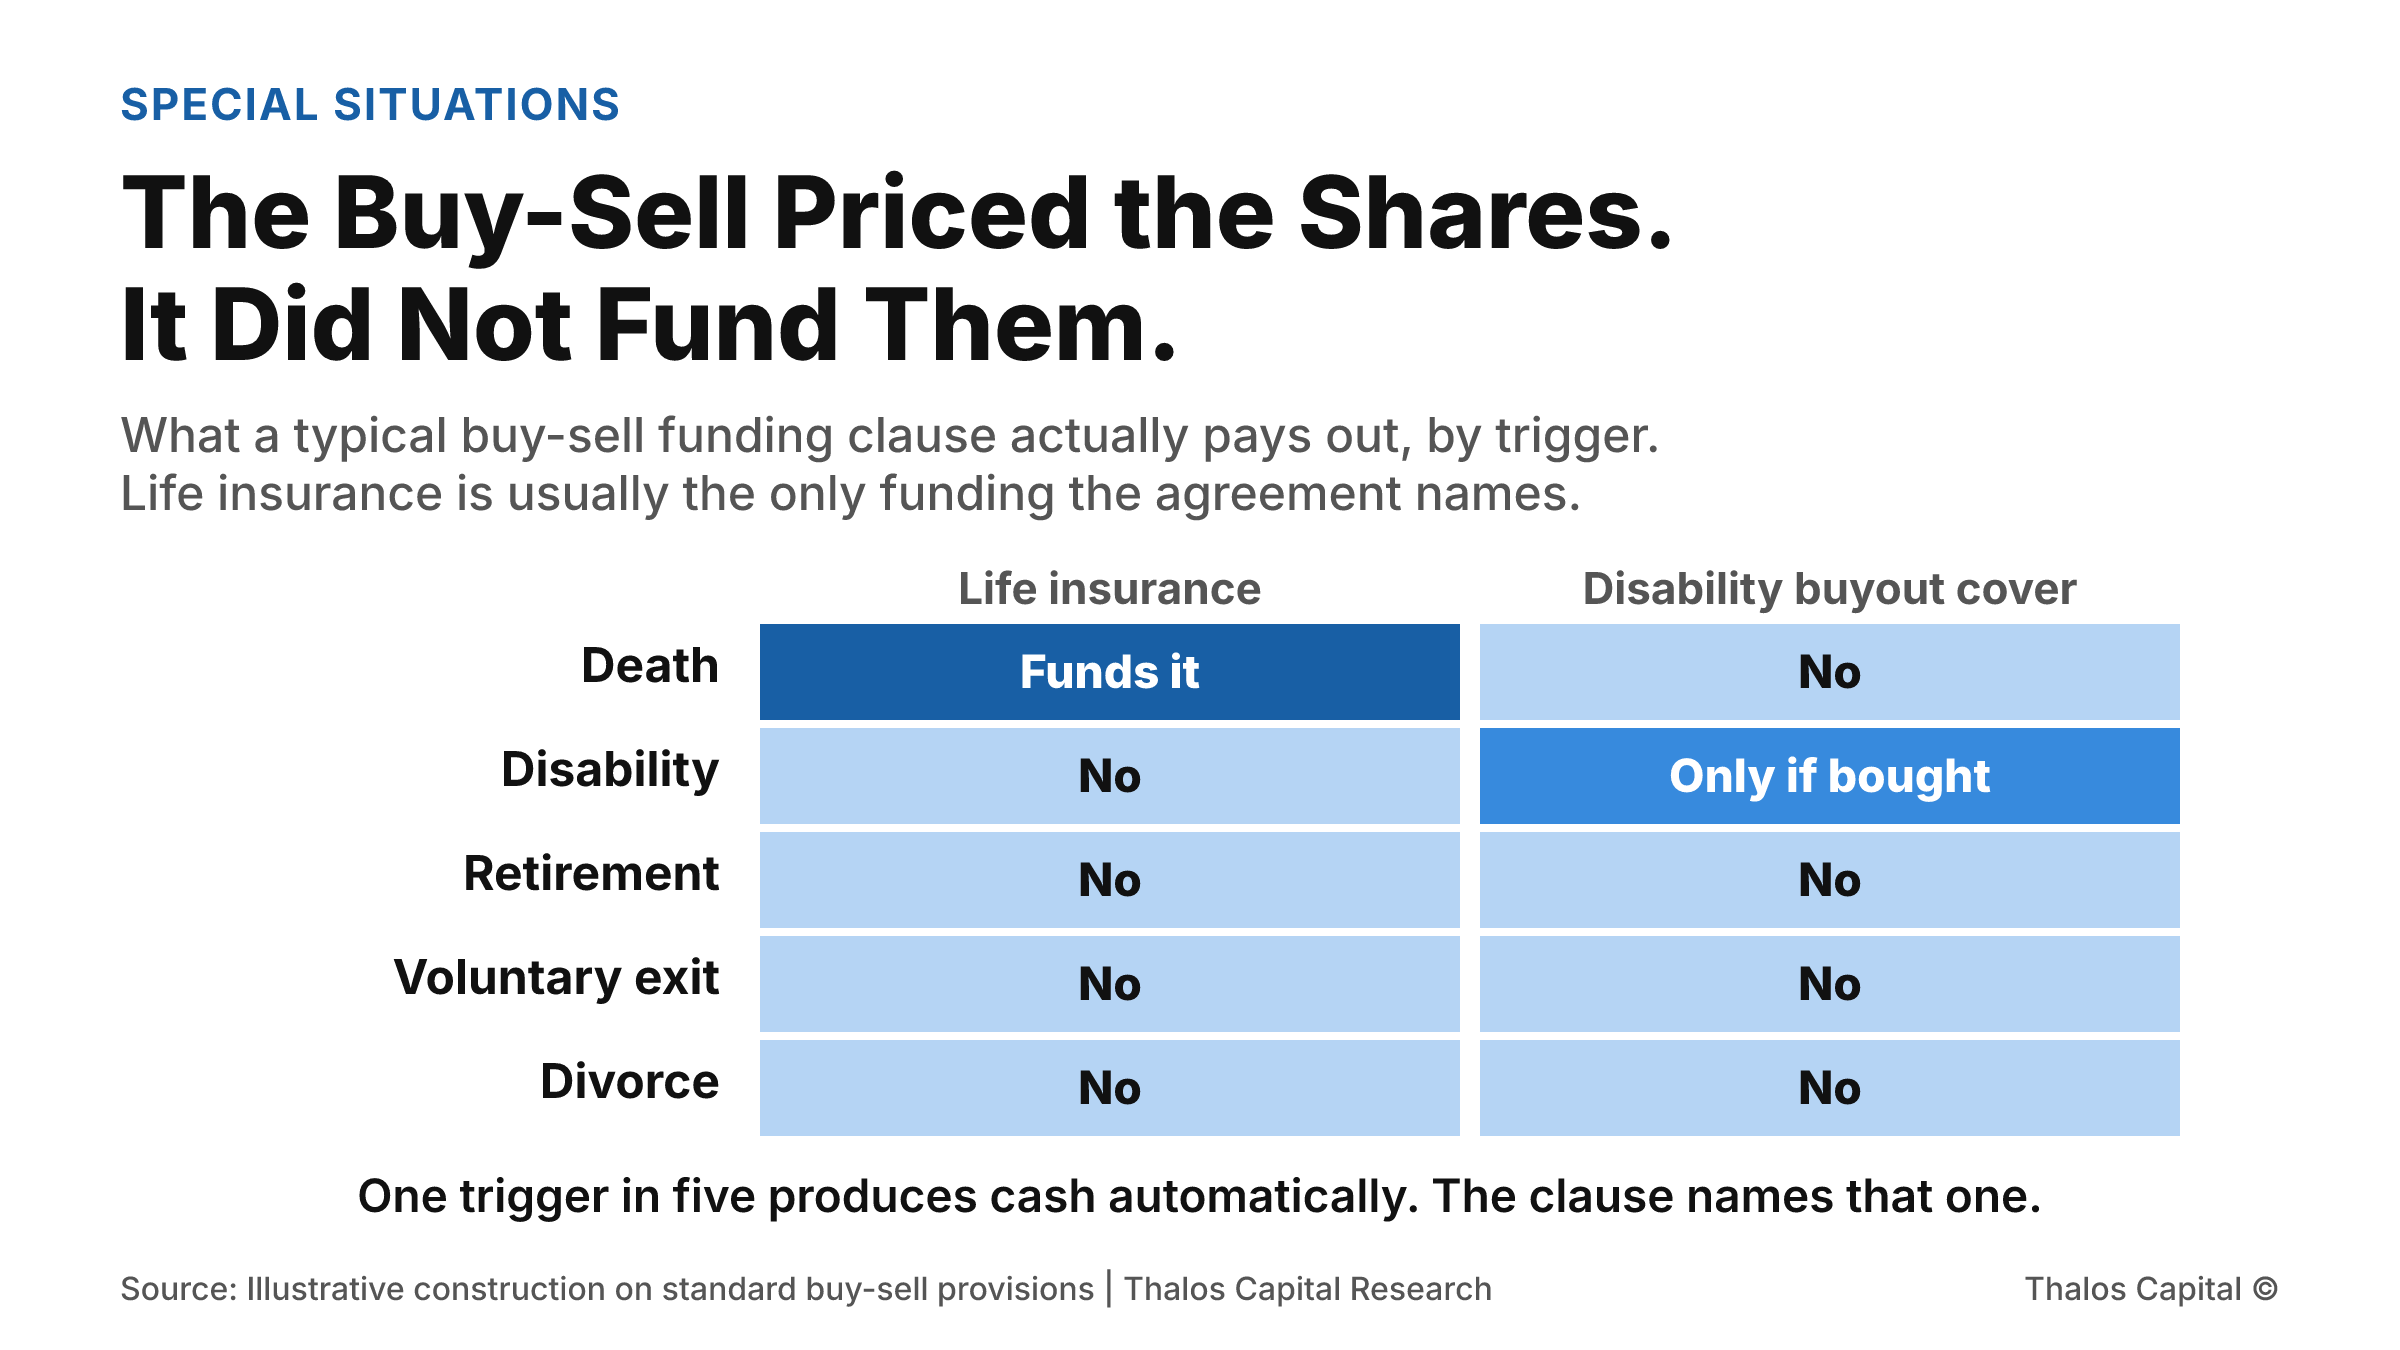
A grid of five buy-sell triggers against two insurance funding sources, showing that life insurance produces cash only on death, disability buyout cover only on disability and only if it was bought, and that retirement, voluntary exit and divorce produce no automatic funding at all.

The Buy-Sell Priced the Shares. It Did Not Fund Them.

A buy-sell agreement settles who can trigger a sale and exactly what the shares are worth. It usually settles funding in one sentence naming life insurance, which pays on only one of the five events that can fire it.
Read More
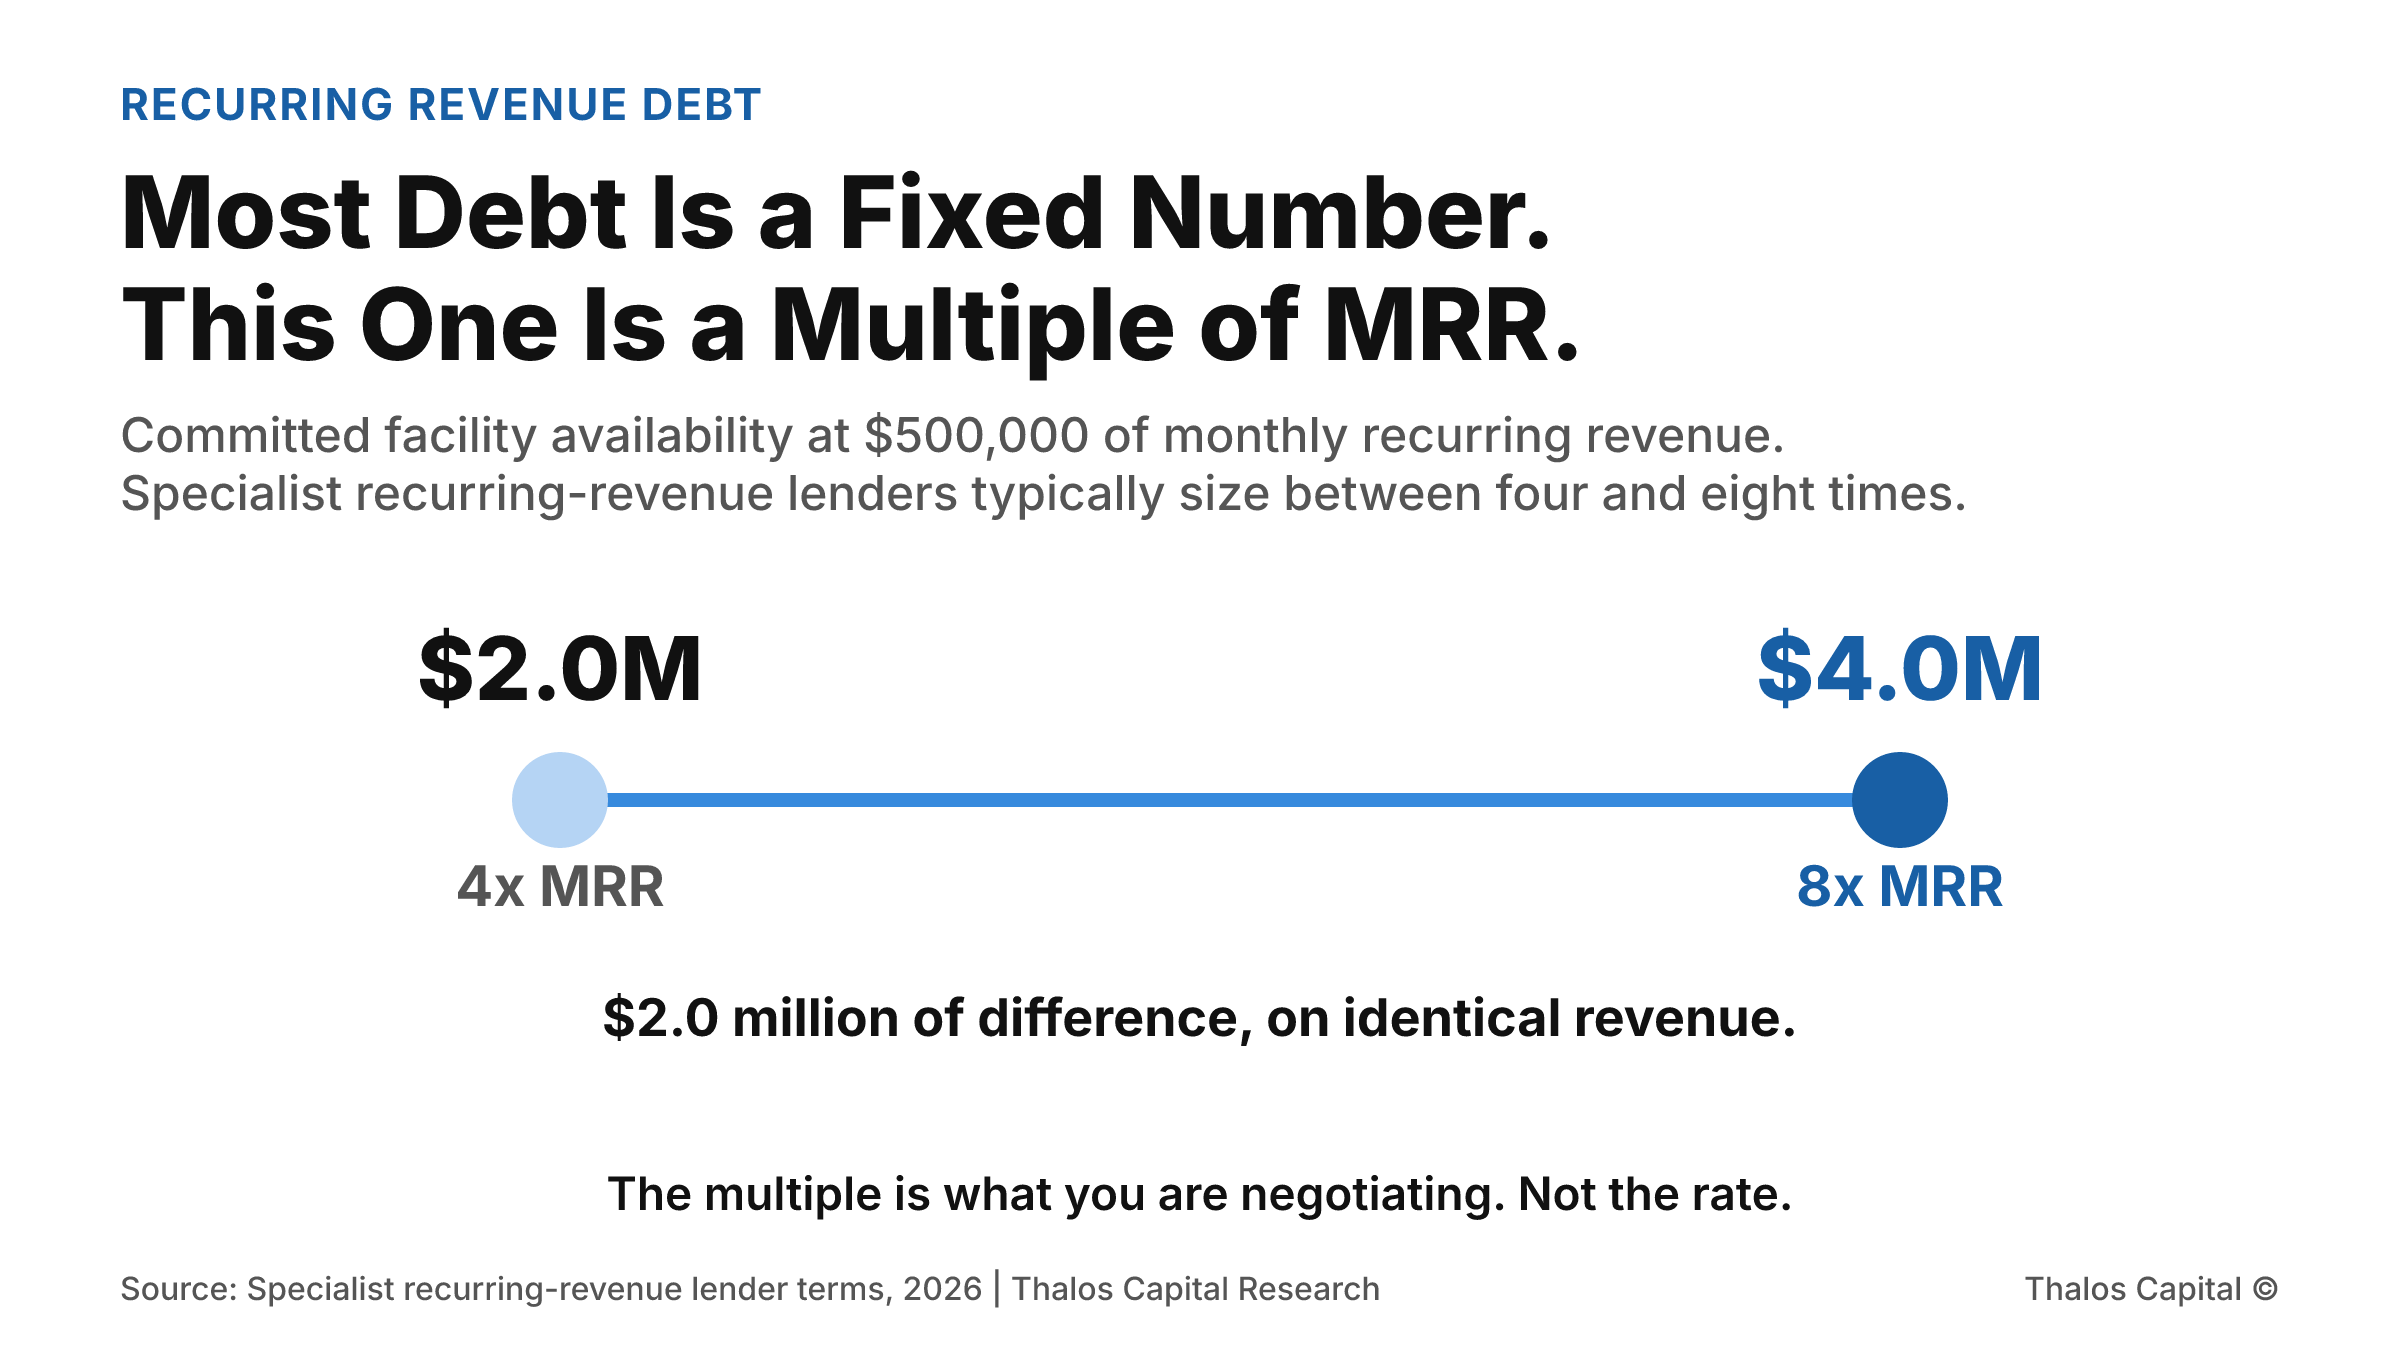
A two-point range showing that a company at $500,000 of monthly recurring revenue can access $2.0 million at a four times multiple or $4.0 million at eight times, a $2.0 million spread on identical revenue.

Most Debt Is a Fixed Number. This One Is a Multiple of MRR.

A term loan is sized once and never changes. A committed facility against recurring revenue is sized as a multiple of monthly revenue, and availability rises as that revenue rises, without a second underwriting.
Read More
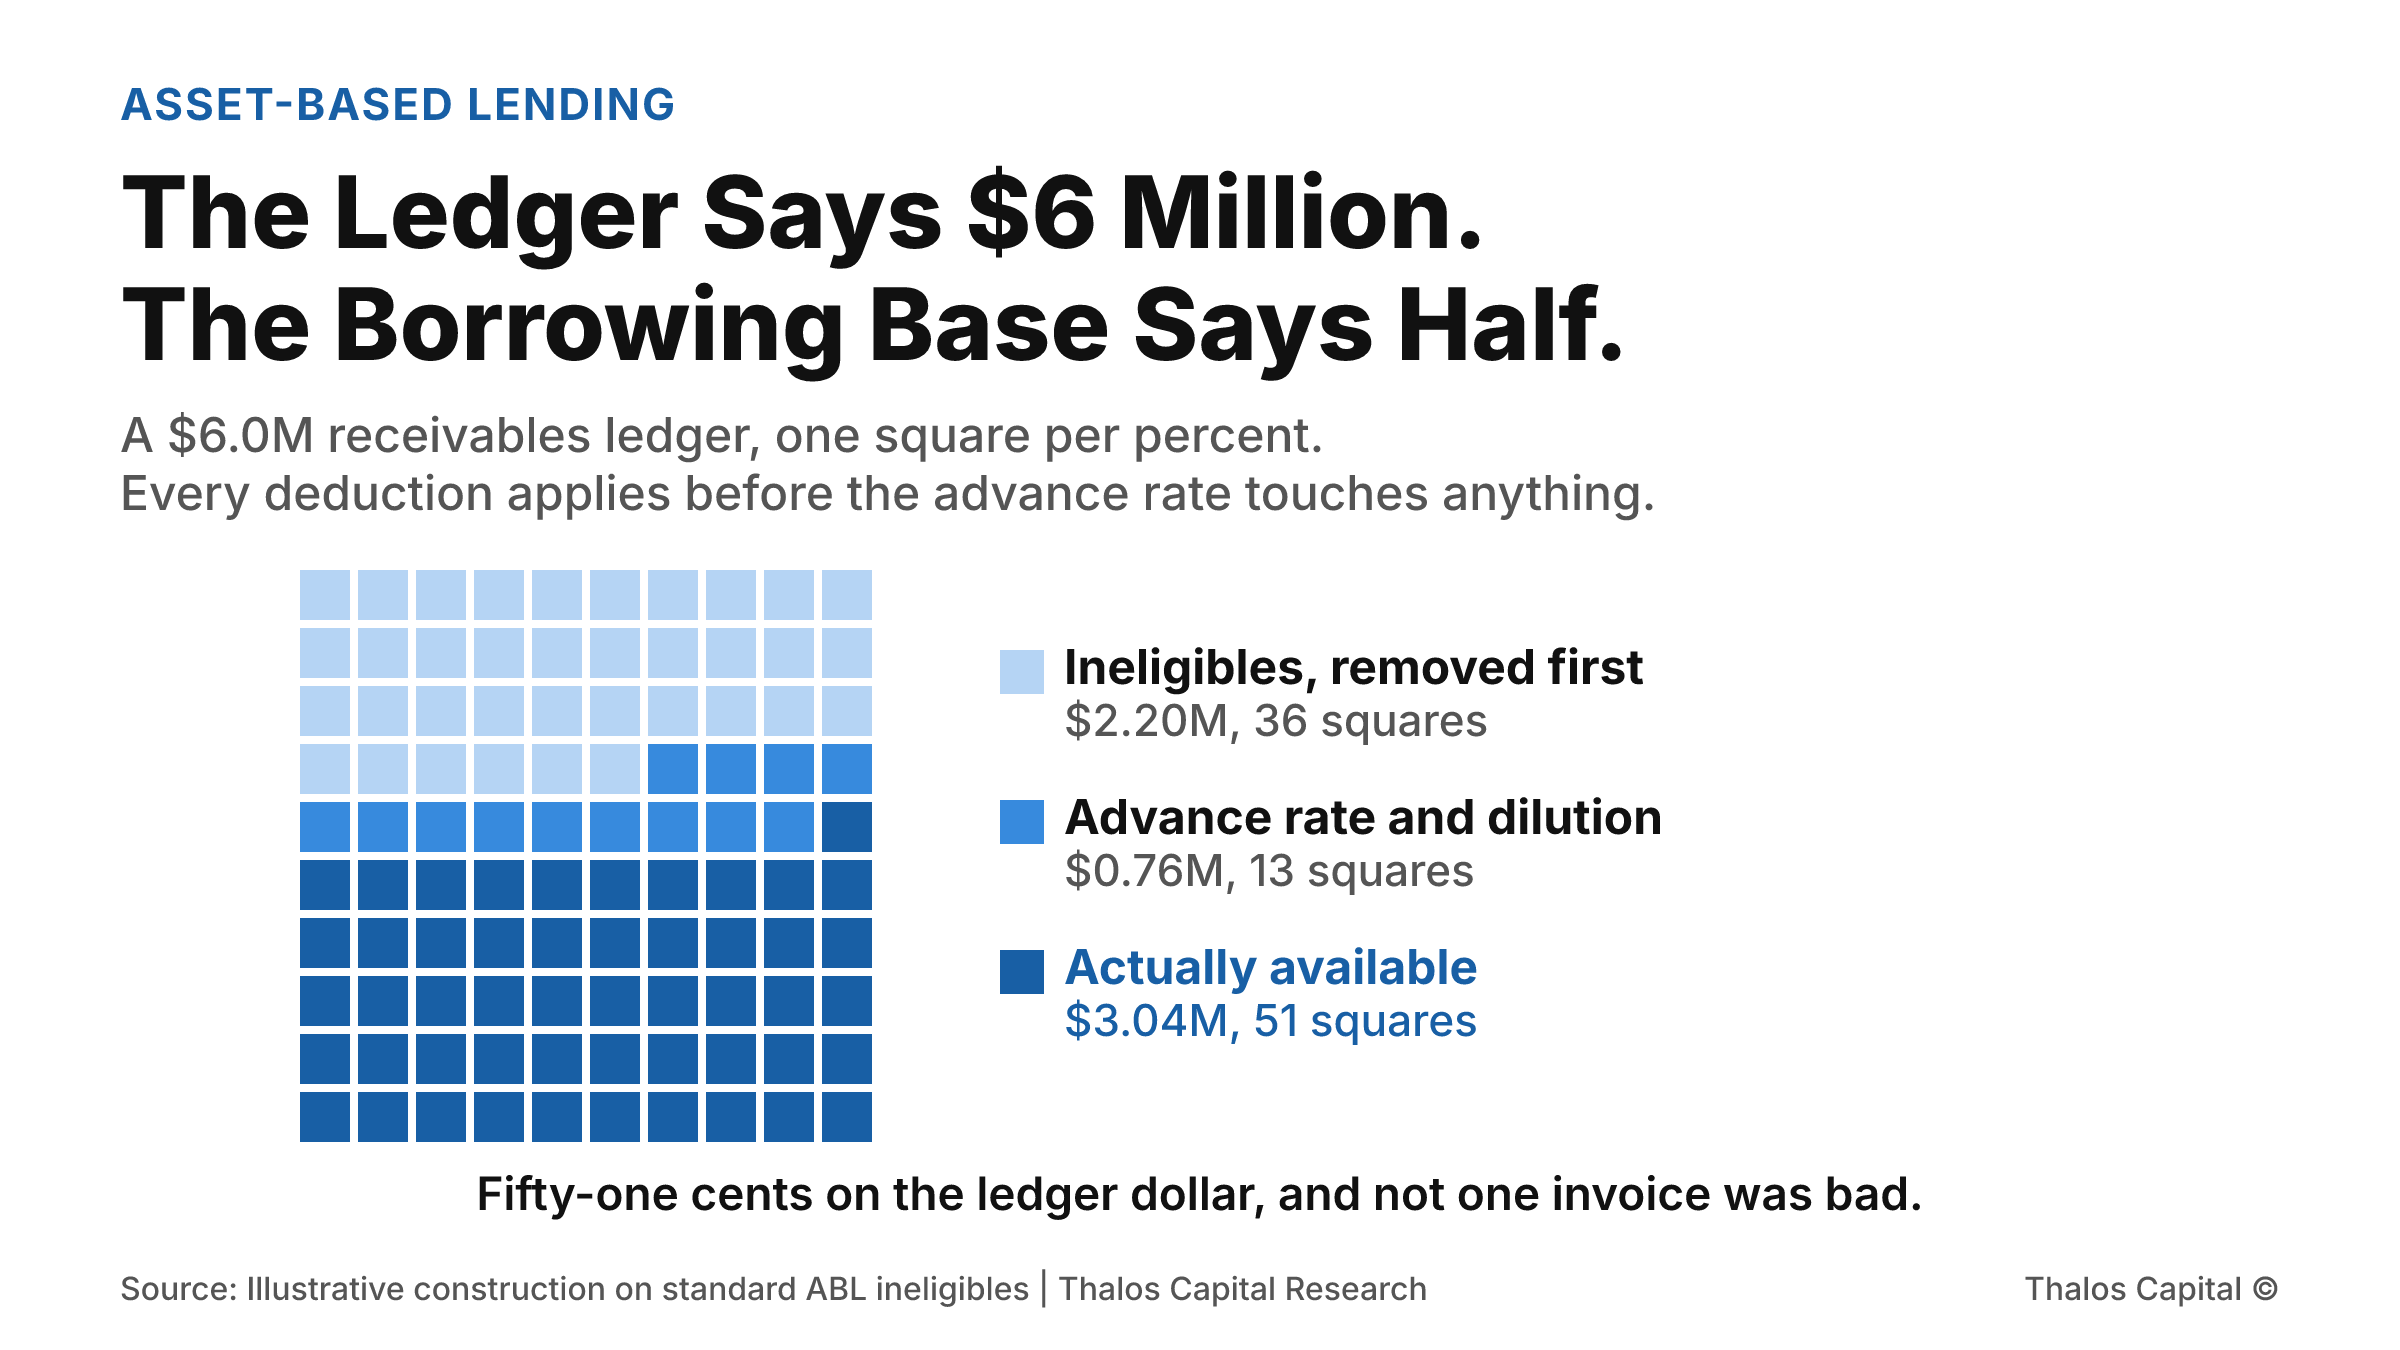
A hundred-square waffle of a $6 million receivables ledger showing 36 squares removed as ineligibles, 13 squares taken by the advance rate and dilution reserve, and 51 squares of actual availability at $3.04 million.

The Ledger Says $6 Million. The Borrowing Base Says Half.

Advance rate is the number every borrower asks about and the last one applied. Before it touches anything, the ineligibles come out, and on a $6 million receivables ledger they can remove $2.2 million without a single invoice being bad.
Read More
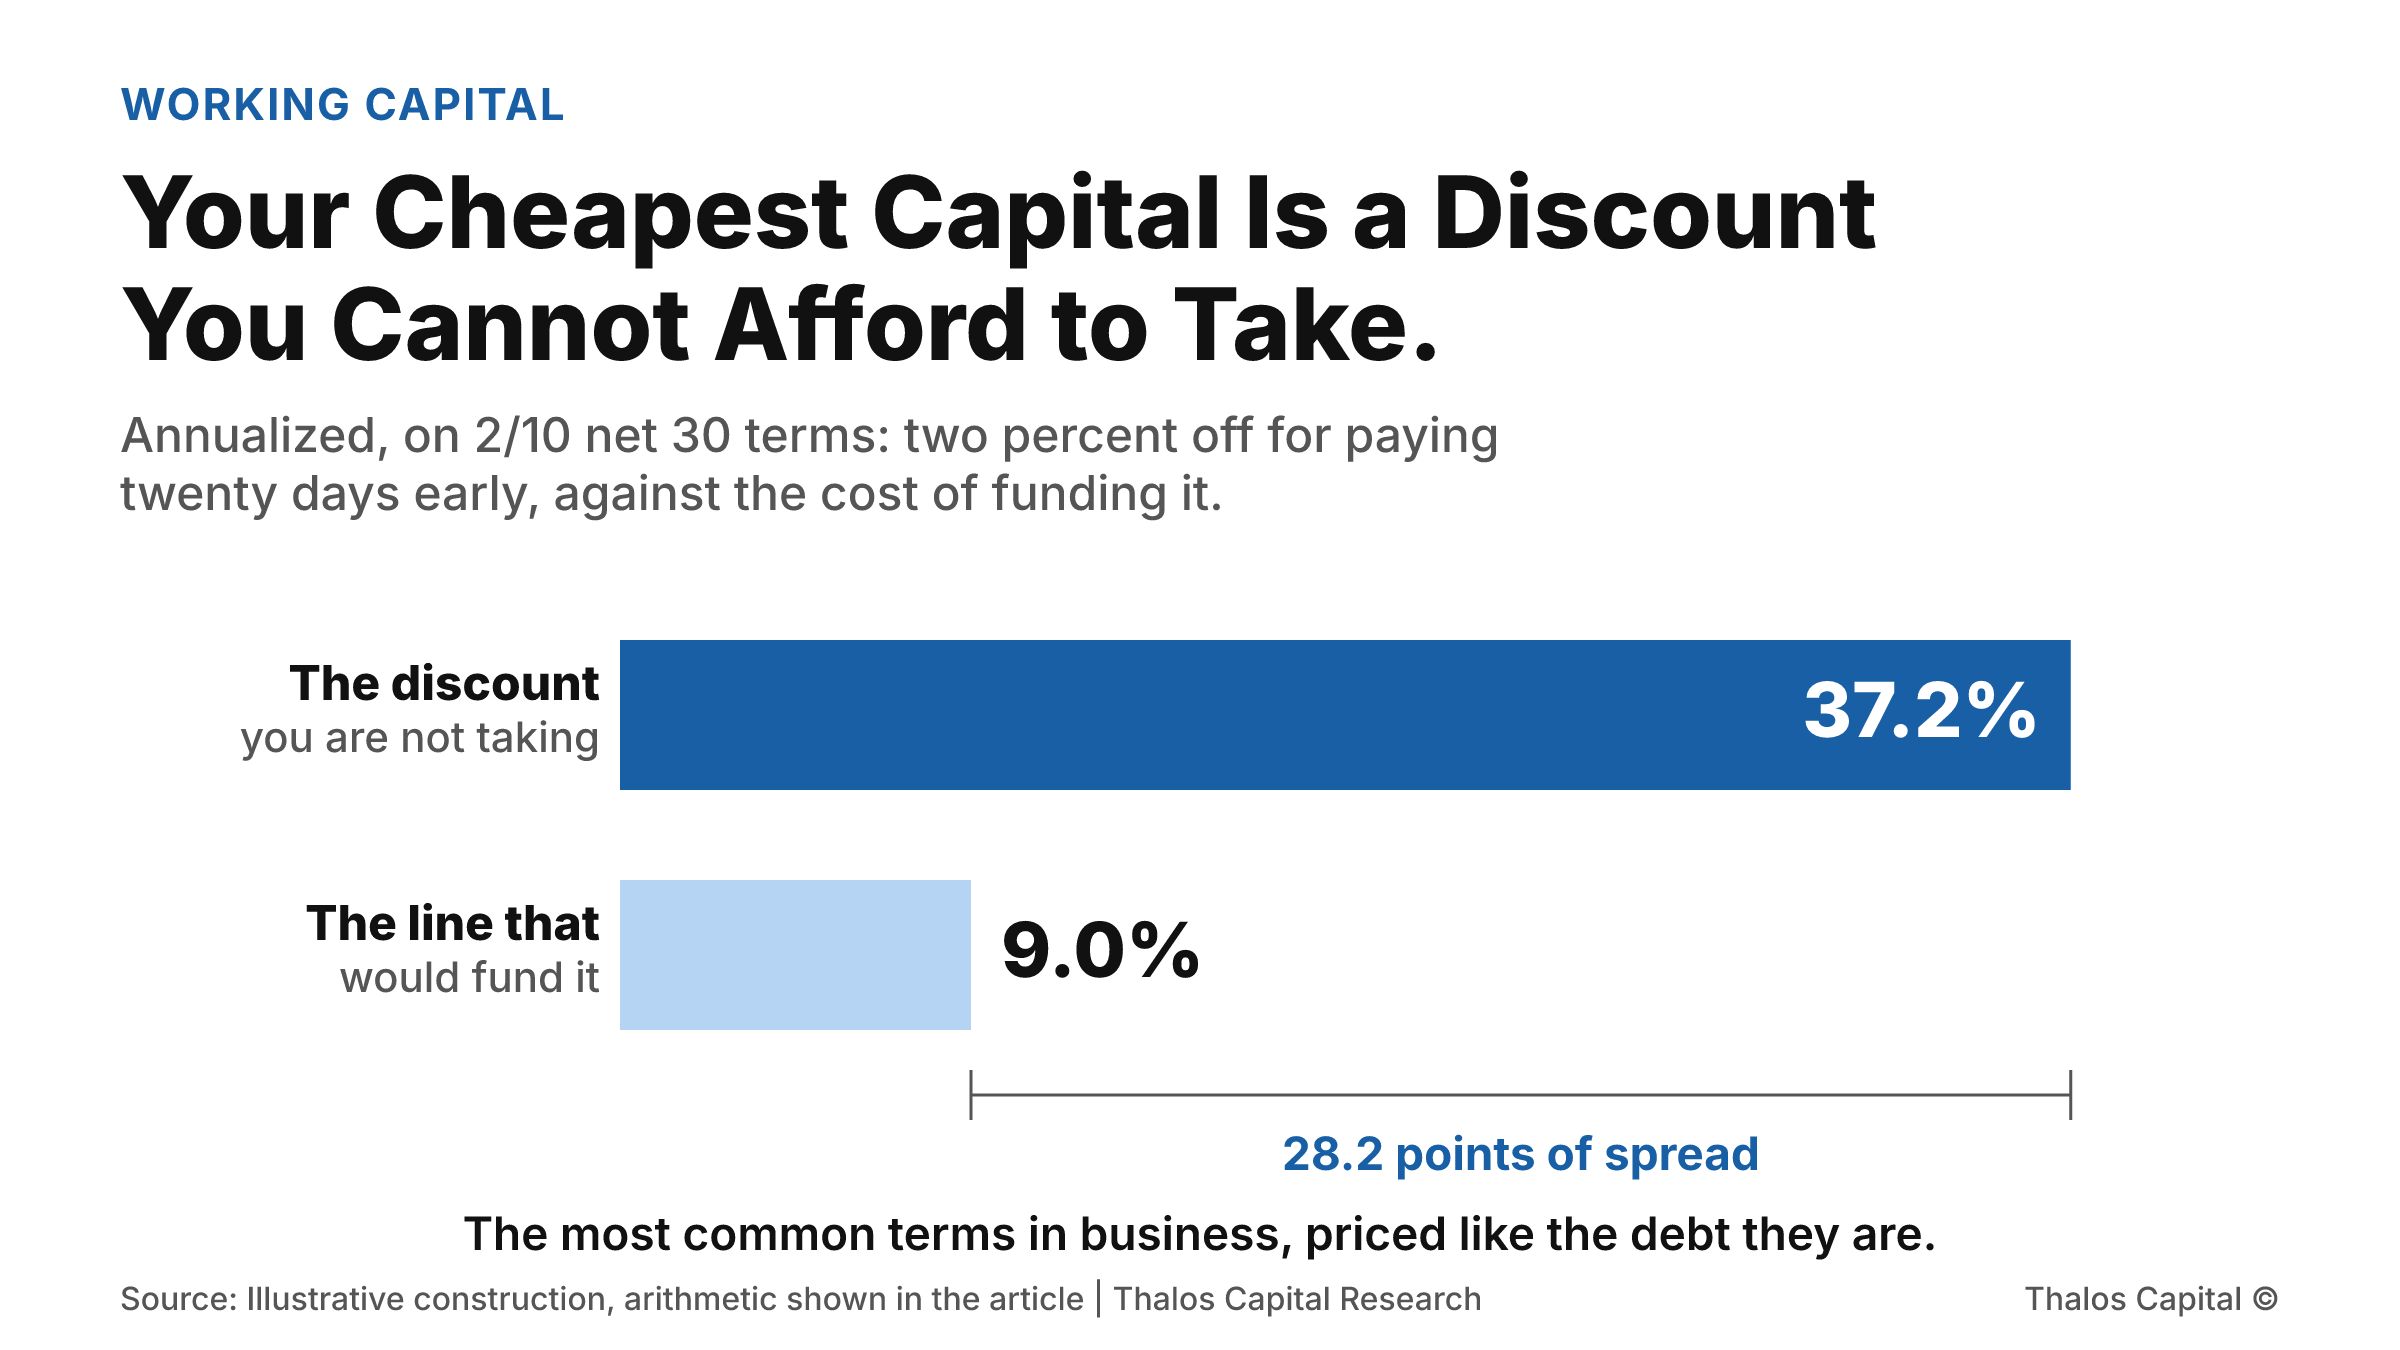
Two horizontal bars comparing the annualized value of a 2/10 net 30 early payment discount at 37.2 percent against the roughly 9 percent all-in cost of a working capital line used to fund it, a spread of 28.2 points.

Your Cheapest Capital Is a Discount You Cannot Afford to Take.

Customers moved from net 30 to net 60, which tied up an extra $1.08 million. The consequence shows up on the other side of the business, where $162,000 of supplier discounts go unclaimed every year because the cash is not there.
Read More
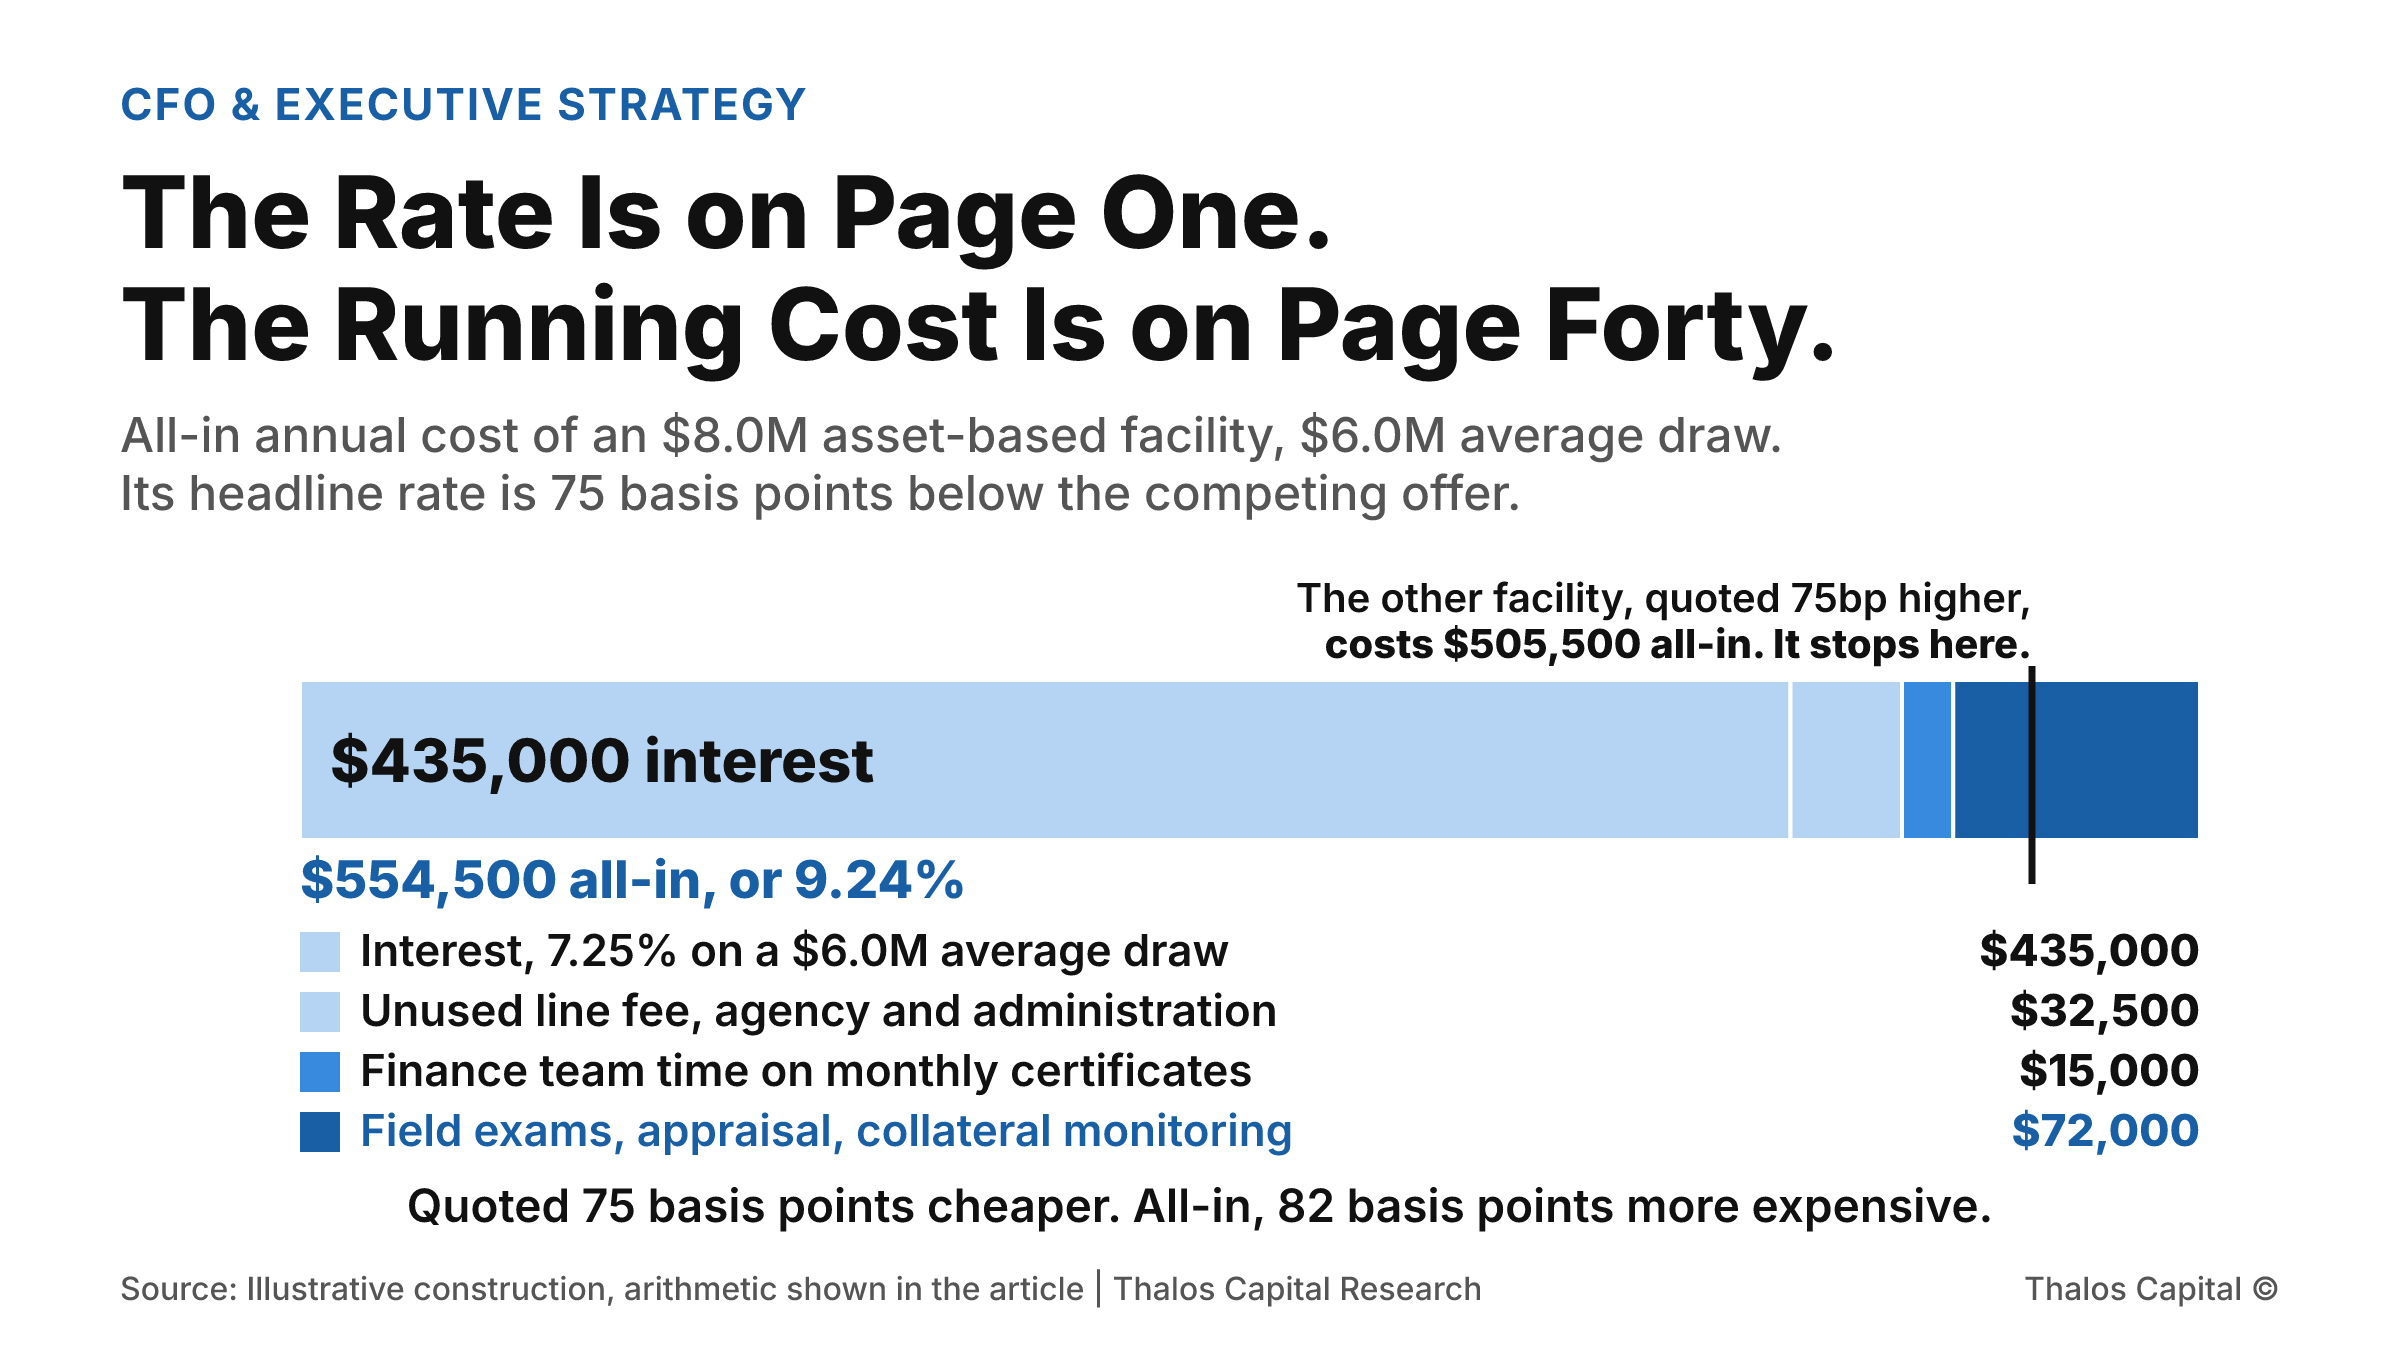
A single stacked bar of the all-in annual cost of an $8.0 million asset-based facility at a $6.0 million average draw, totalling $554,500, with a marker showing that a competing facility quoted 75 basis points higher costs $505,500 all-in.

The Rate Is on Page One. The Running Cost Is on Page Forty.

Two facilities quoted 75 basis points apart. Once field exams, appraisals, collateral monitoring and the finance team's own hours are counted, the cheaper-looking one costs 82 basis points more to run. The gap reverses entirely.
Read More
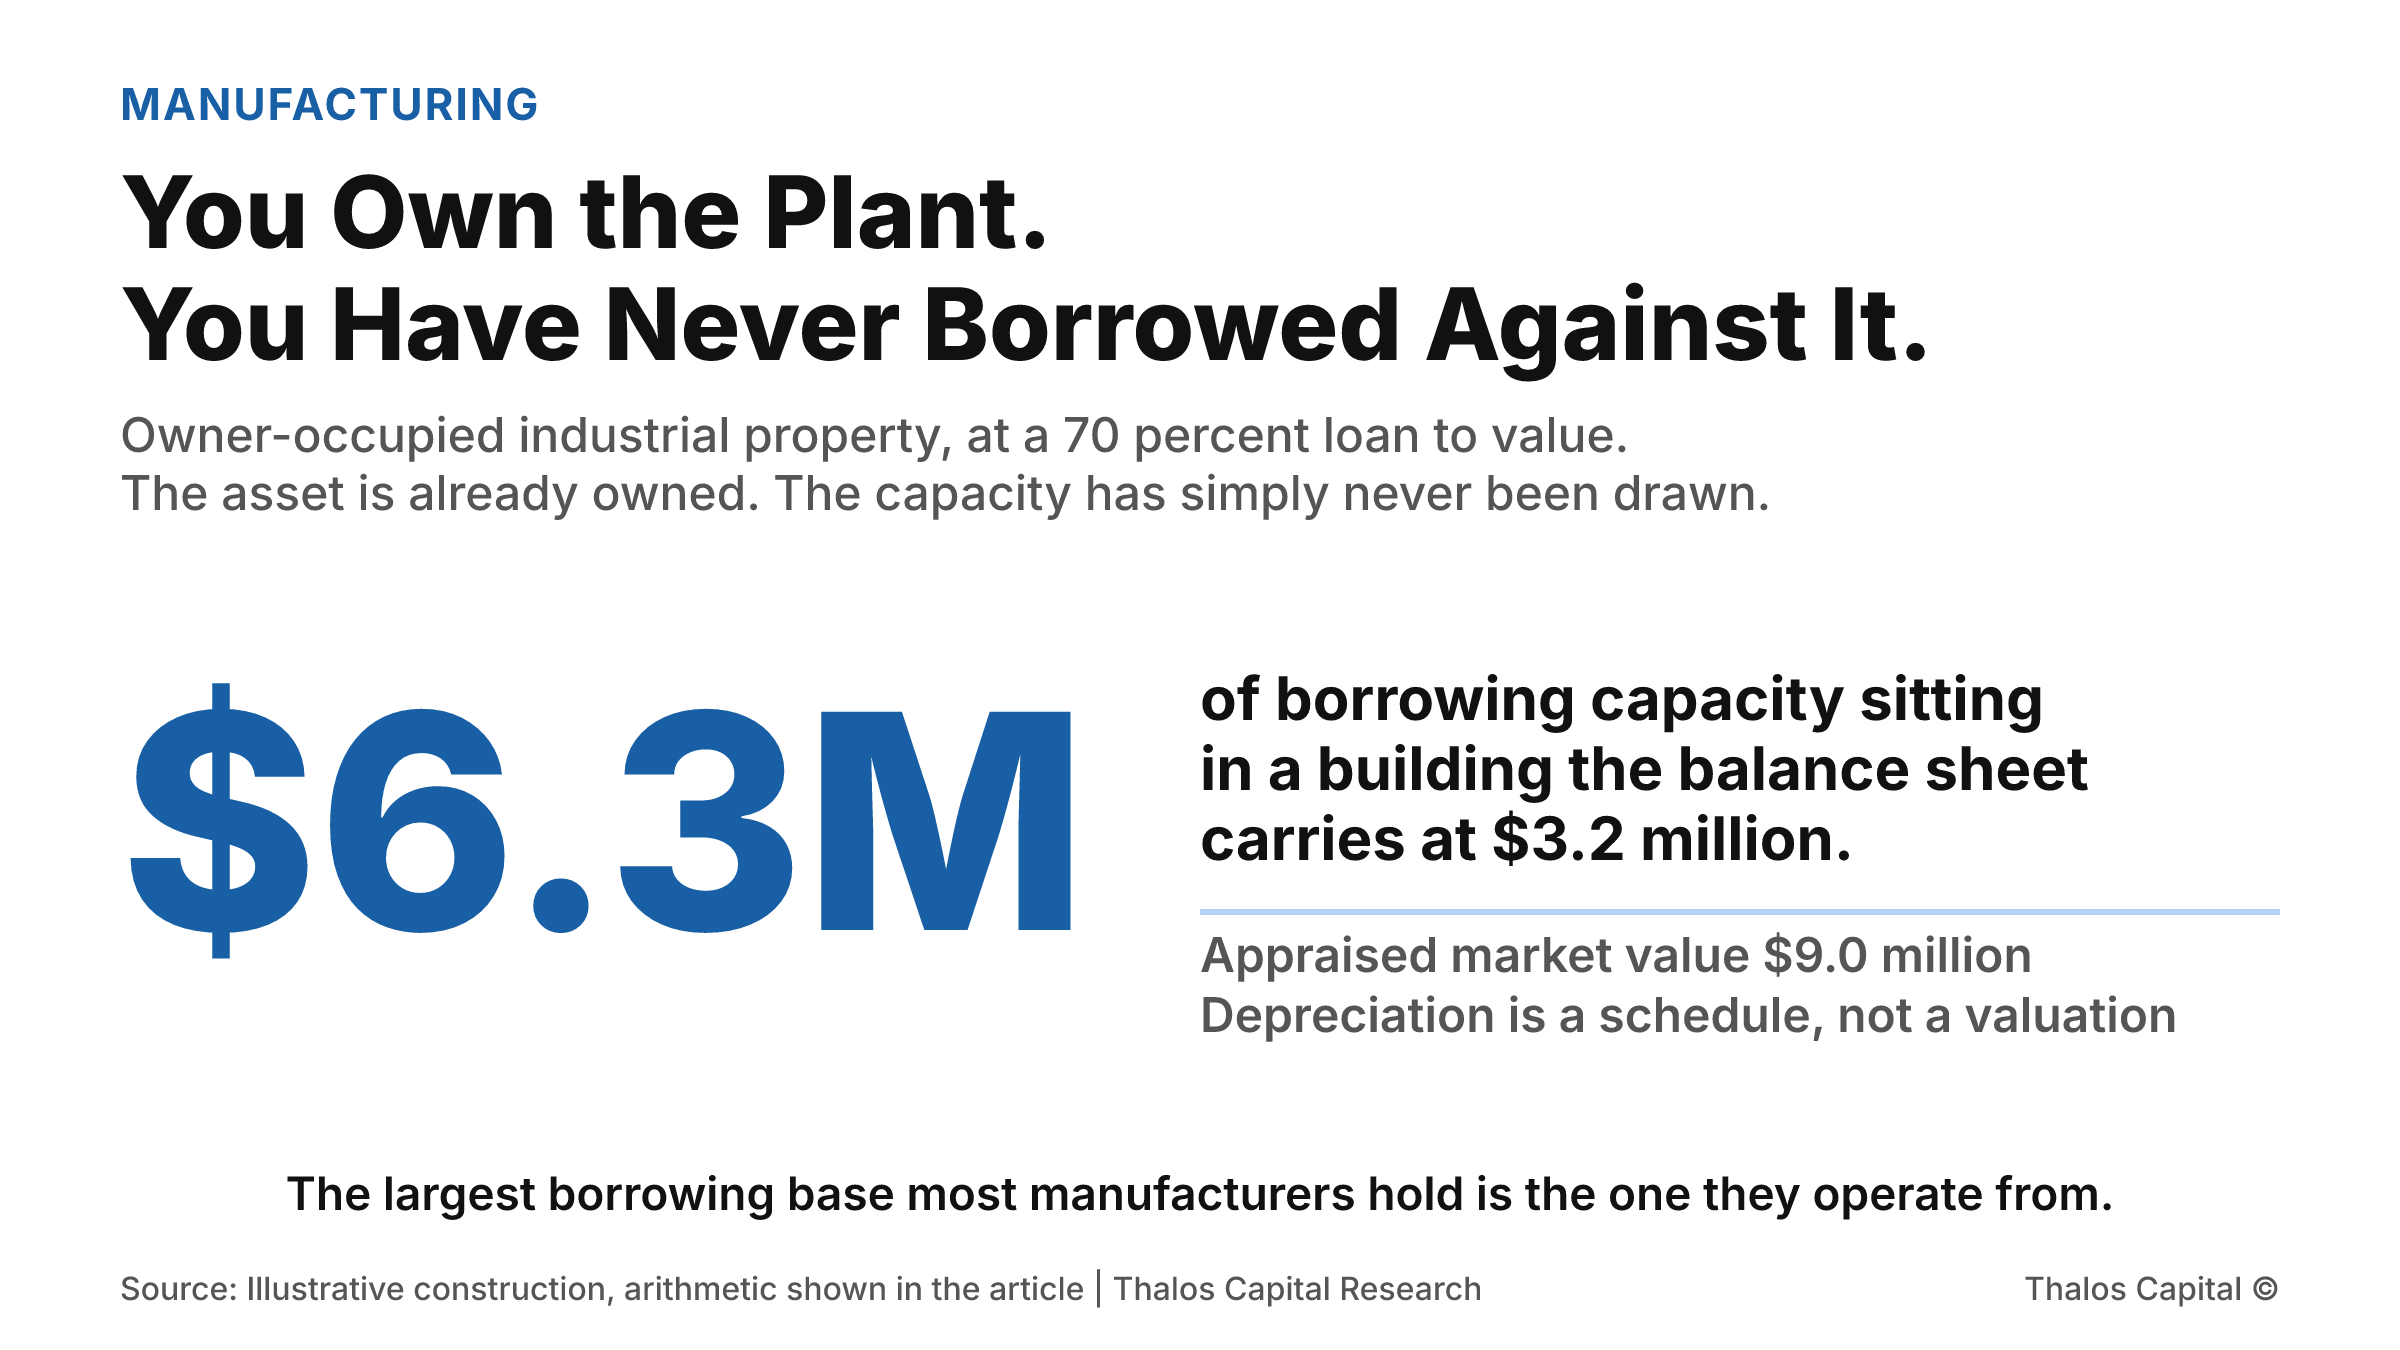
A single large figure of $6.3 million of borrowing capacity available against an owner-occupied manufacturing plant at a 70 percent loan to value, set against the $3.2 million depreciated book value the balance sheet carries and a $9.0 million market value.

You Own the Plant. You Have Never Borrowed Against It.

A manufacturer finances equipment and receivables while its largest asset sits untouched, carried at a depreciated book value that hides what it is worth. Two routes convert it to cash, and only one of them is a loan.
Read More
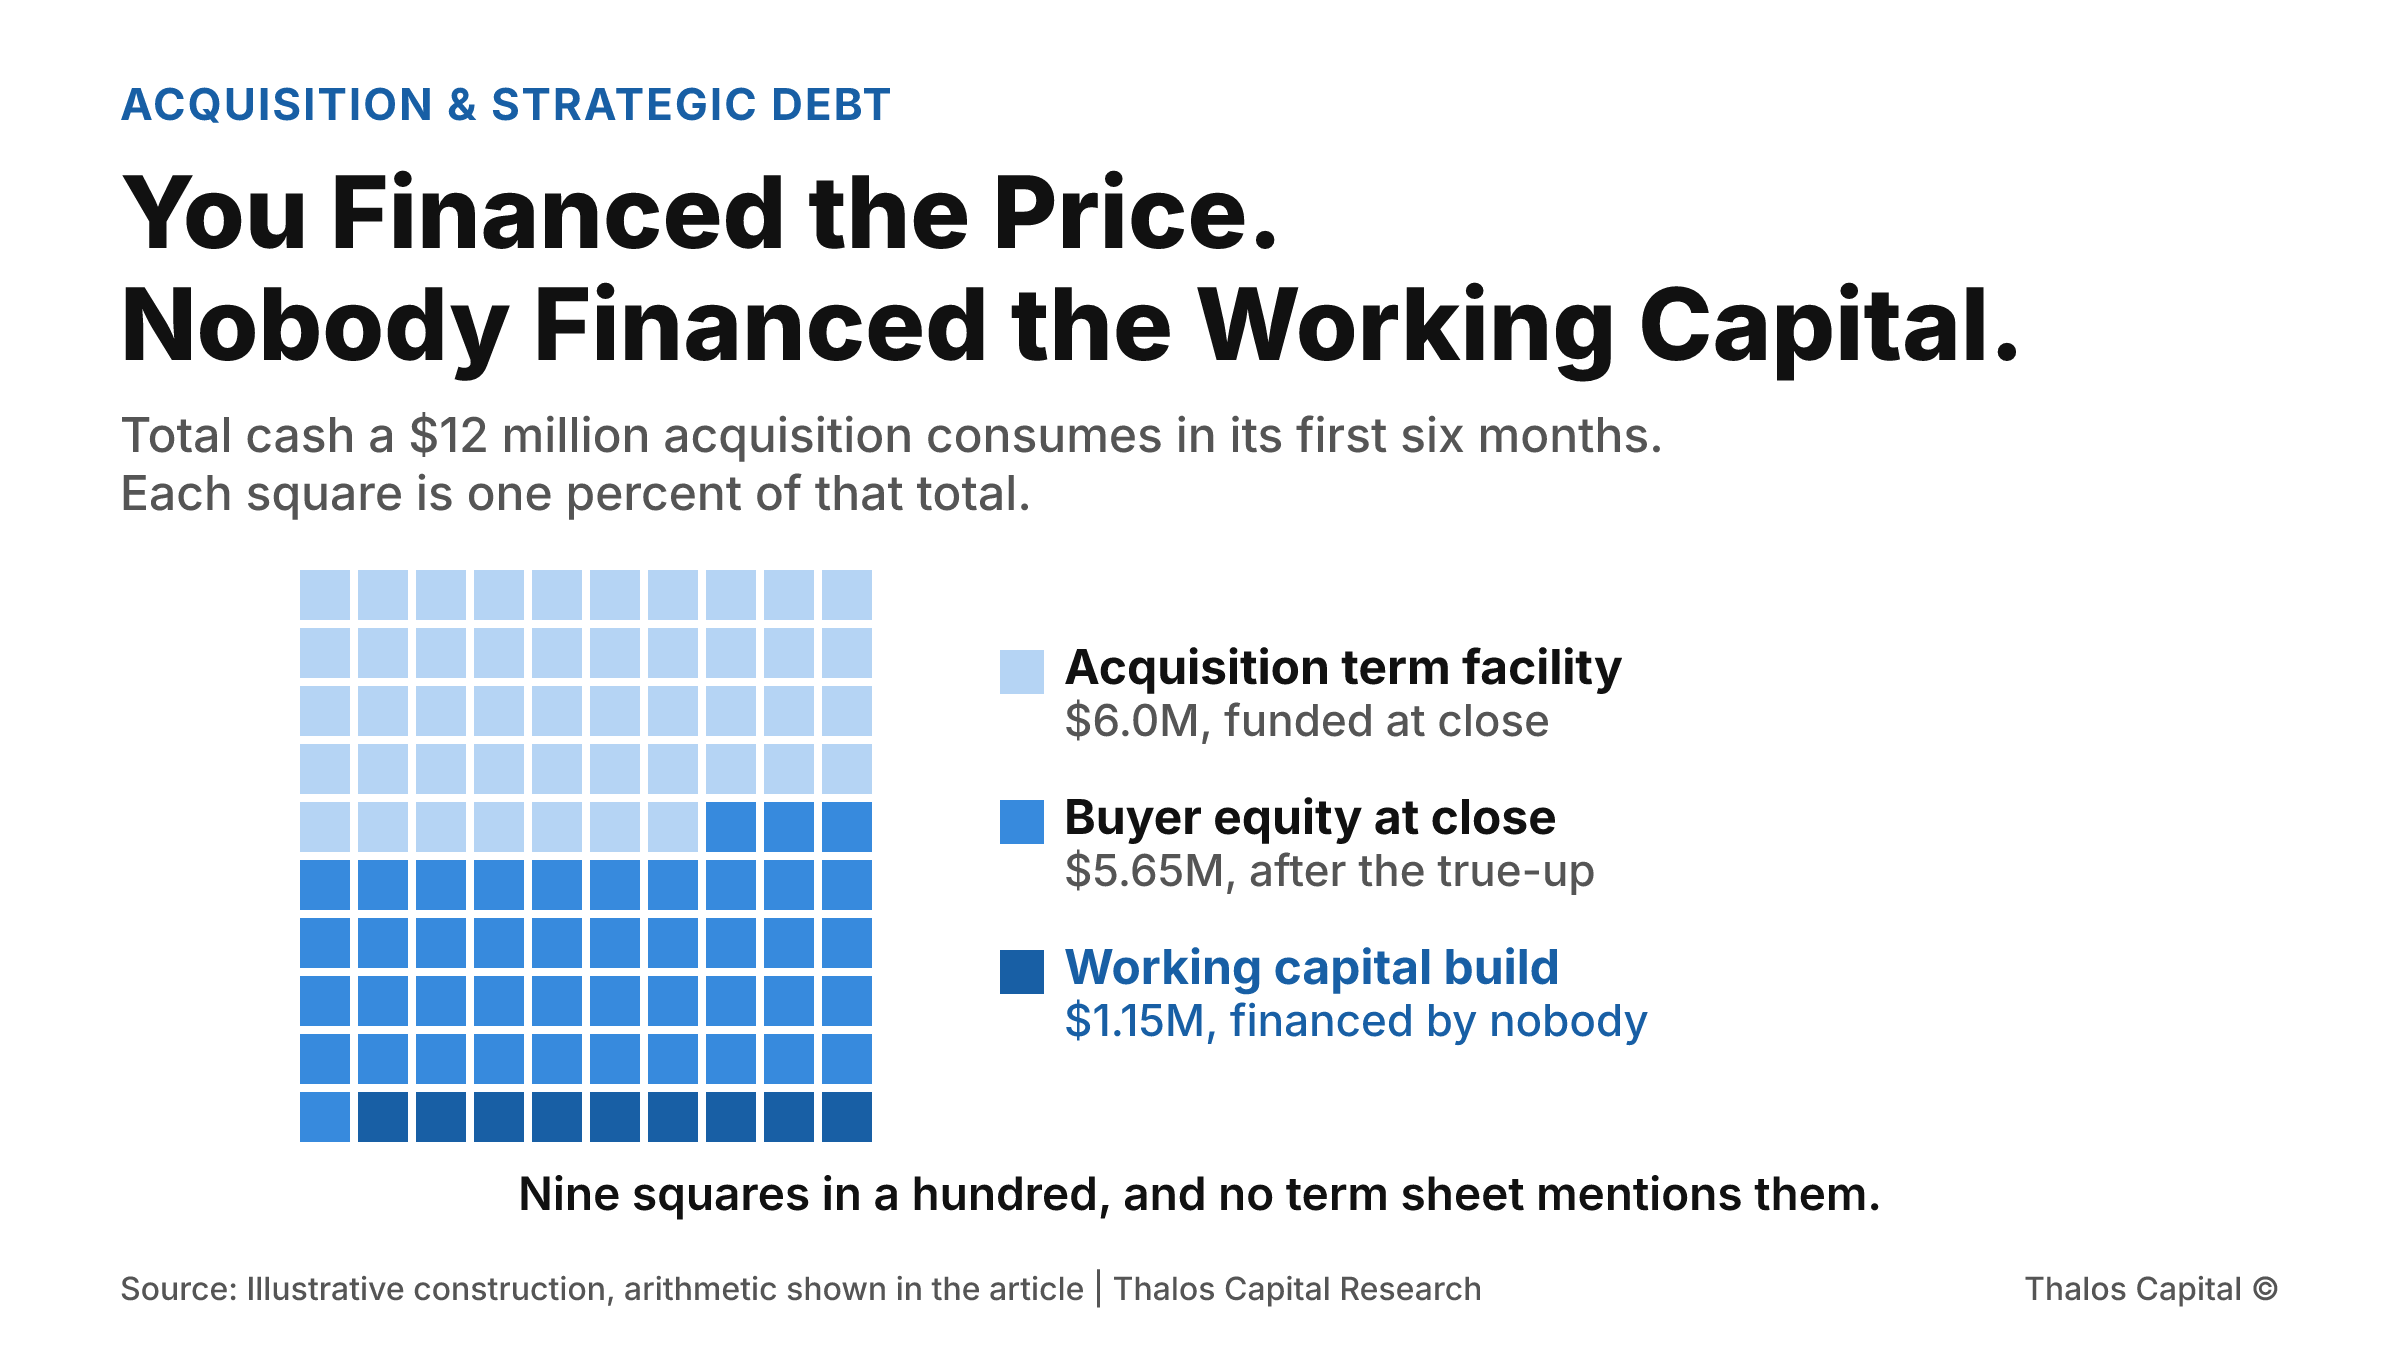
A hundred-square waffle showing the total cash a $12 million acquisition consumes in its first six months: 47 squares funded by the acquisition term facility, 44 by buyer equity at close, and 9 by a working capital build that sits outside the deal model.

You Financed the Price. Nobody Financed the Working Capital.

A buyer models an acquisition as price minus debt equals equity. Then the working capital true-up lands, and the seasonal build after it. The cash required is the same whichever month the deal closes, and the acquisition facility funds none of it.
Read More
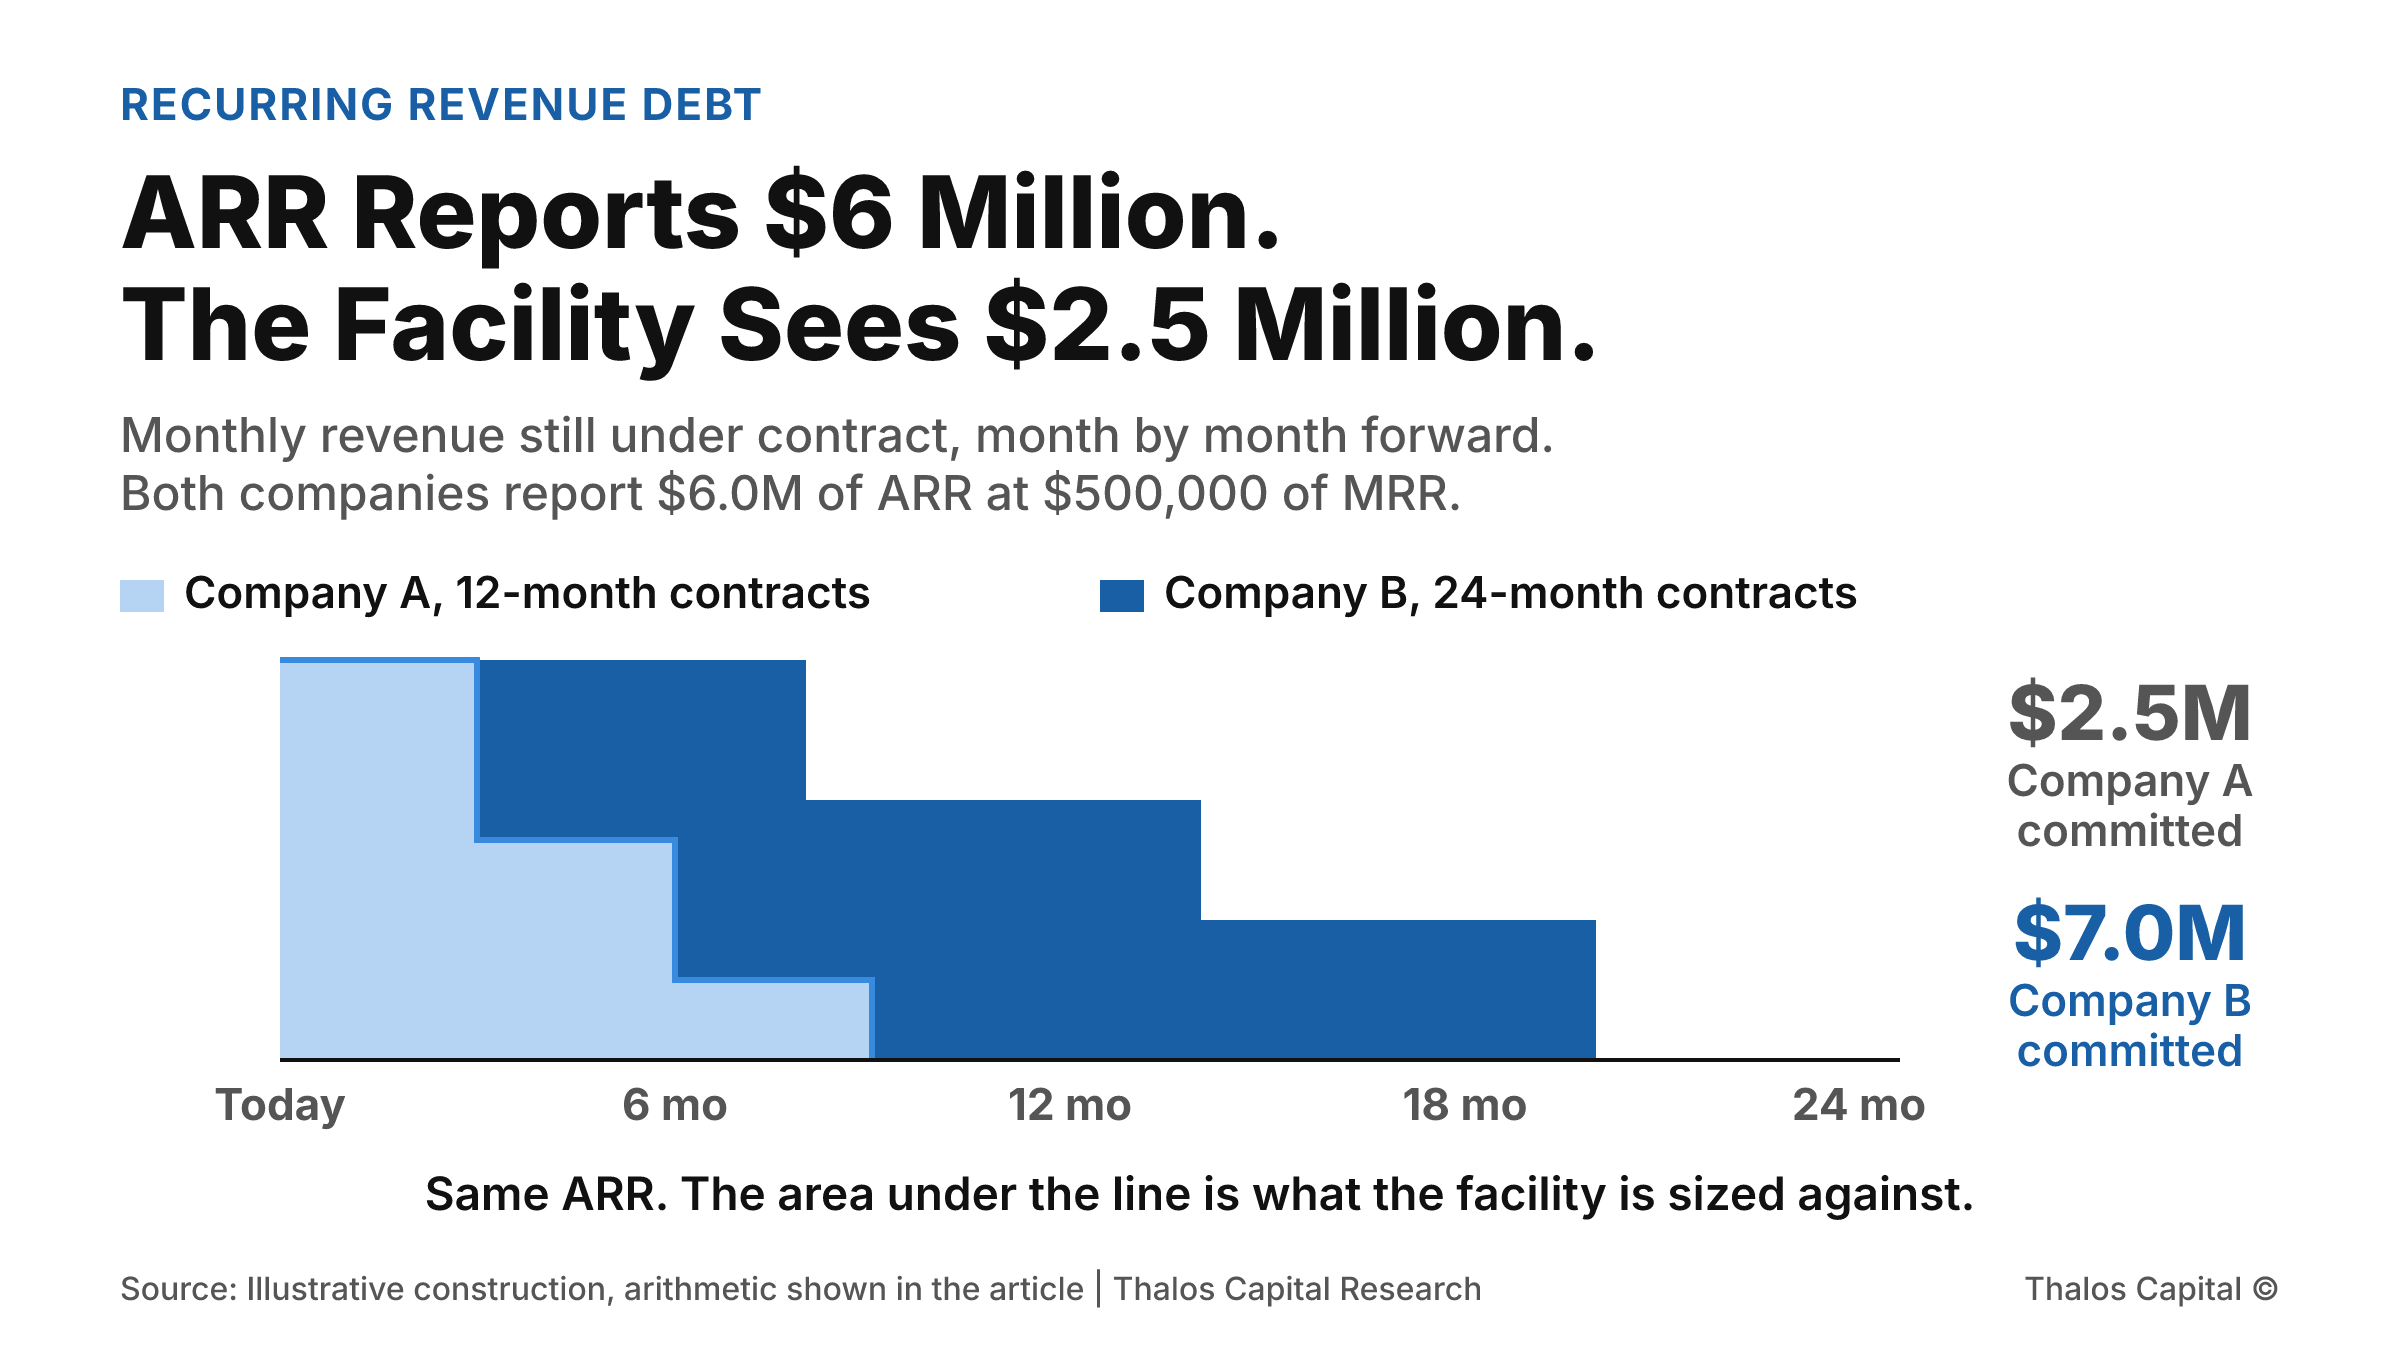
Two stepped areas showing monthly revenue still under contract over the next 24 months for two companies with identical $6.0 million ARR: a 12-month contract book holding $2.5 million of remaining contracted value and a 24-month contract book holding $7.0 million.

ARR Reports $6 Million. The Facility Sees $2.5 Million.

Two recurring-revenue companies each report $6.0 million of ARR. One is offered a $2.0 million facility and the other $1.0 million. The difference is contract length, and it does not appear in any metric either company reports.
Read More
Working through a financing decision?
Insights are a starting point. A conversation maps your actual options.
Tell us what you are financing and we will map the structures and sources that fit.
Submit your financing request →
Explore our financing solutions
Equipment FinancingWorking CapitalAsset-Based LendingStrategic Debt