Category

Borrower Advisory

66 insights · page 3 of 9

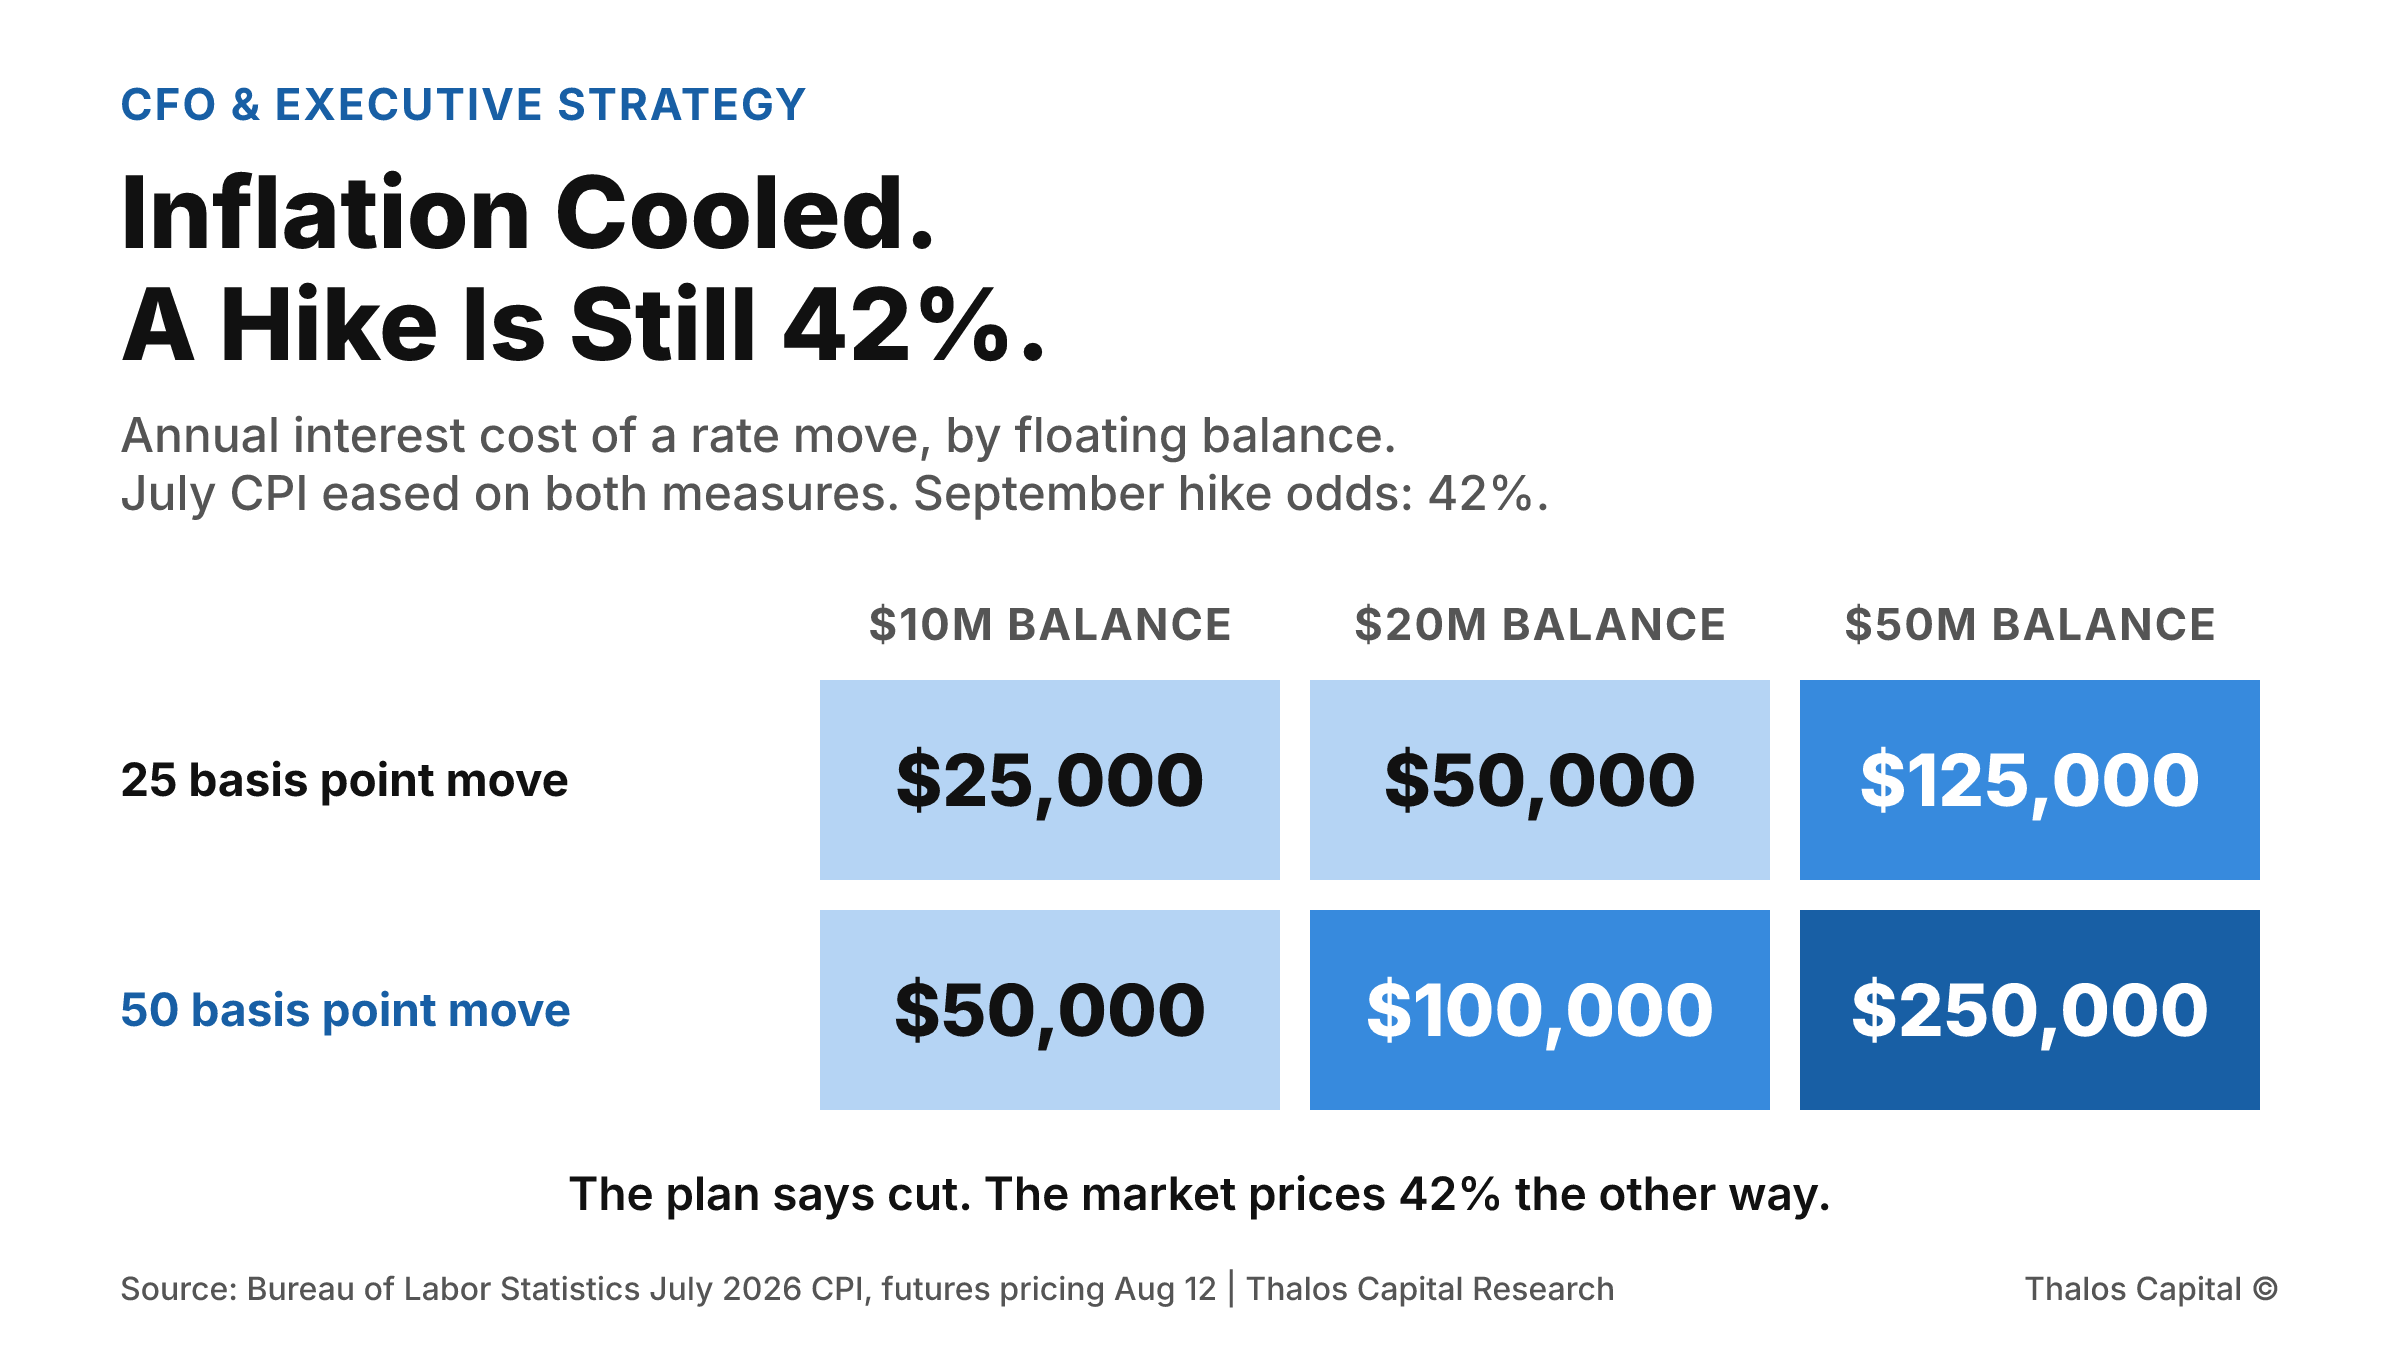
Shaded grid of the annual interest cost of a rate move across three floating balances: a 25 basis point move costs $25,000 on $10 million, $50,000 on $20 million and $125,000 on $50 million, and a 50 basis point move costs $50,000, $100,000 and $250,000 respectively.

Inflation Cooled. A Hike Is Still a 42 Percent Bet.

July CPI came in exactly as forecast, both measures eased, and Treasury yields fell across the board. Futures still priced a 42 percent chance of a September hike. What that asymmetry is worth on a floating balance.
Read More
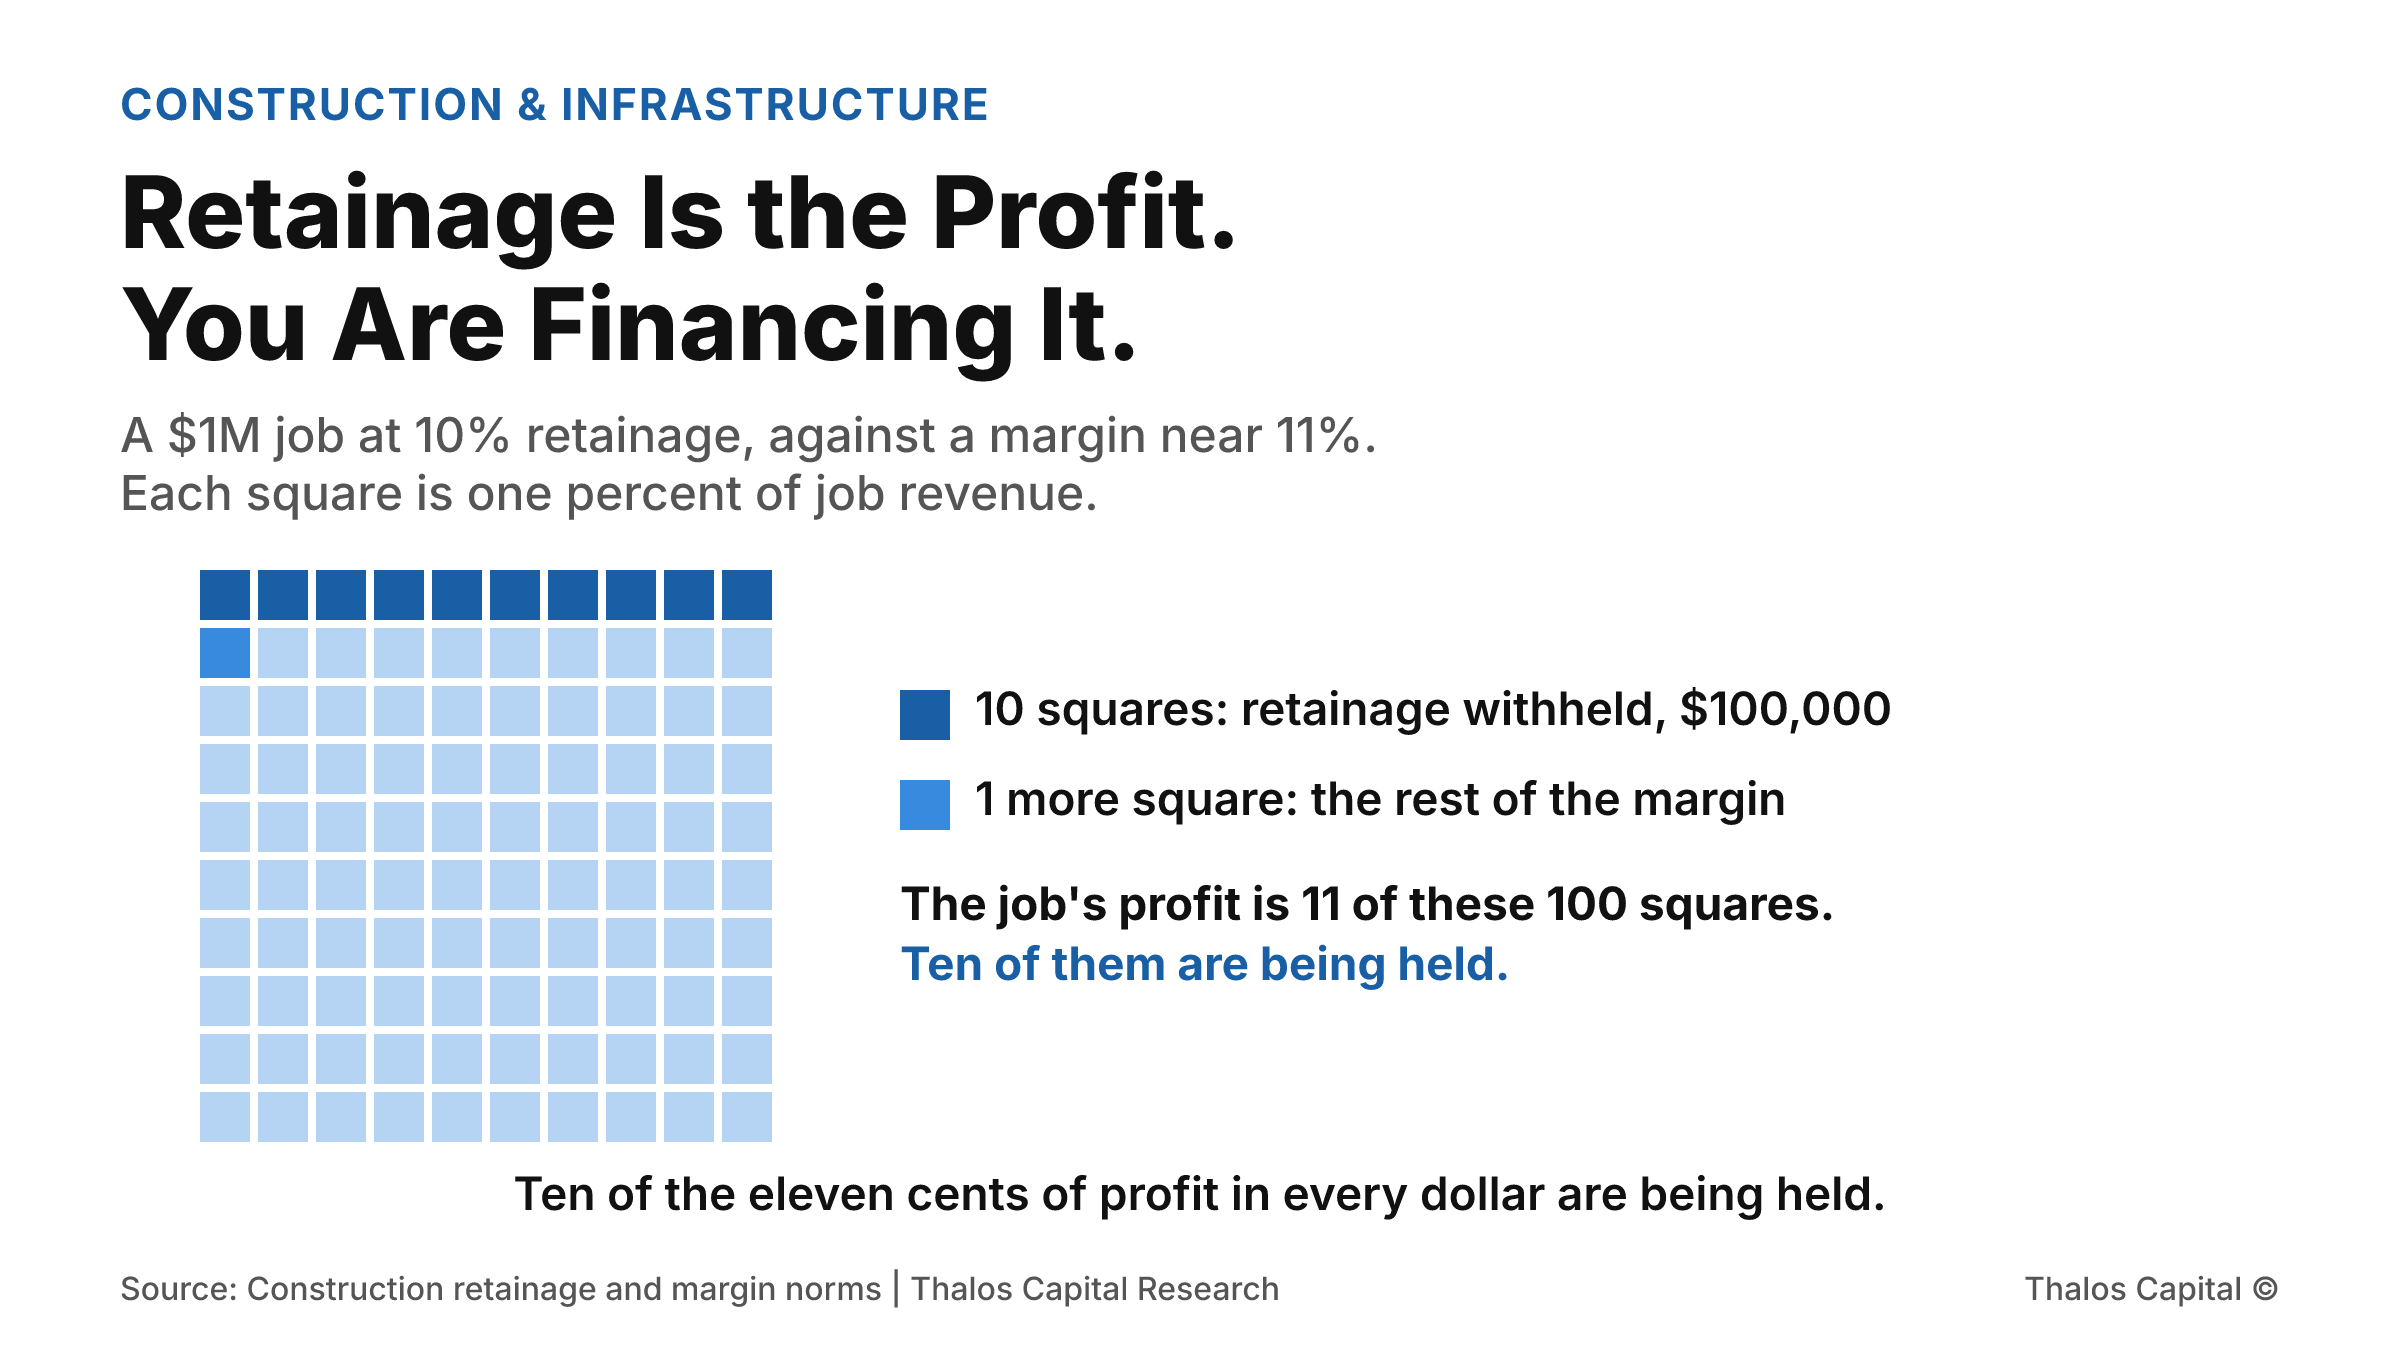
Waffle grid of 100 squares representing a $1 million job. Ten squares in dark navy show the $100,000 withheld as retainage and one further square in mid blue completes the roughly 11 percent margin, so ten of the eleven profit squares are being held.

Retainage Is the Profit. You Are Financing It.

A ten-month job billing $100,000 a month withholds $100,000 by closeout. At builder margins near 11 percent that is almost the entire profit on the job, and a standard receivables facility gives you nothing against it.
Read More
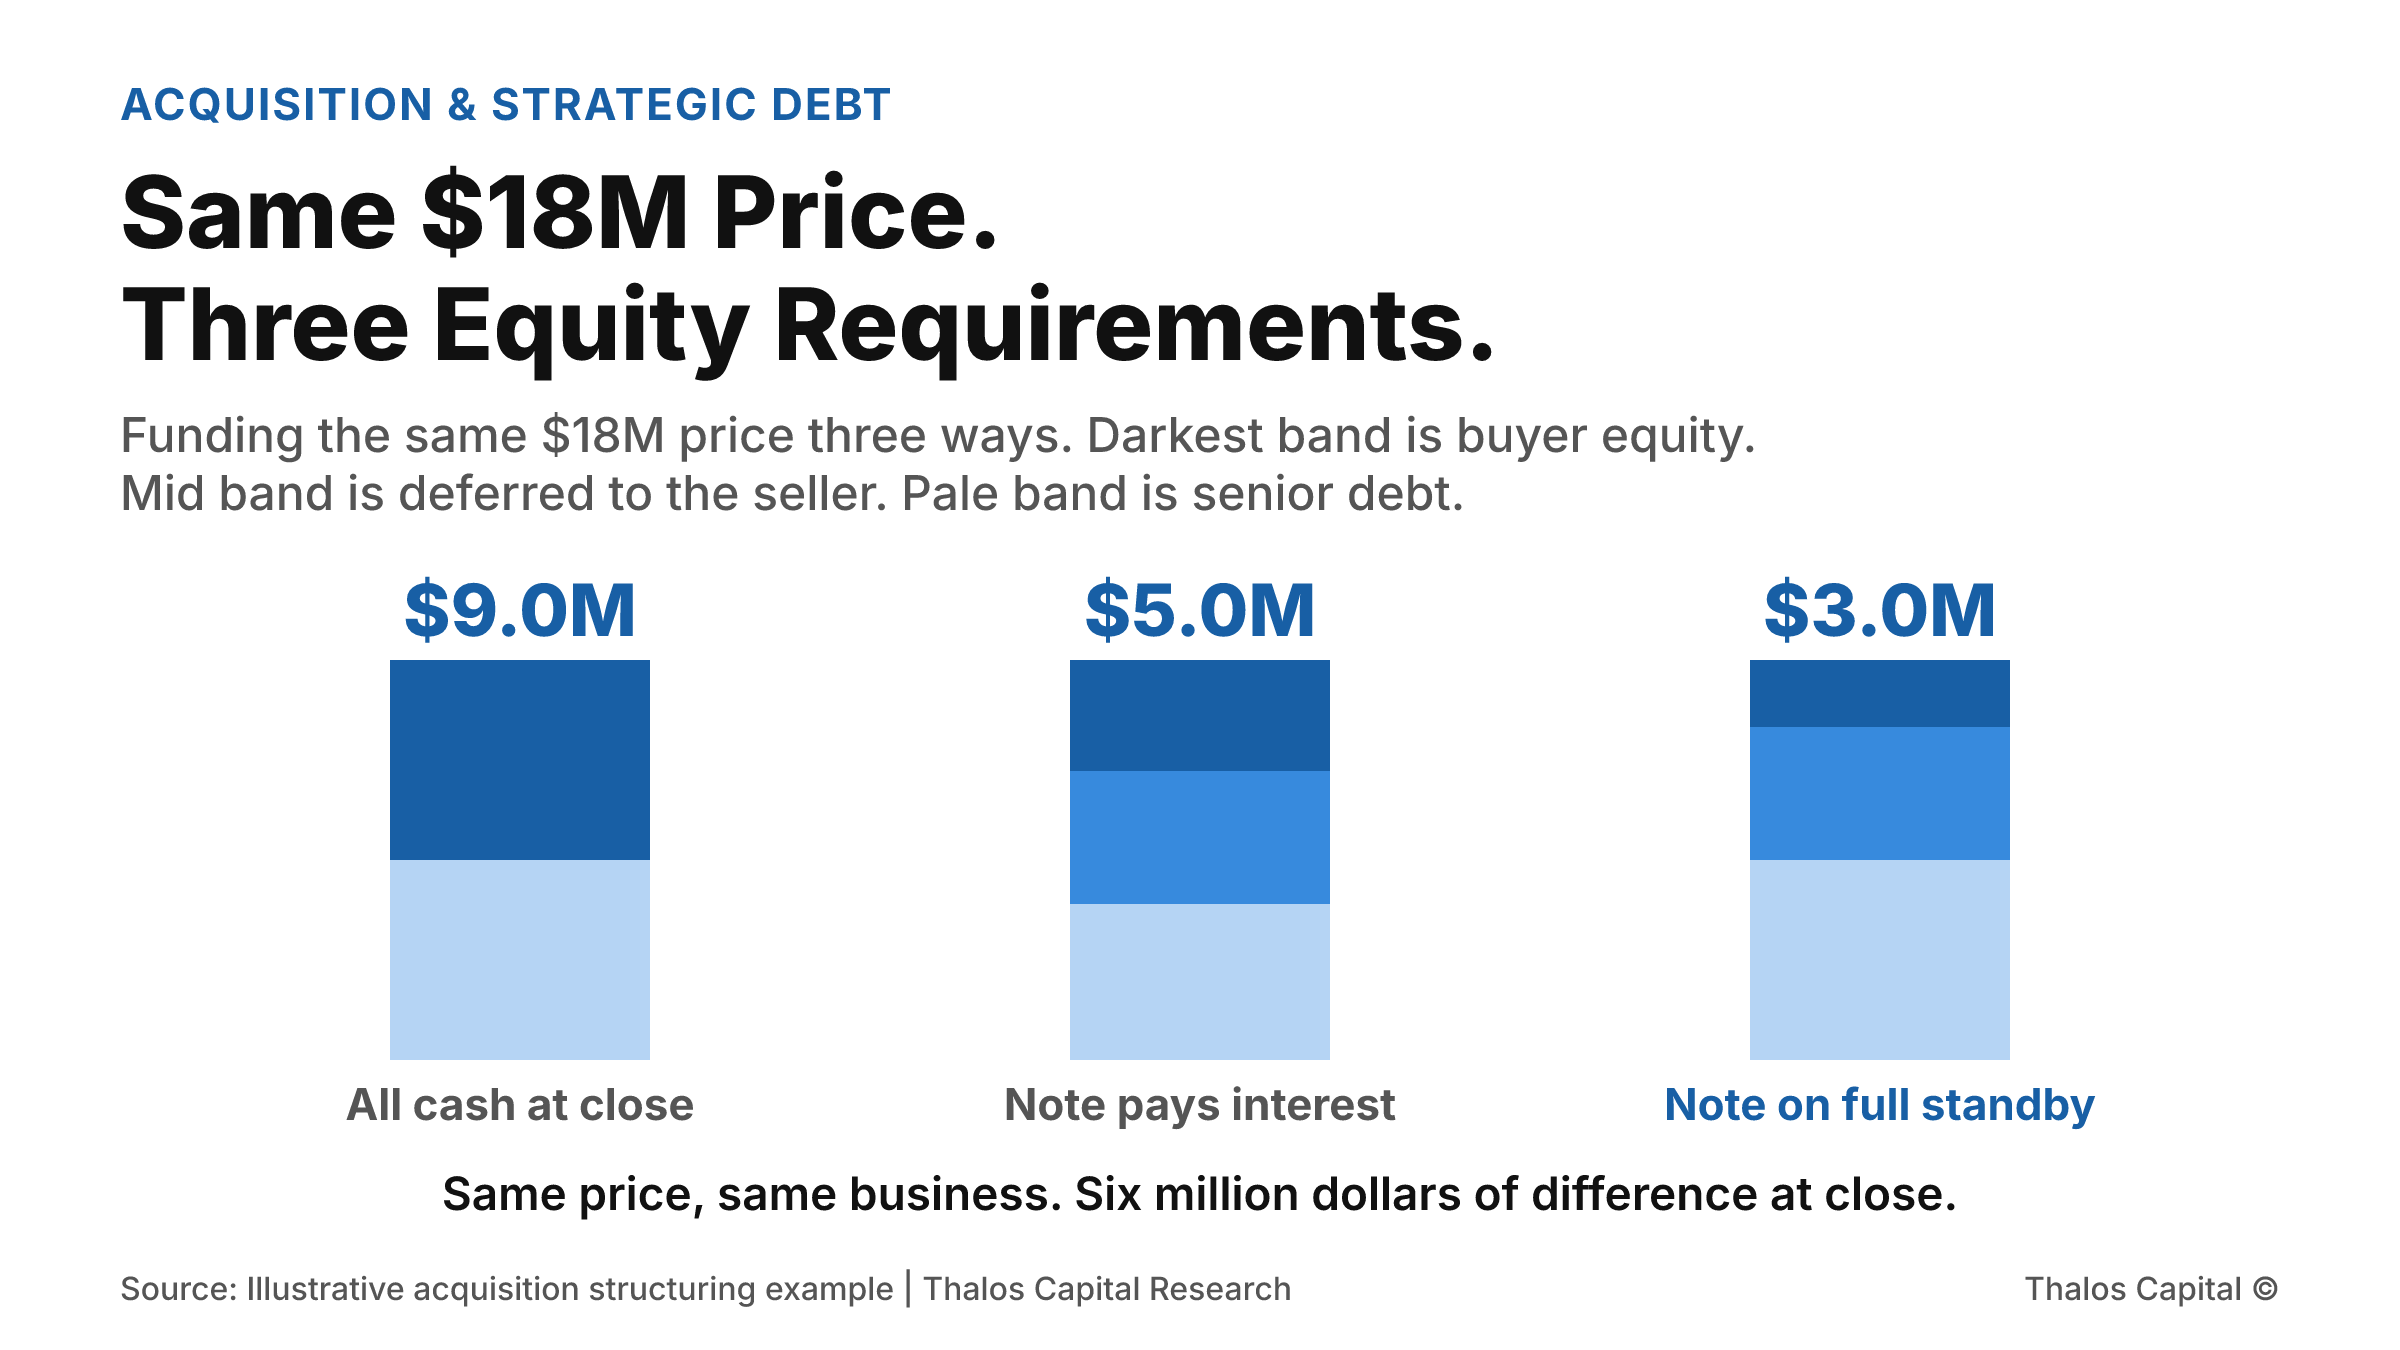
Three small stacked columns funding the same $18 million purchase price, showing buyer equity at close of $9 million on an all-cash deal, $5 million when the seller note pays current interest, and $3 million when the seller note sits on full standby.

Same $18M Price. Three Different Equity Requirements.

Two buyers agree the same $18 million price for the same business. Depending on how the deferred consideration is structured, the cash the buyer needs at close is $9 million, $5 million, or $3 million. The price never changed.
Read More
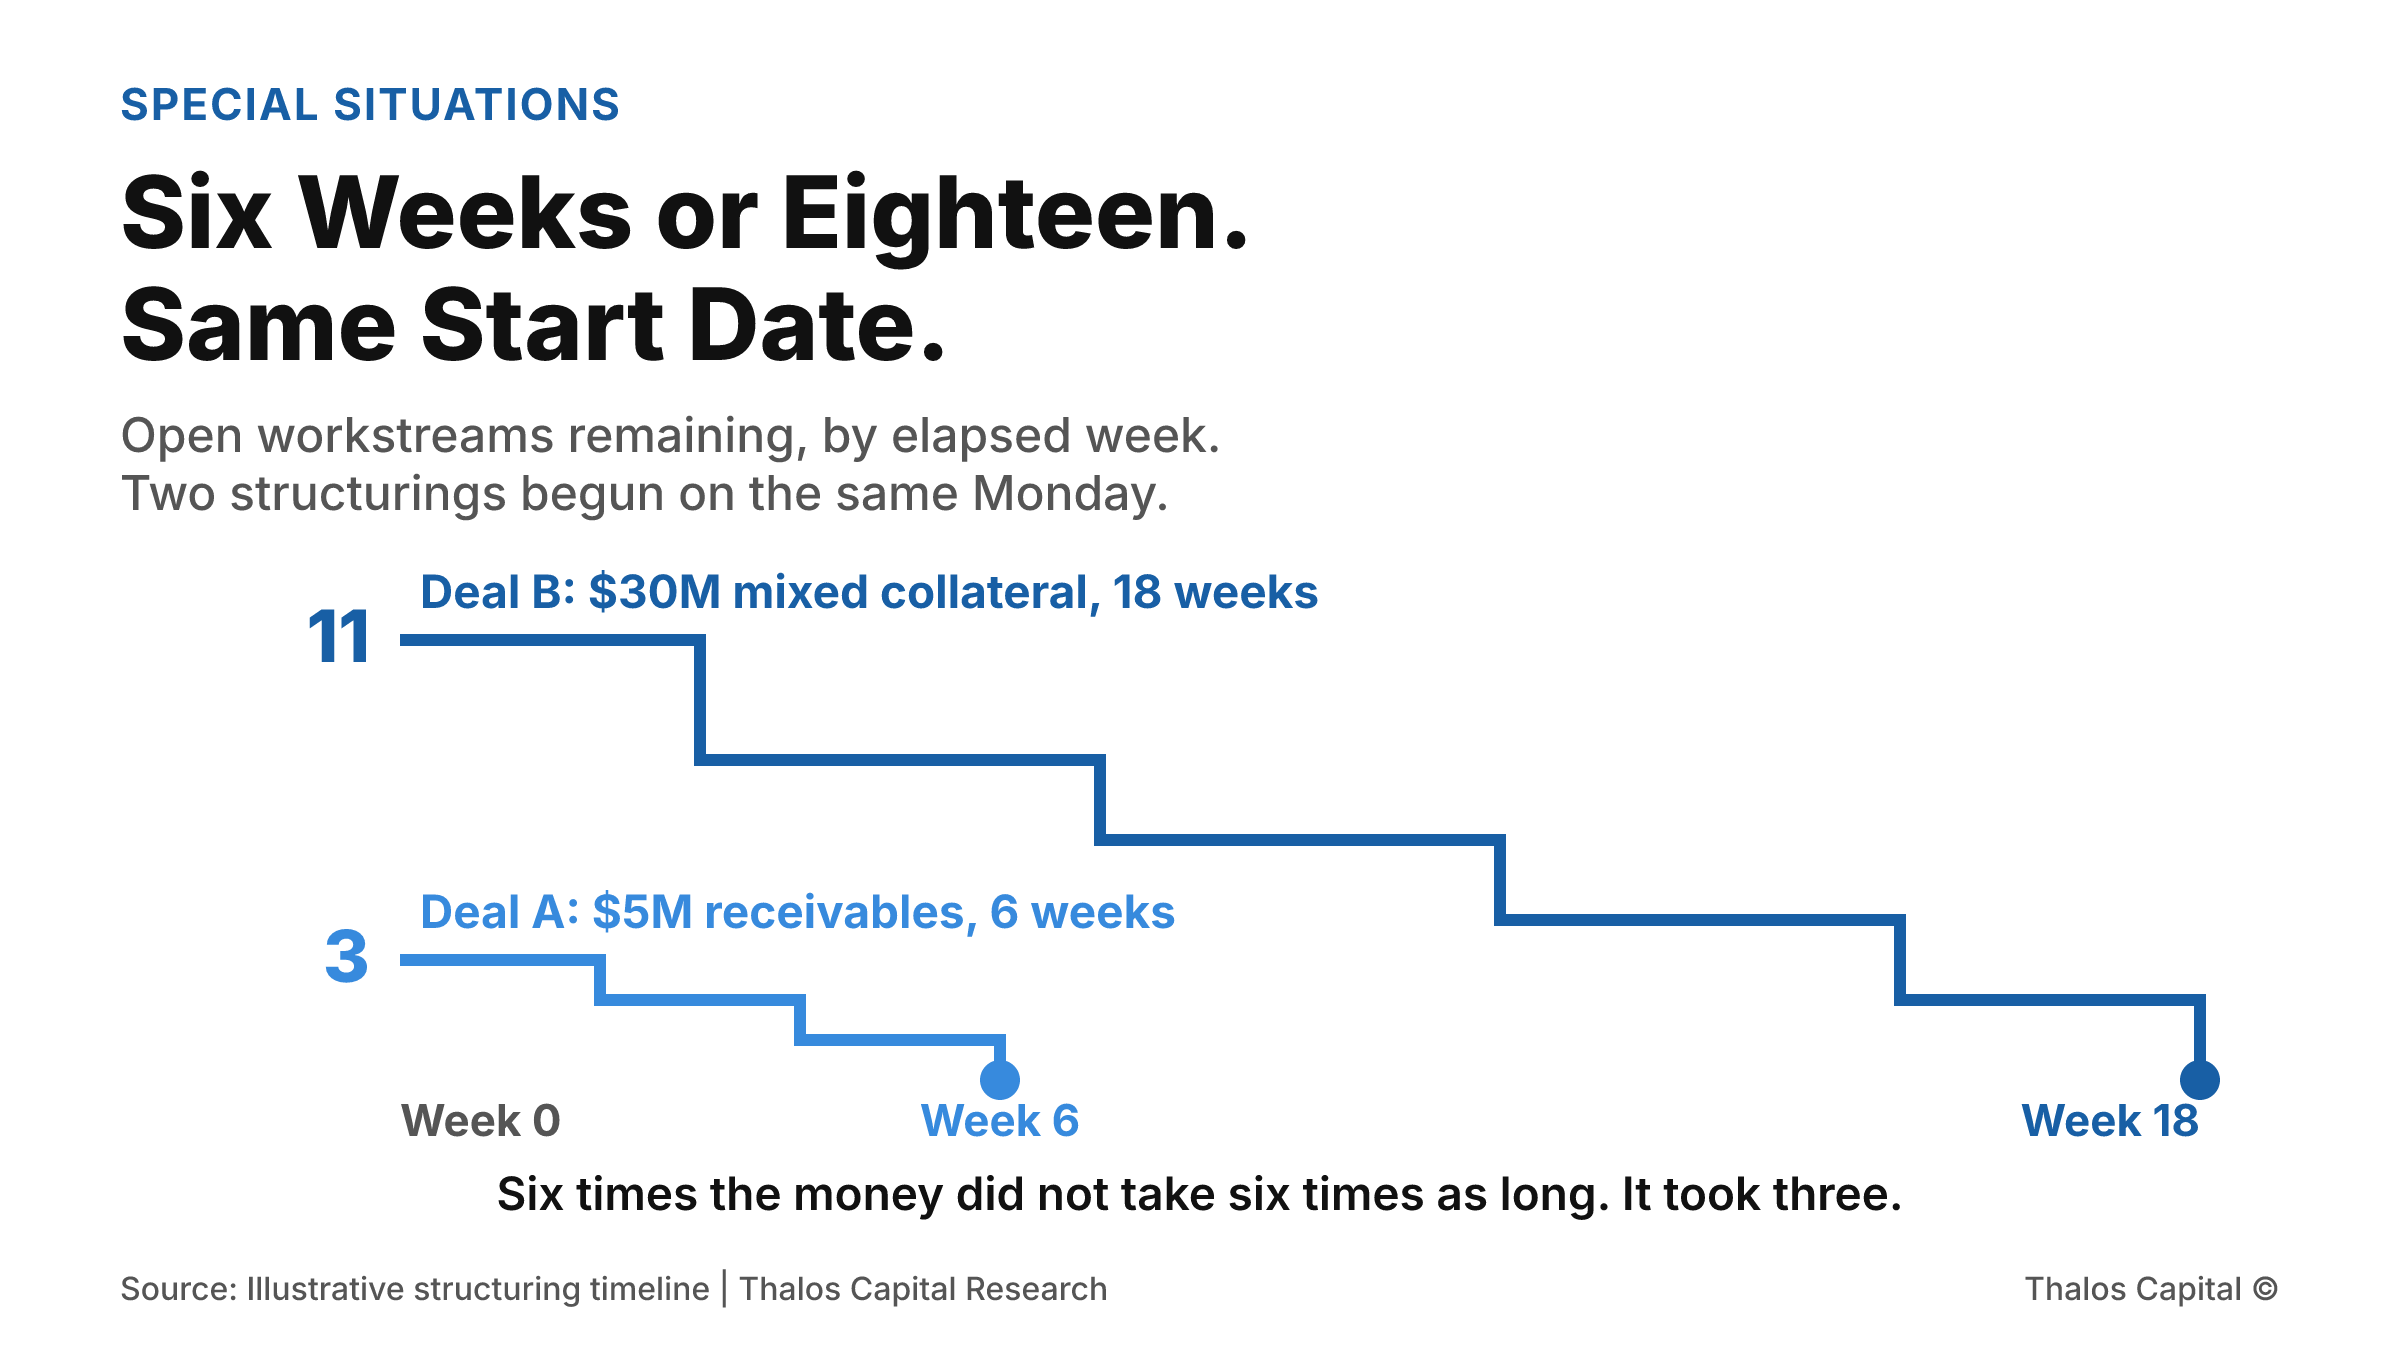
Stepped line chart of open workstreams by elapsed week for two structurings begun the same day: a $5 million receivables facility starting with three workstreams and closing in six weeks, and a $30 million mixed-collateral facility starting with eleven and closing in eighteen.

Six Weeks or Eighteen Weeks. Same Start Date.

Two principals began structuring on the same Monday. A $5 million facility against receivables closed in six weeks. A $30 million facility against mixed collateral took eighteen. Where the twelve extra weeks actually go.
Read More
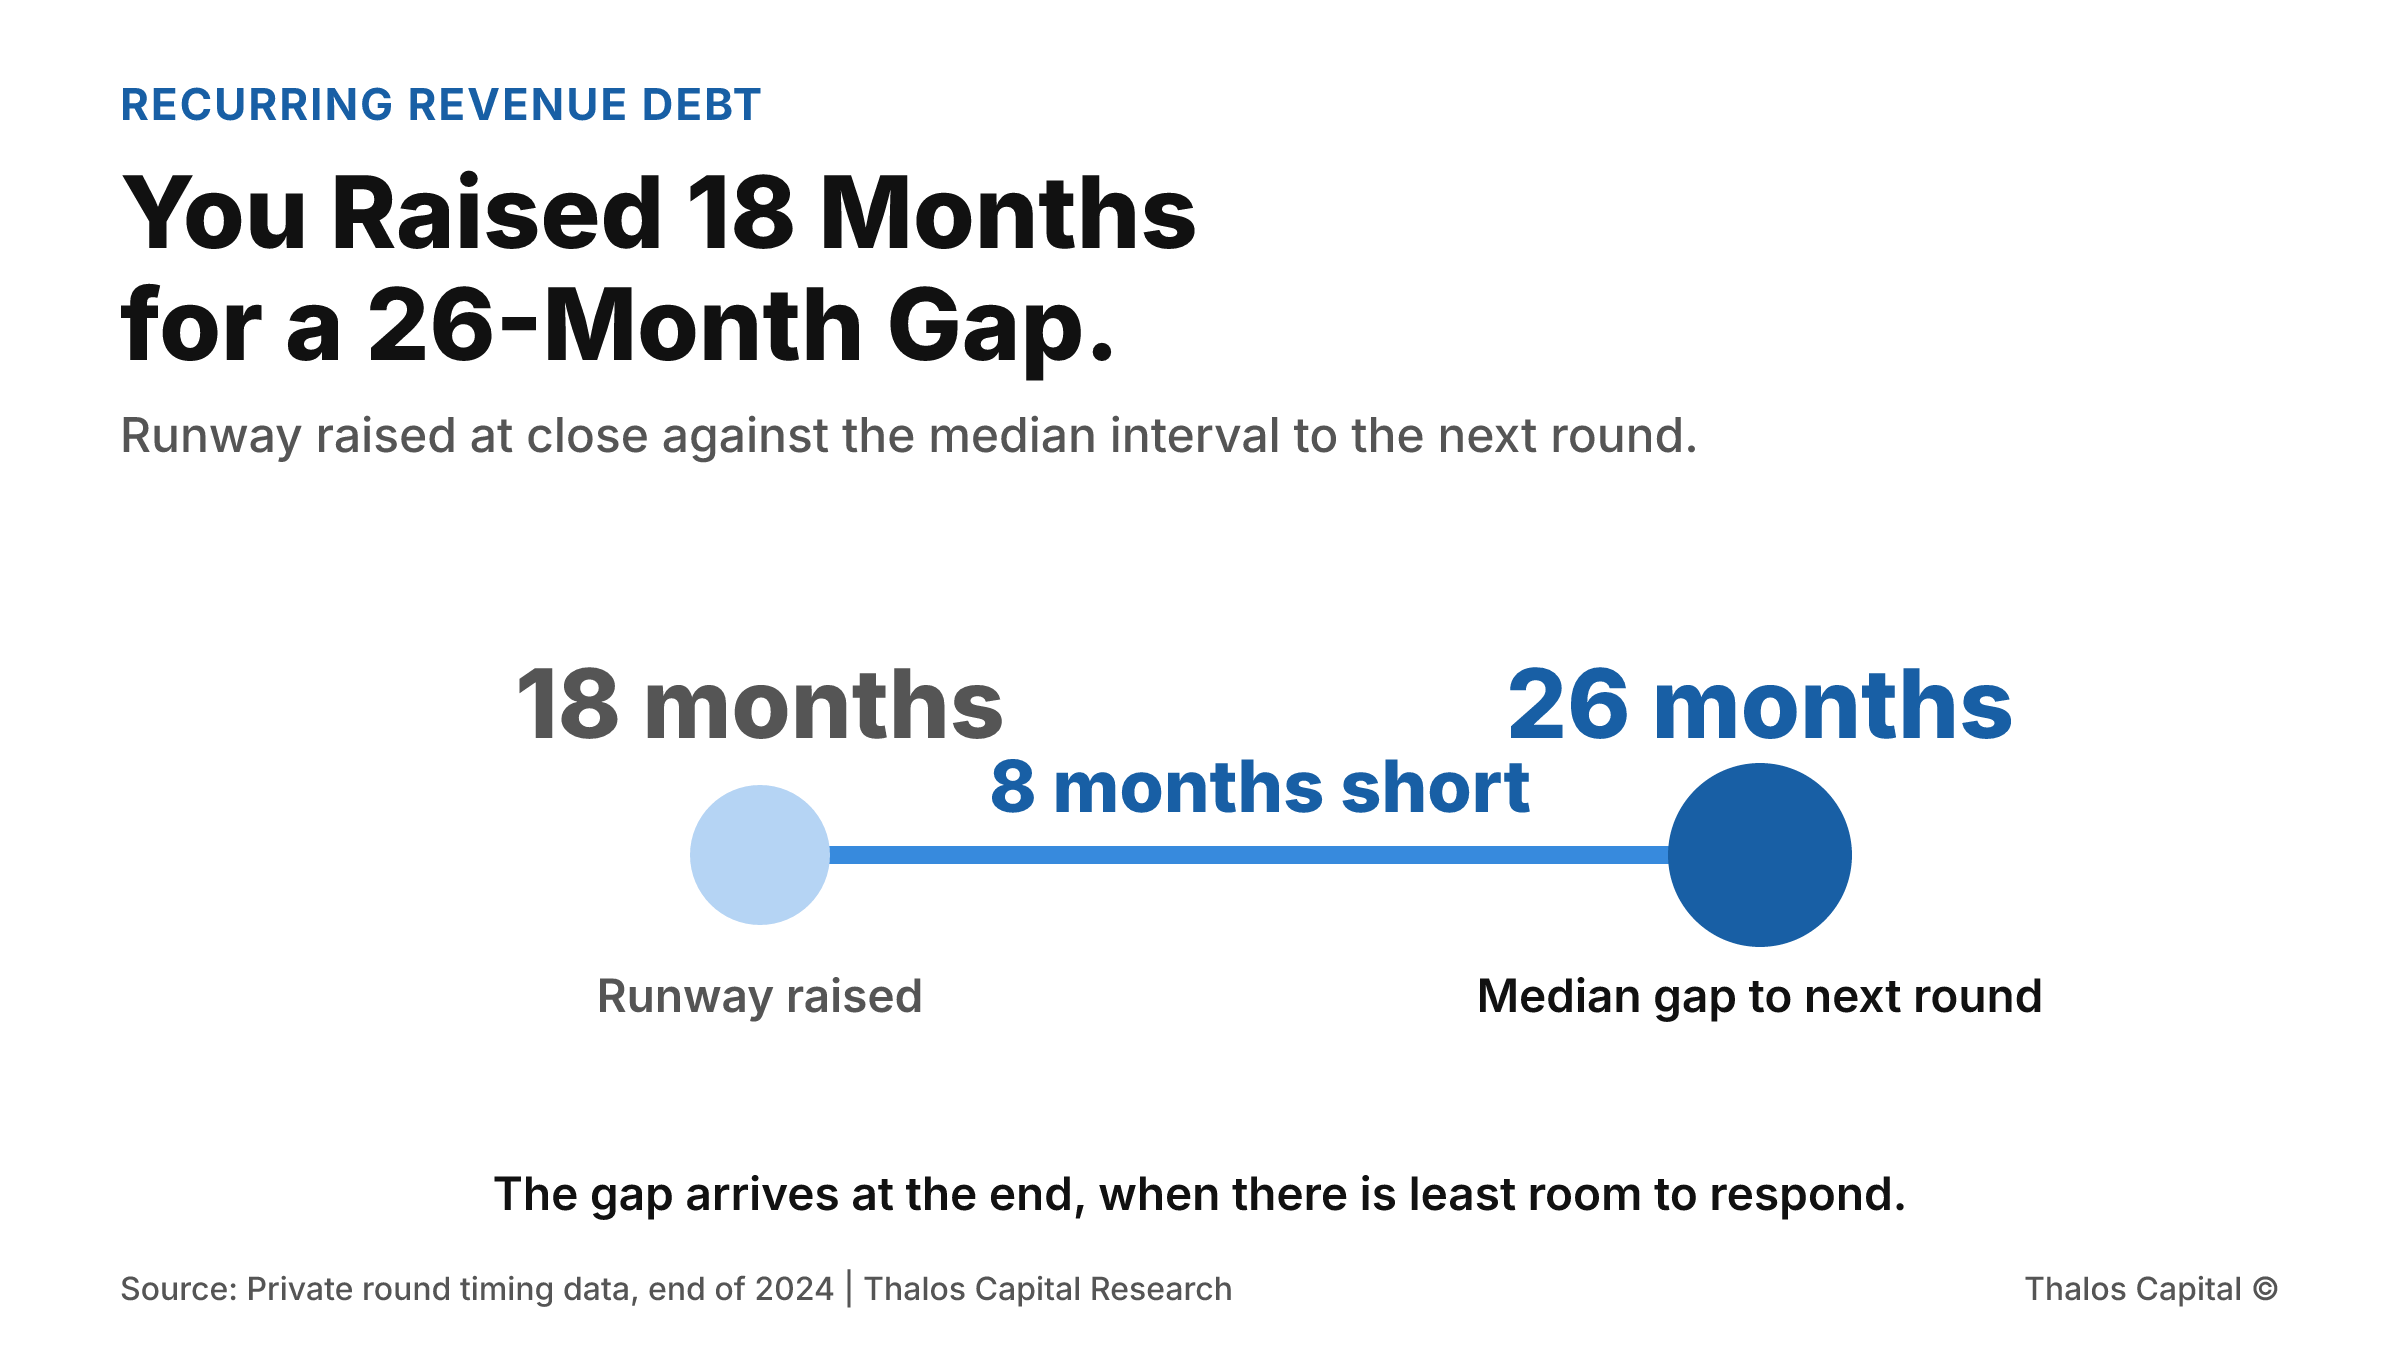
Two point range chart contrasting 18 months of runway raised at close against a median 26 month interval to the next round, with the eight month shortfall marked in navy.

You Raised 18 Months of Runway for a 26-Month Gap.

The median interval from seed to Series A has stretched to roughly 2.2 years. A company that closed with 18 months of cash is eight months short before it does anything wrong. What the decision looks like at month 10 against month 16.
Read More
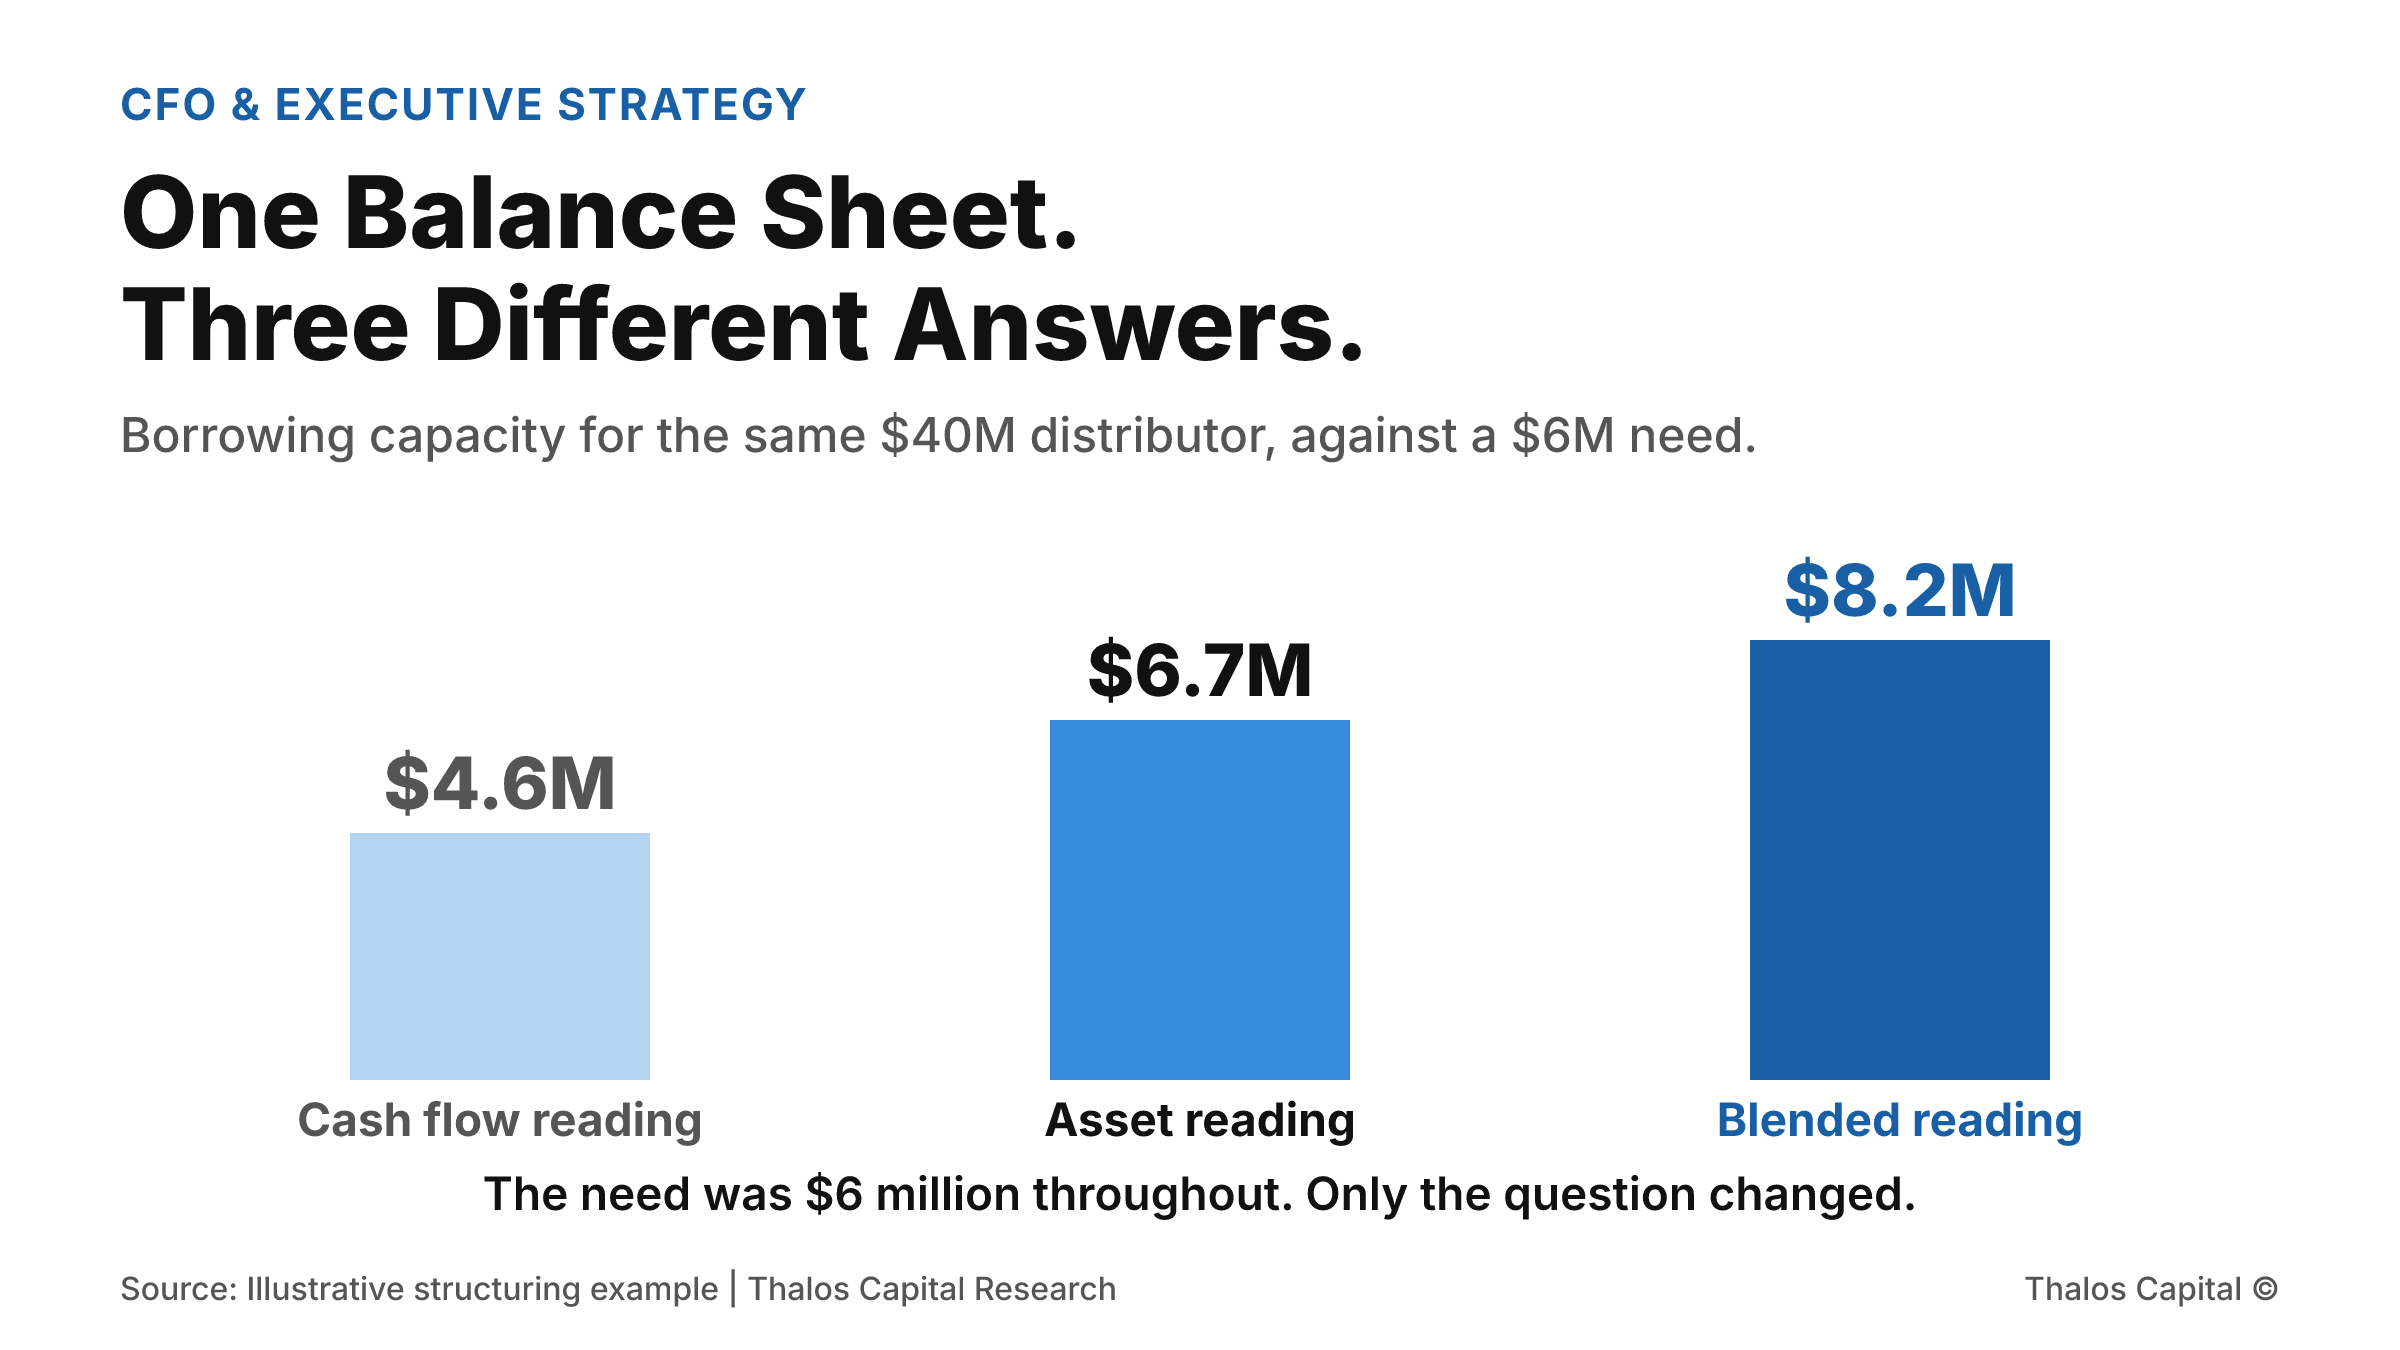
Column chart showing three borrowing capacity readings for the same distributor: $4.6 million on a cash flow reading, $6.7 million on an asset reading, and $8.2 million on a blended reading shown in the darkest navy, against a $6 million financing need.

One Balance Sheet. Three Different Answers.

A distributor doing $40 million in revenue needs $6 million. Read against cash flow it is short. Read against its assets it clears. Read as a blend it borrows $8.2 million. Same company, same week, three answers.
Read More
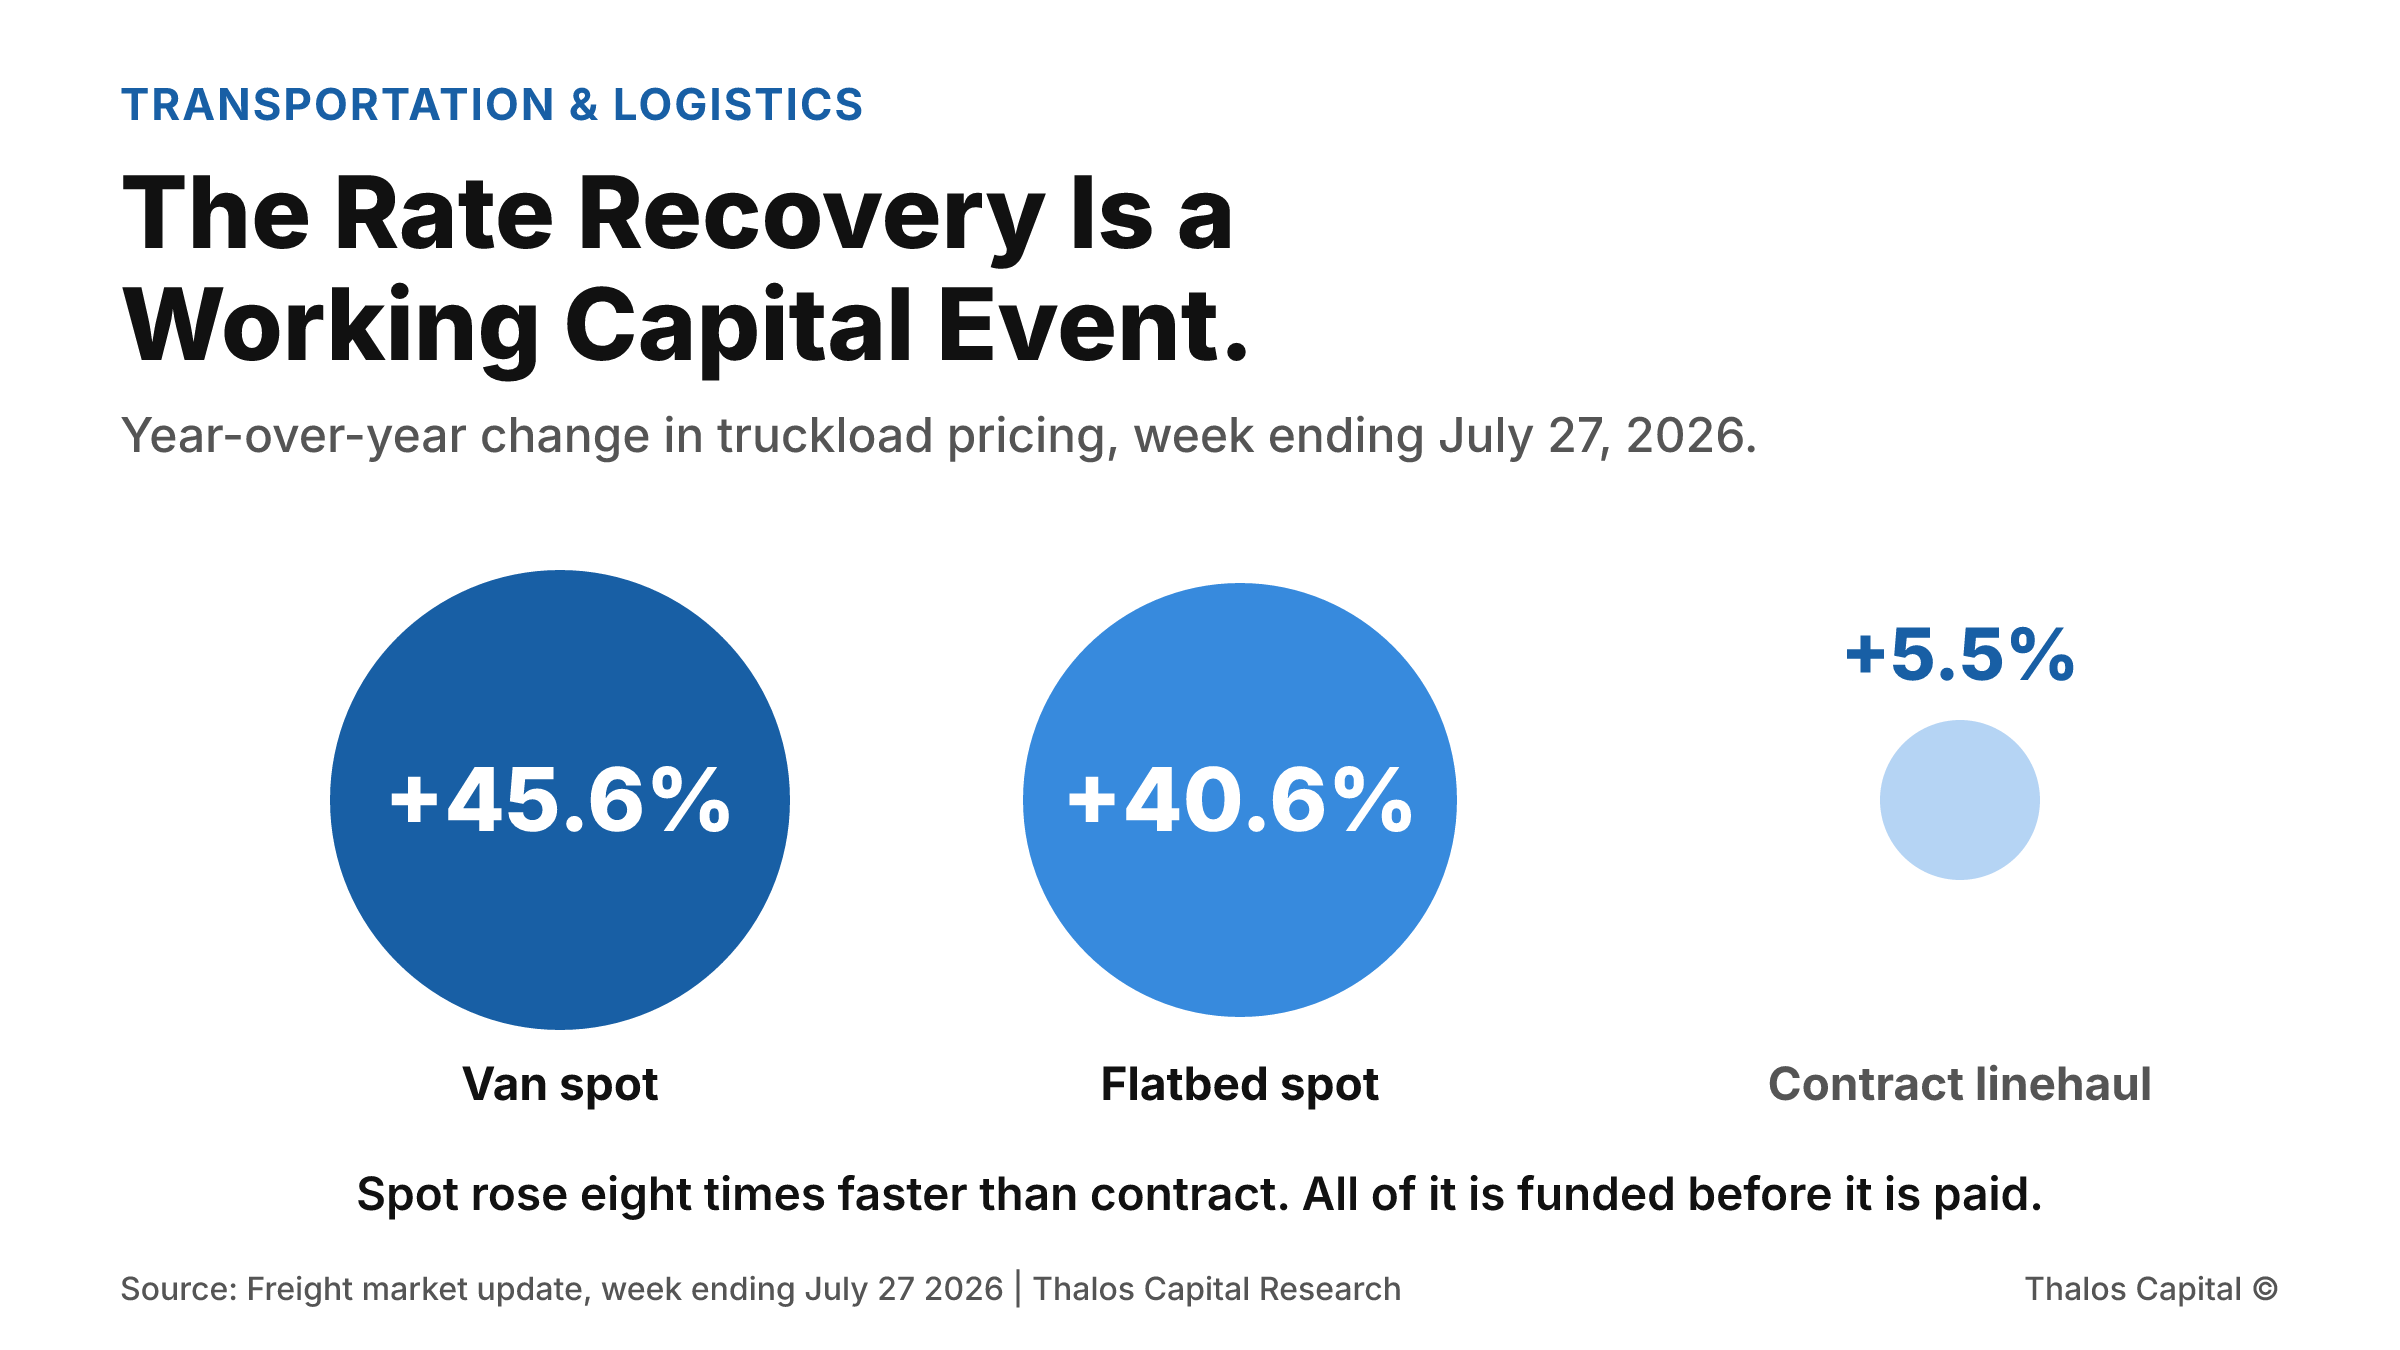
Three proportional circles comparing year-over-year price change in the week ending July 27, 2026: van spot up 45.6 percent shown as the largest navy circle, flatbed spot up 40.6 percent, and contract linehaul pricing up 5.5 percent as a much smaller pale circle.

The Rate Recovery Is a Working Capital Event.

Van spot rates ran 45.6 percent above a year ago in late July while diesel climbed 13.8 percent in four weeks. Both movements enlarge the cash a carrier funds before it gets paid. Why a better freight market consumes capital.
Read More
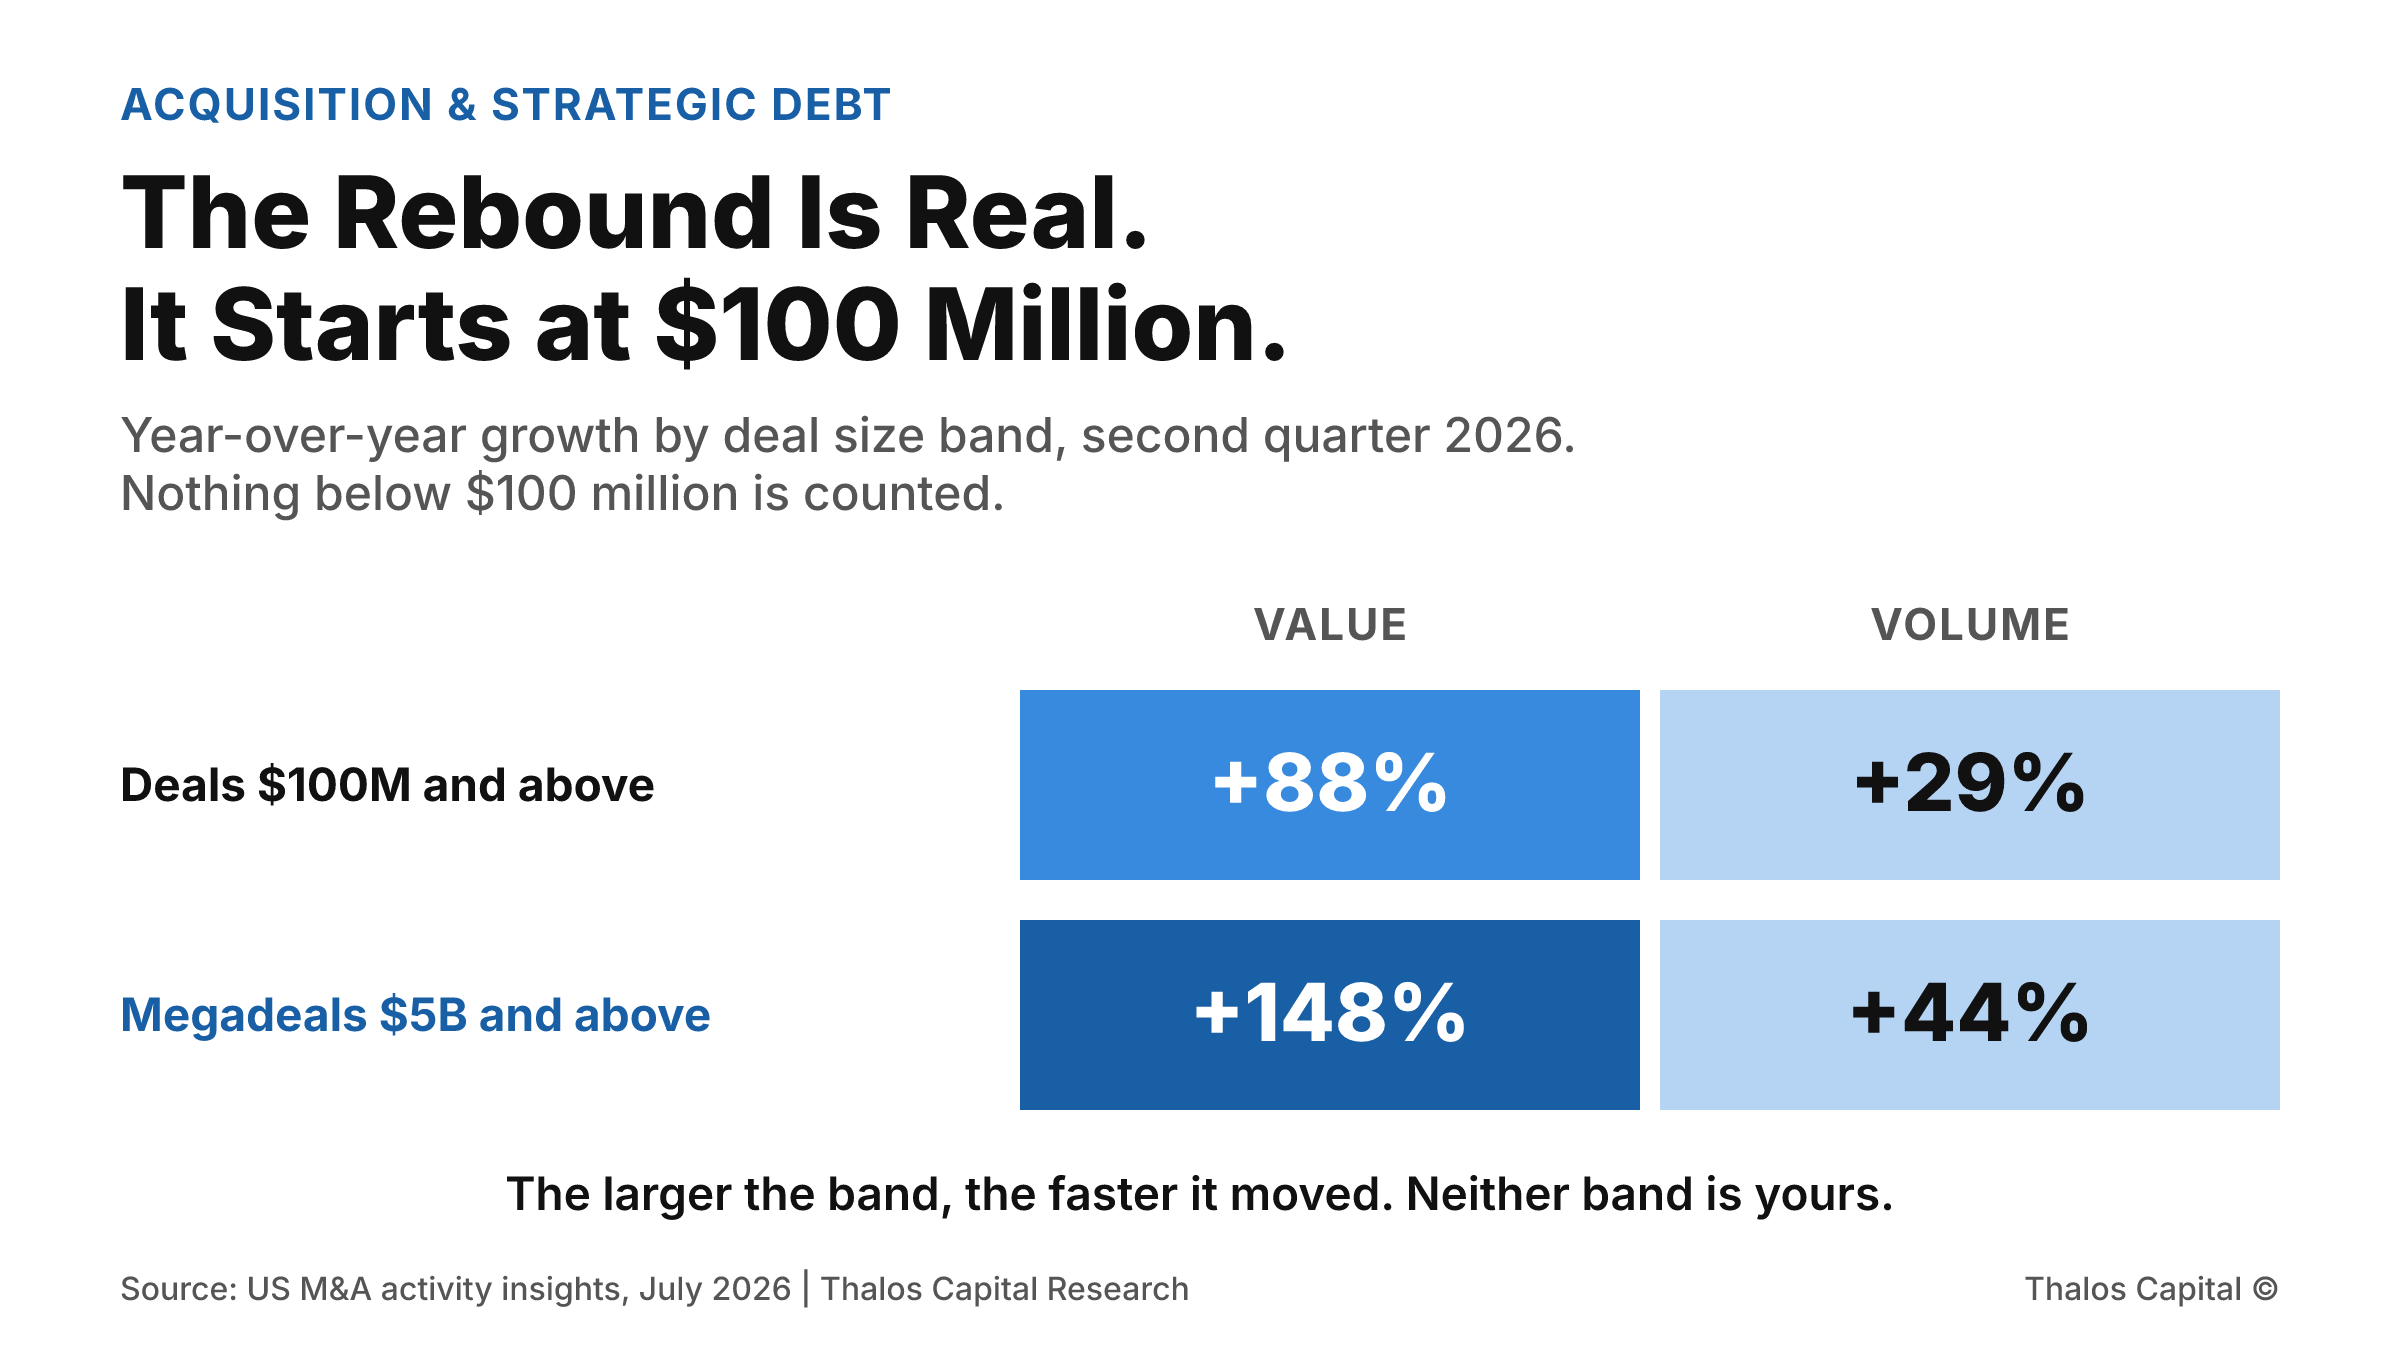
Shaded grid comparing year-over-year growth in the second quarter of 2026 for two deal size bands: transactions of $100 million or more grew 88 percent in value and 29 percent in volume, while megadeals of $5 billion or more grew 148 percent in value and 44 percent in volume, with the 148 percent figure shown in the darkest navy.

The Rebound Is Real. It Starts at $100 Million.

Second-quarter deals of $100 million or more rose 88 percent in value and 29 percent in volume, and the data that reports it does not count anything smaller. What that means for a buyer working a $5 to $50 million acquisition.
Read More
Working through a financing decision?
Insights are a starting point. A conversation maps your actual options.
Tell us what you are financing and we will map the structures and sources that fit.
Submit your financing request →
Explore our financing solutions
Equipment FinancingWorking CapitalAsset-Based LendingStrategic Debt