Tag

working capital

13 insights

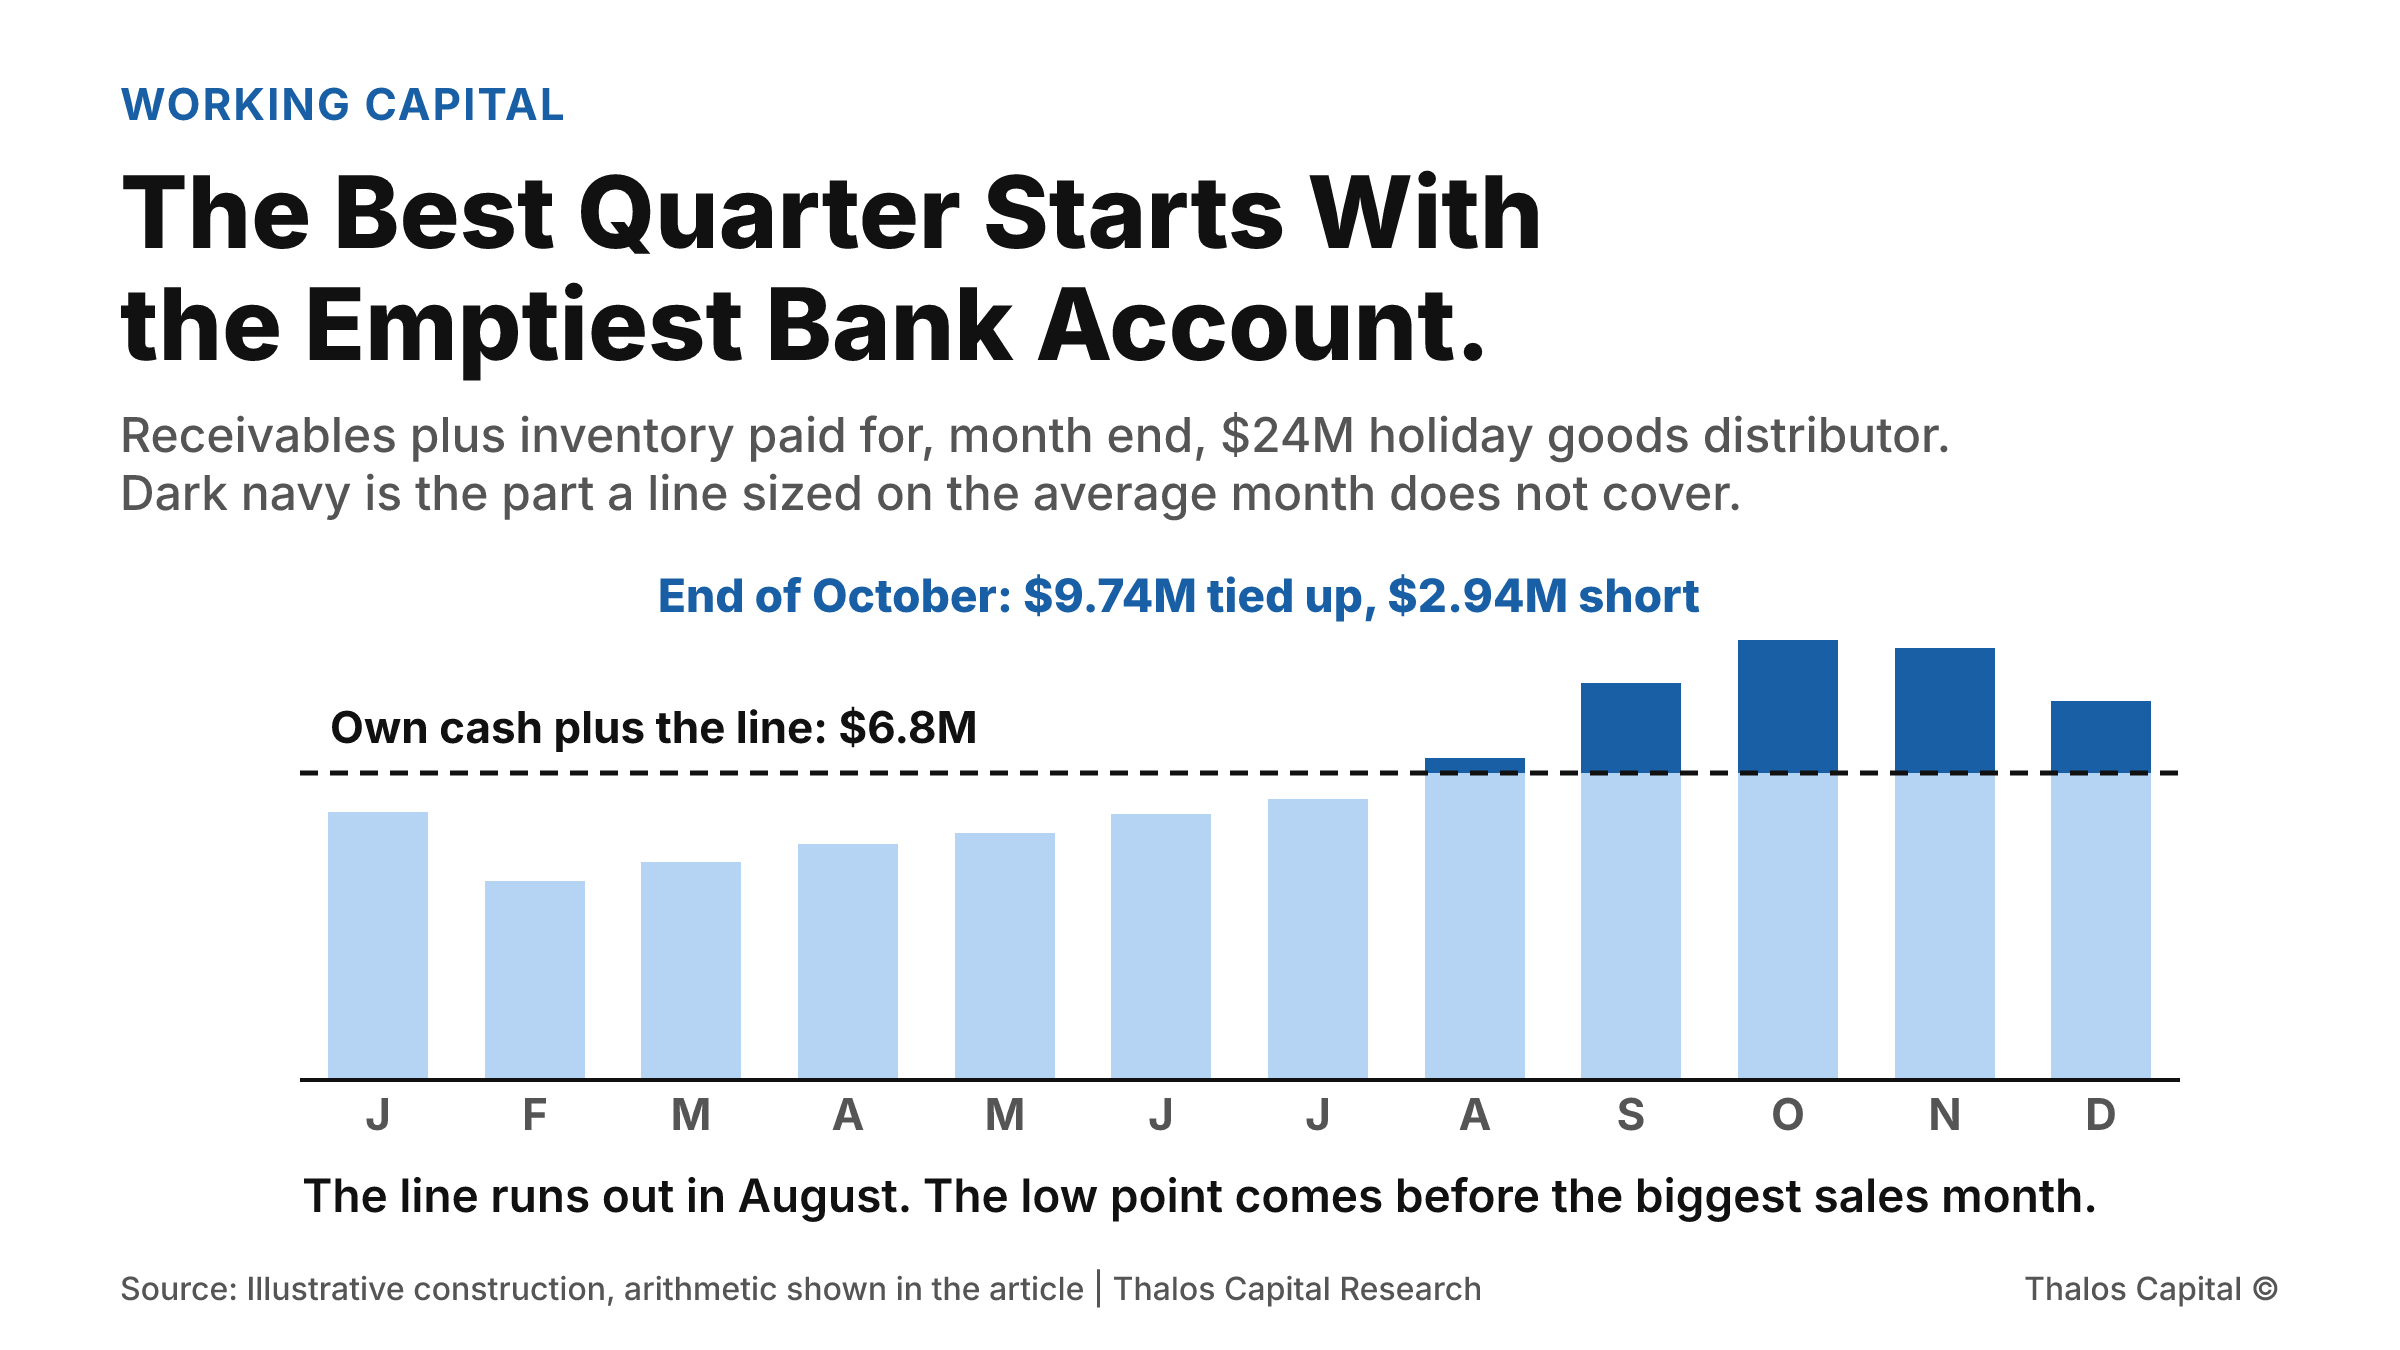
Twelve monthly columns of working capital tied up at a $24 million holiday goods distributor. Months January to July sit below the $6.8 million covered by the owner's cash and a line sized on the average month. August to December rise above it, peaking at $9.74 million at the end of October, $2.94 million short.

The Best Quarter Starts With the Emptiest Bank Account

A $24 million holiday goods distributor ties up $9.74 million in receivables and inventory at the end of October, against $6.8 million on an average month. A credit line sized on the average runs out in August and is $2.94 million short at the peak.
Read More
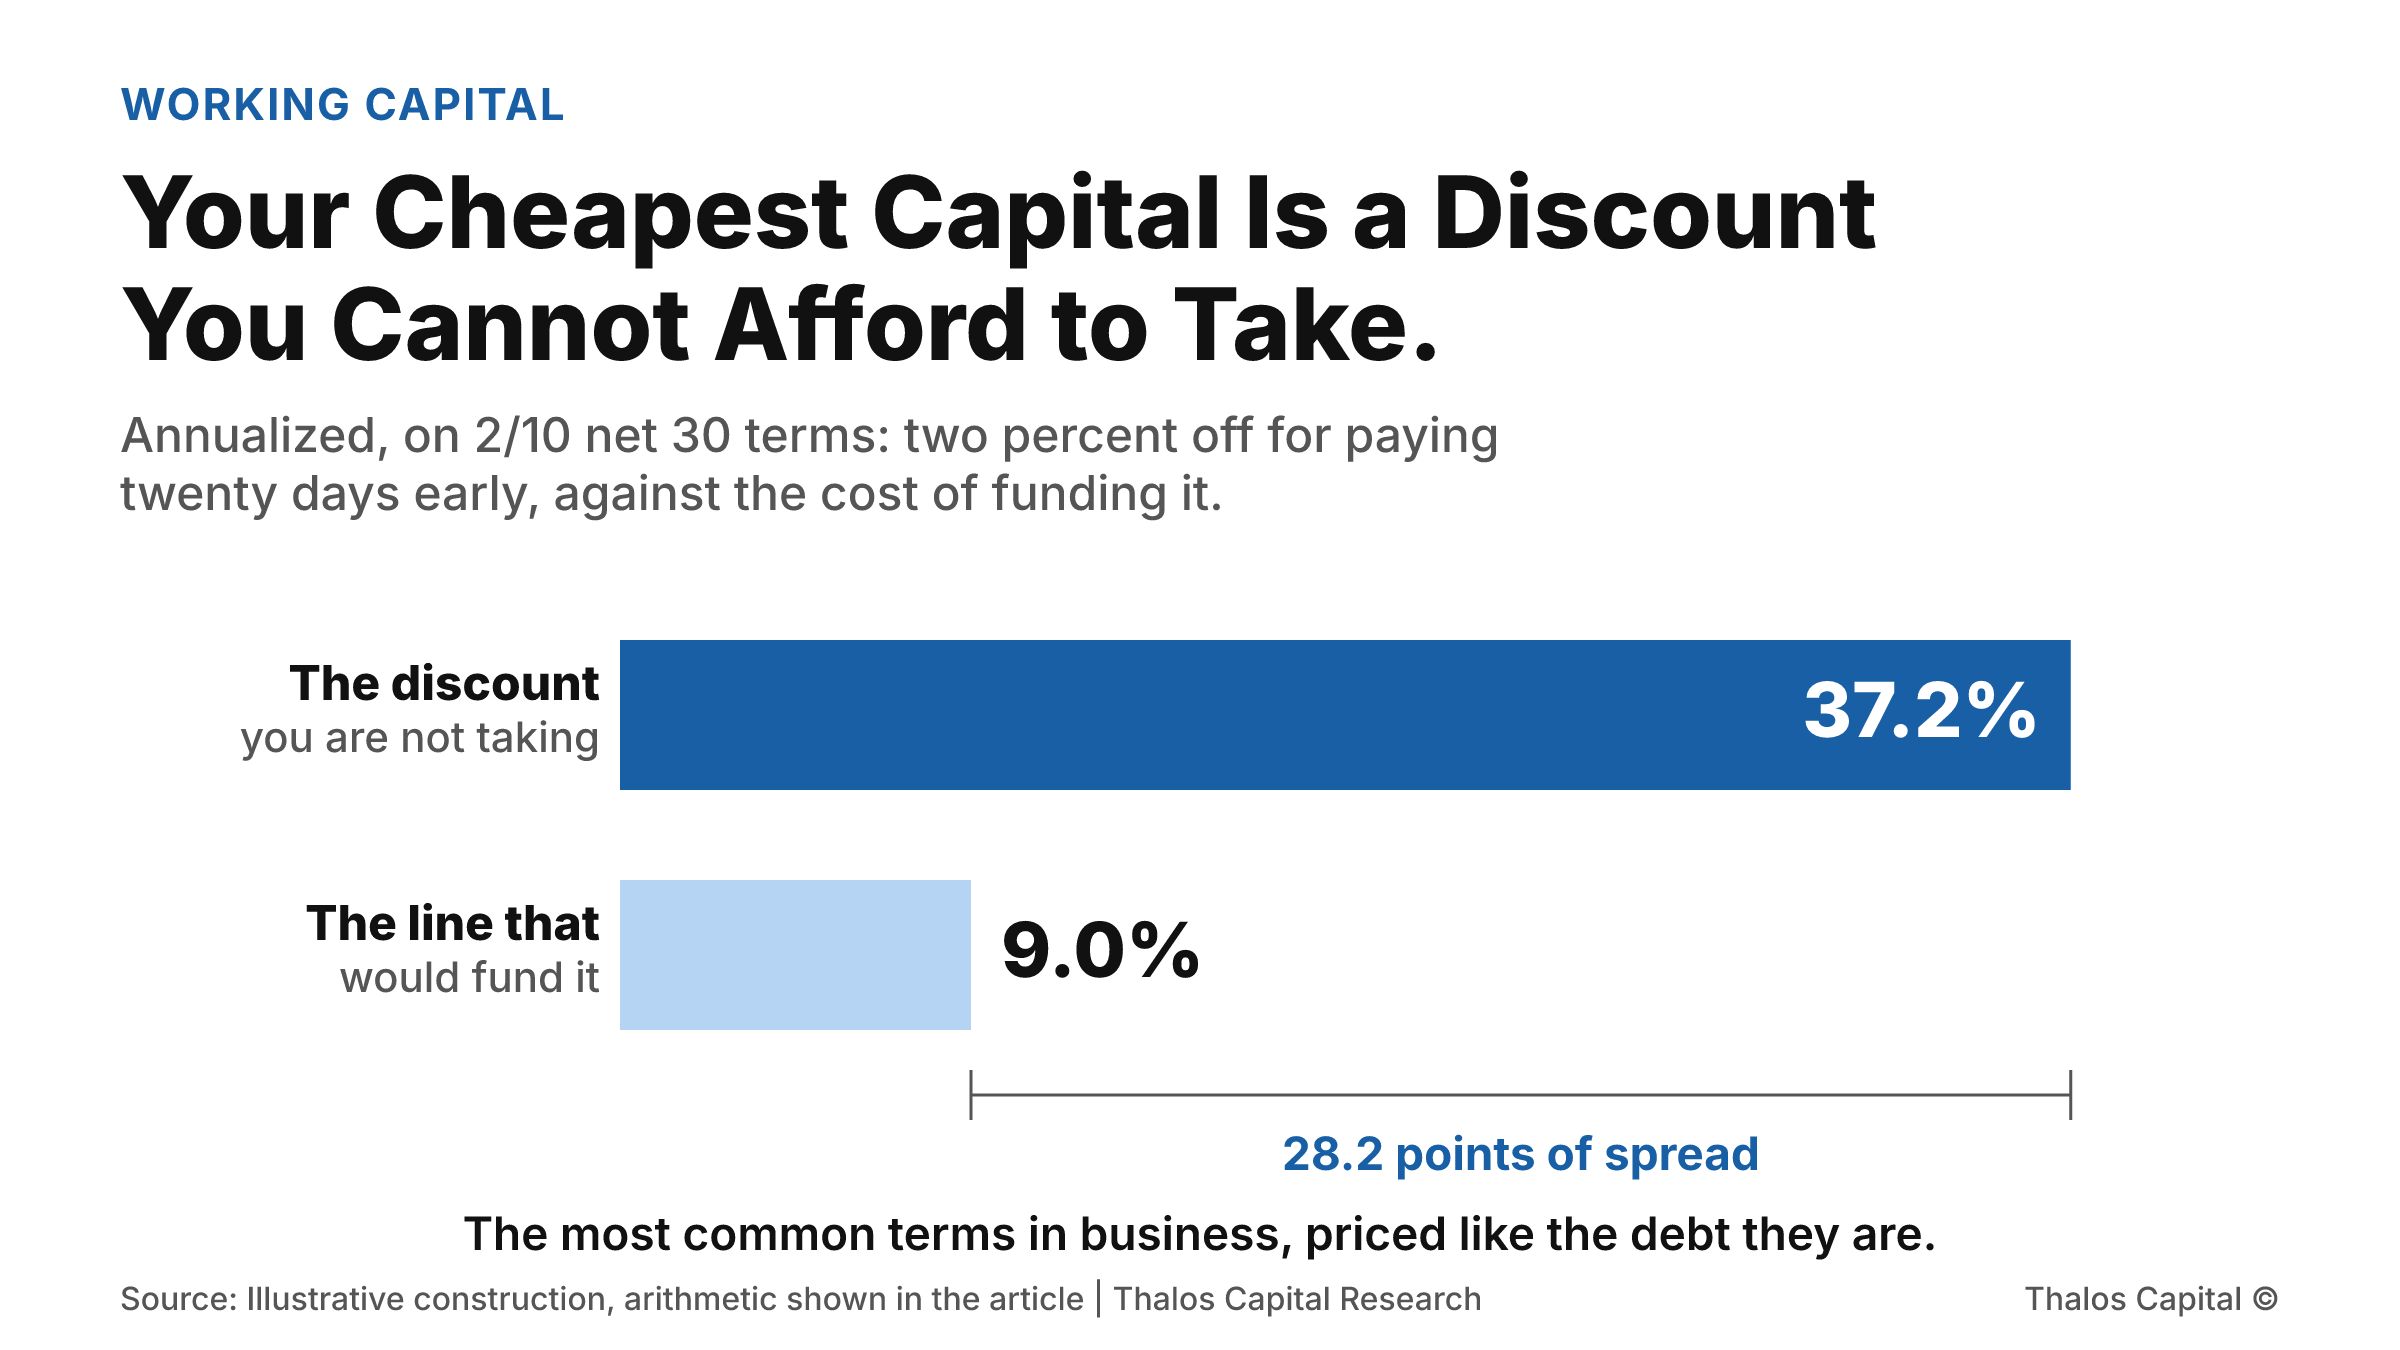
Two horizontal bars comparing the annualized value of a 2/10 net 30 early payment discount at 37.2 percent against the roughly 9 percent all-in cost of a working capital line used to fund it, a spread of 28.2 points.

Your Cheapest Capital Is a Discount You Cannot Afford to Take.

Customers moved from net 30 to net 60, which tied up an extra $1.08 million. The consequence shows up on the other side of the business, where $162,000 of supplier discounts go unclaimed every year because the cash is not there.
Read More
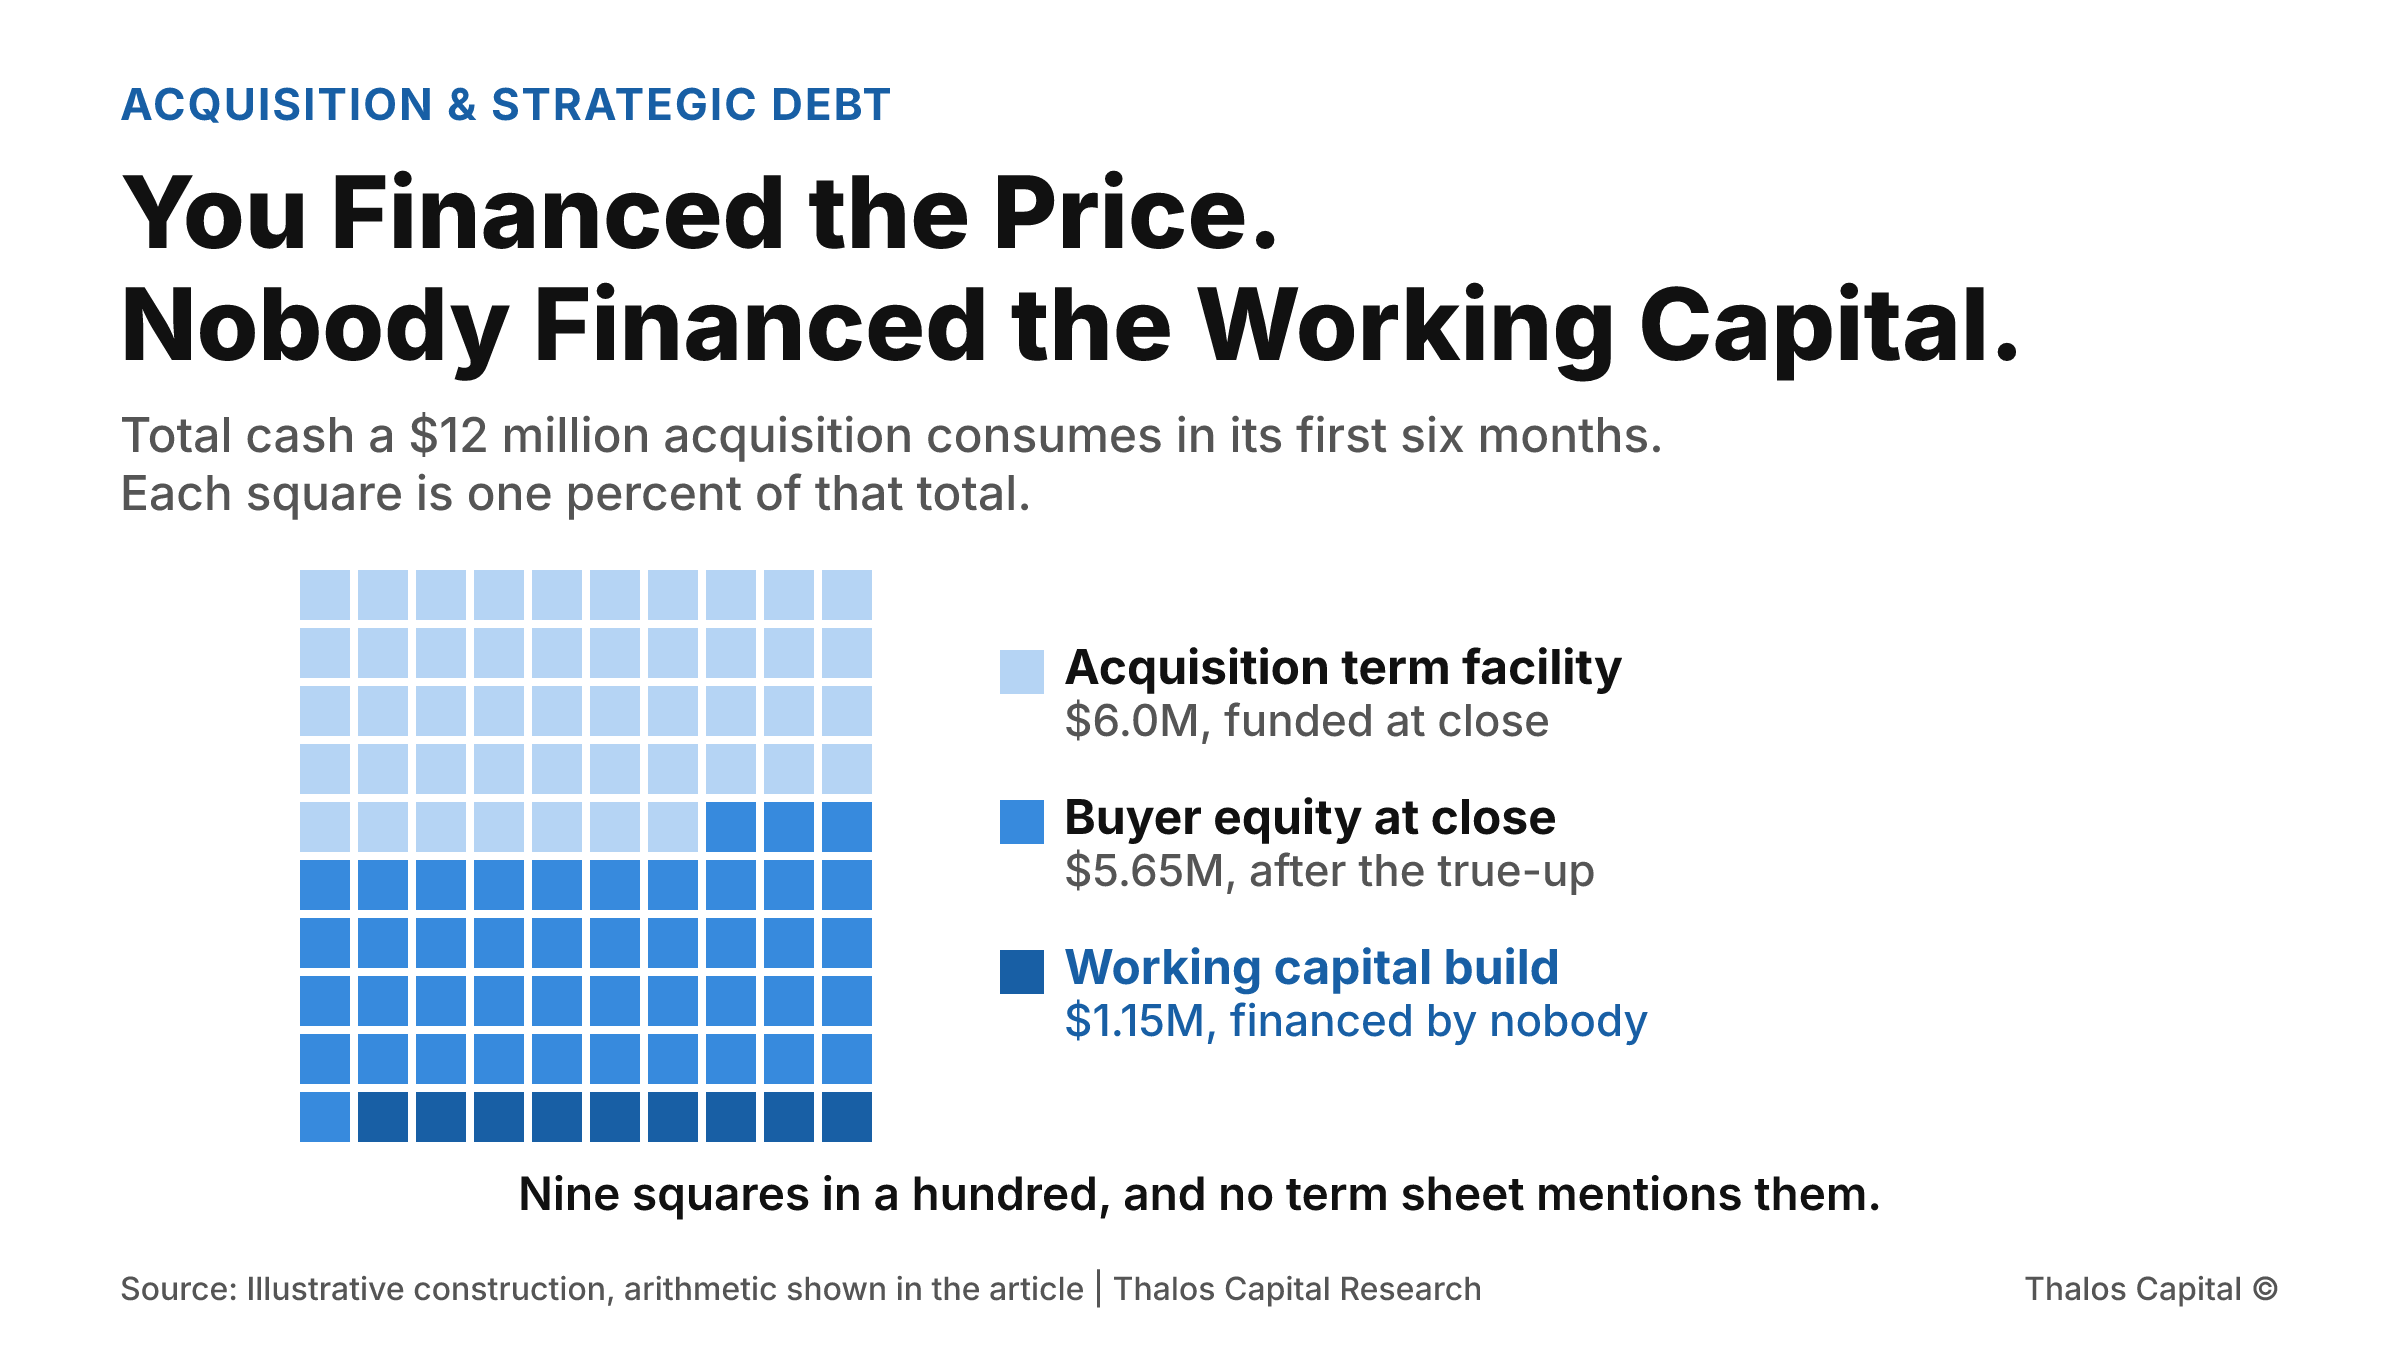
A hundred-square waffle showing the total cash a $12 million acquisition consumes in its first six months: 47 squares funded by the acquisition term facility, 44 by buyer equity at close, and 9 by a working capital build that sits outside the deal model.

You Financed the Price. Nobody Financed the Working Capital.

A buyer models an acquisition as price minus debt equals equity. Then the working capital true-up lands, and the seasonal build after it. The cash required is the same whichever month the deal closes, and the acquisition facility funds none of it.
Read More
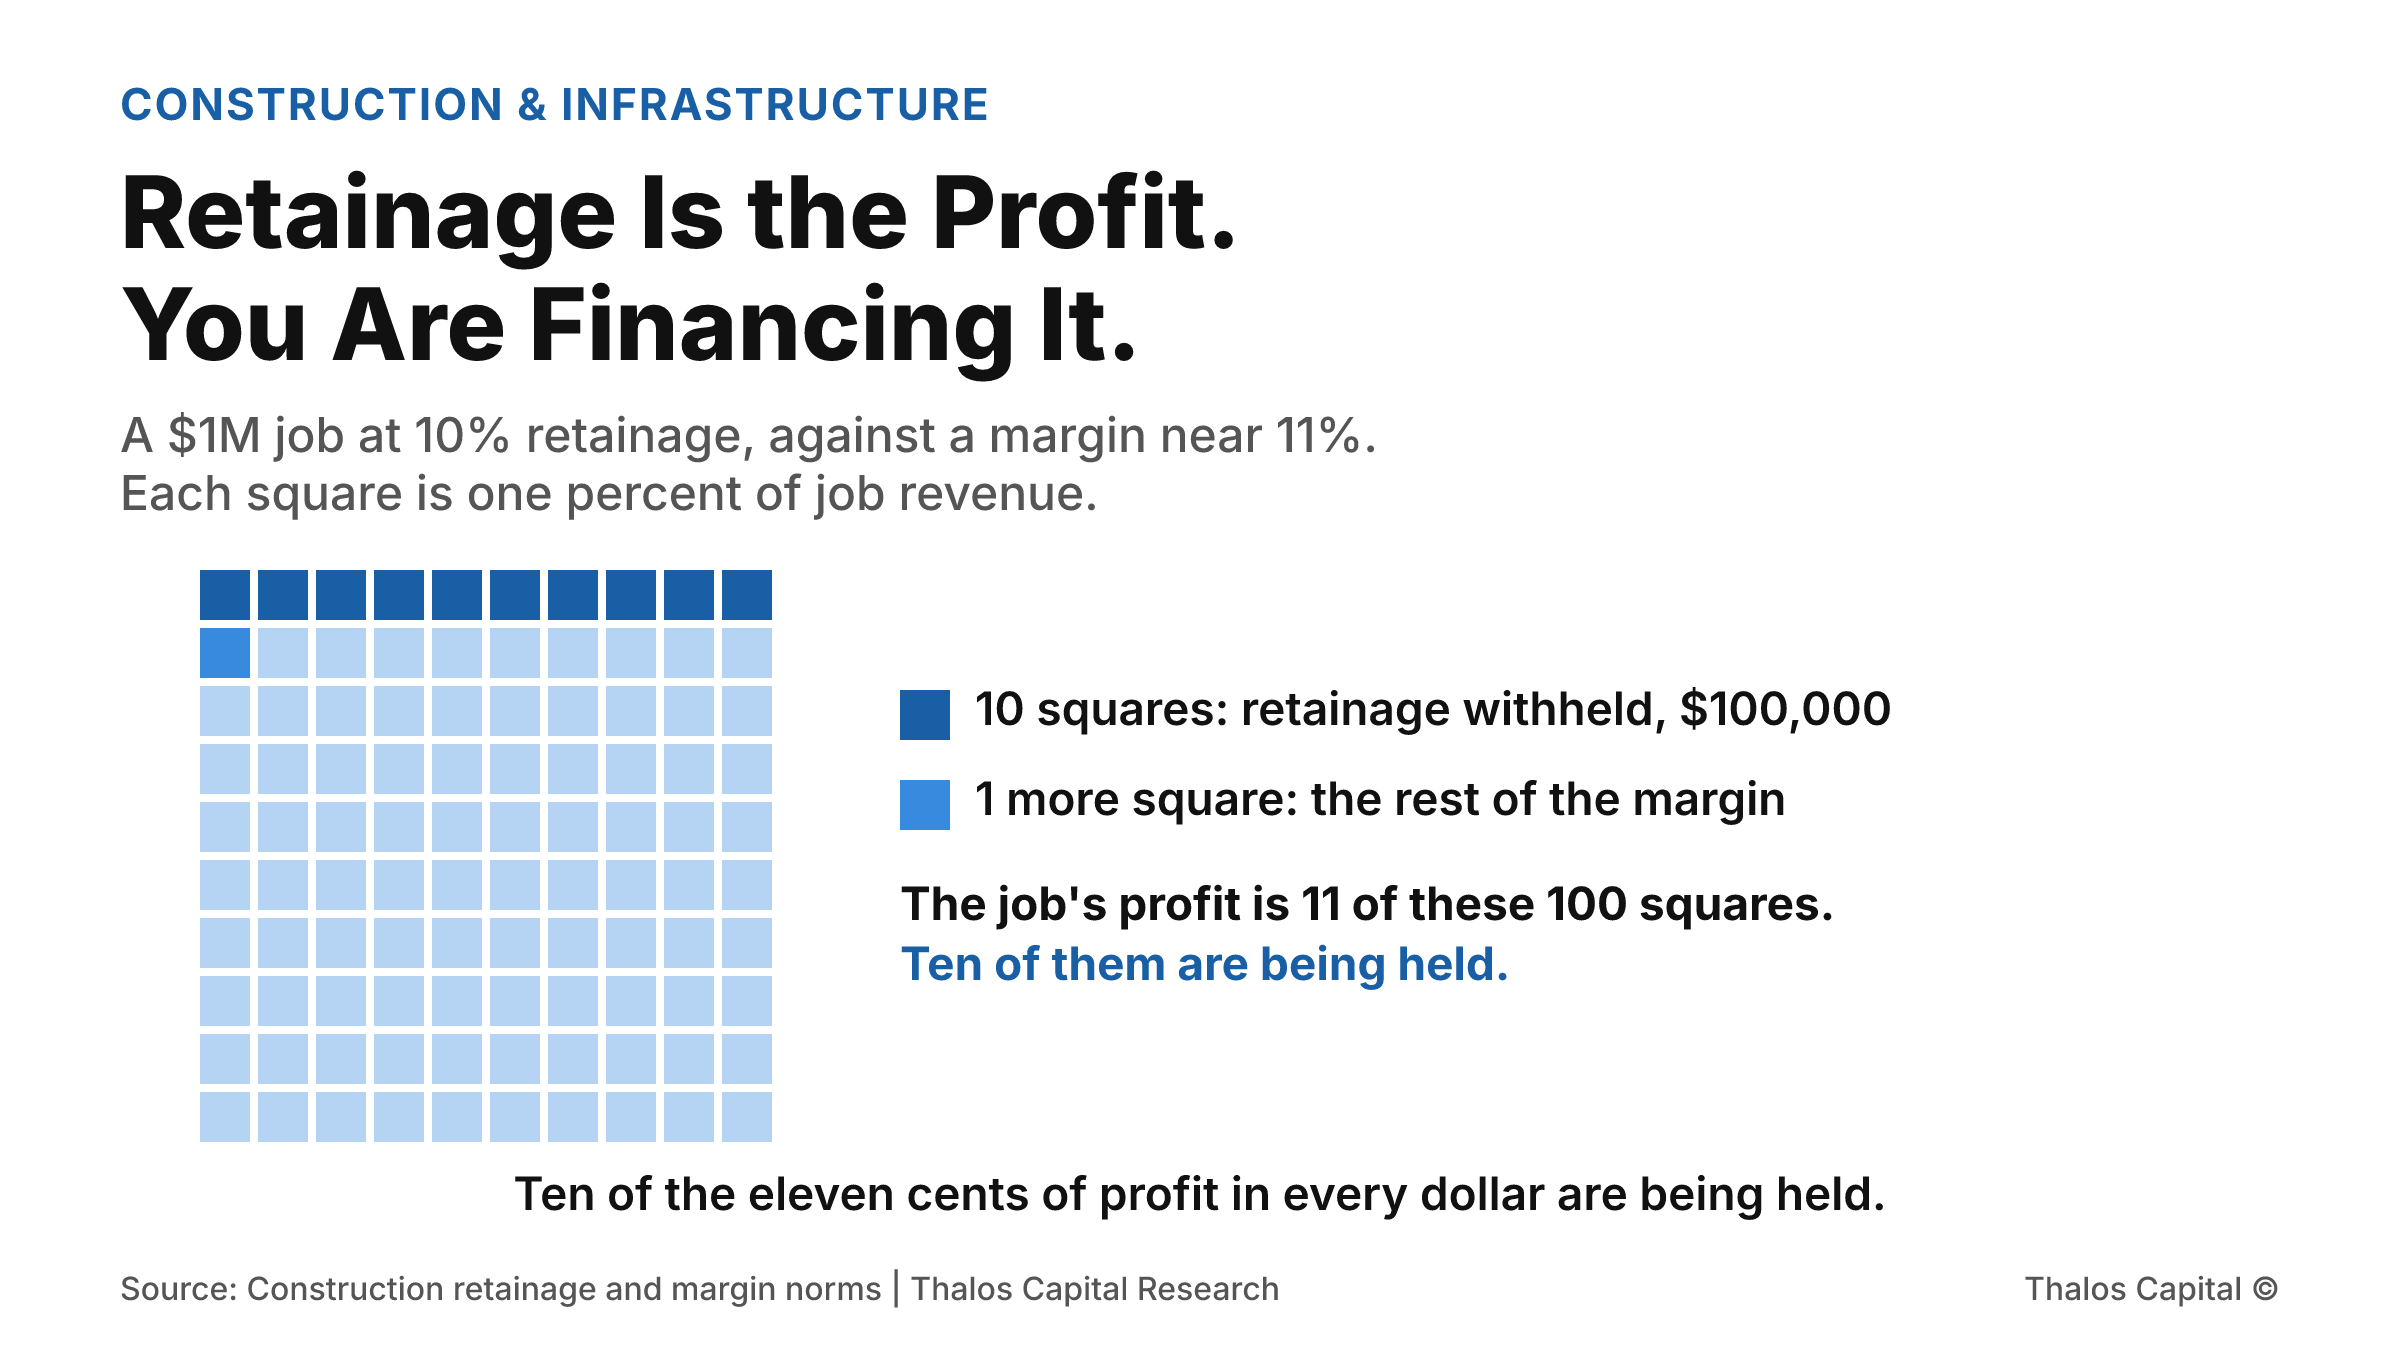
Waffle grid of 100 squares representing a $1 million job. Ten squares in dark navy show the $100,000 withheld as retainage and one further square in mid blue completes the roughly 11 percent margin, so ten of the eleven profit squares are being held.

Retainage Is the Profit. You Are Financing It.

A ten-month job billing $100,000 a month withholds $100,000 by closeout. At builder margins near 11 percent that is almost the entire profit on the job, and a standard receivables facility gives you nothing against it.
Read More
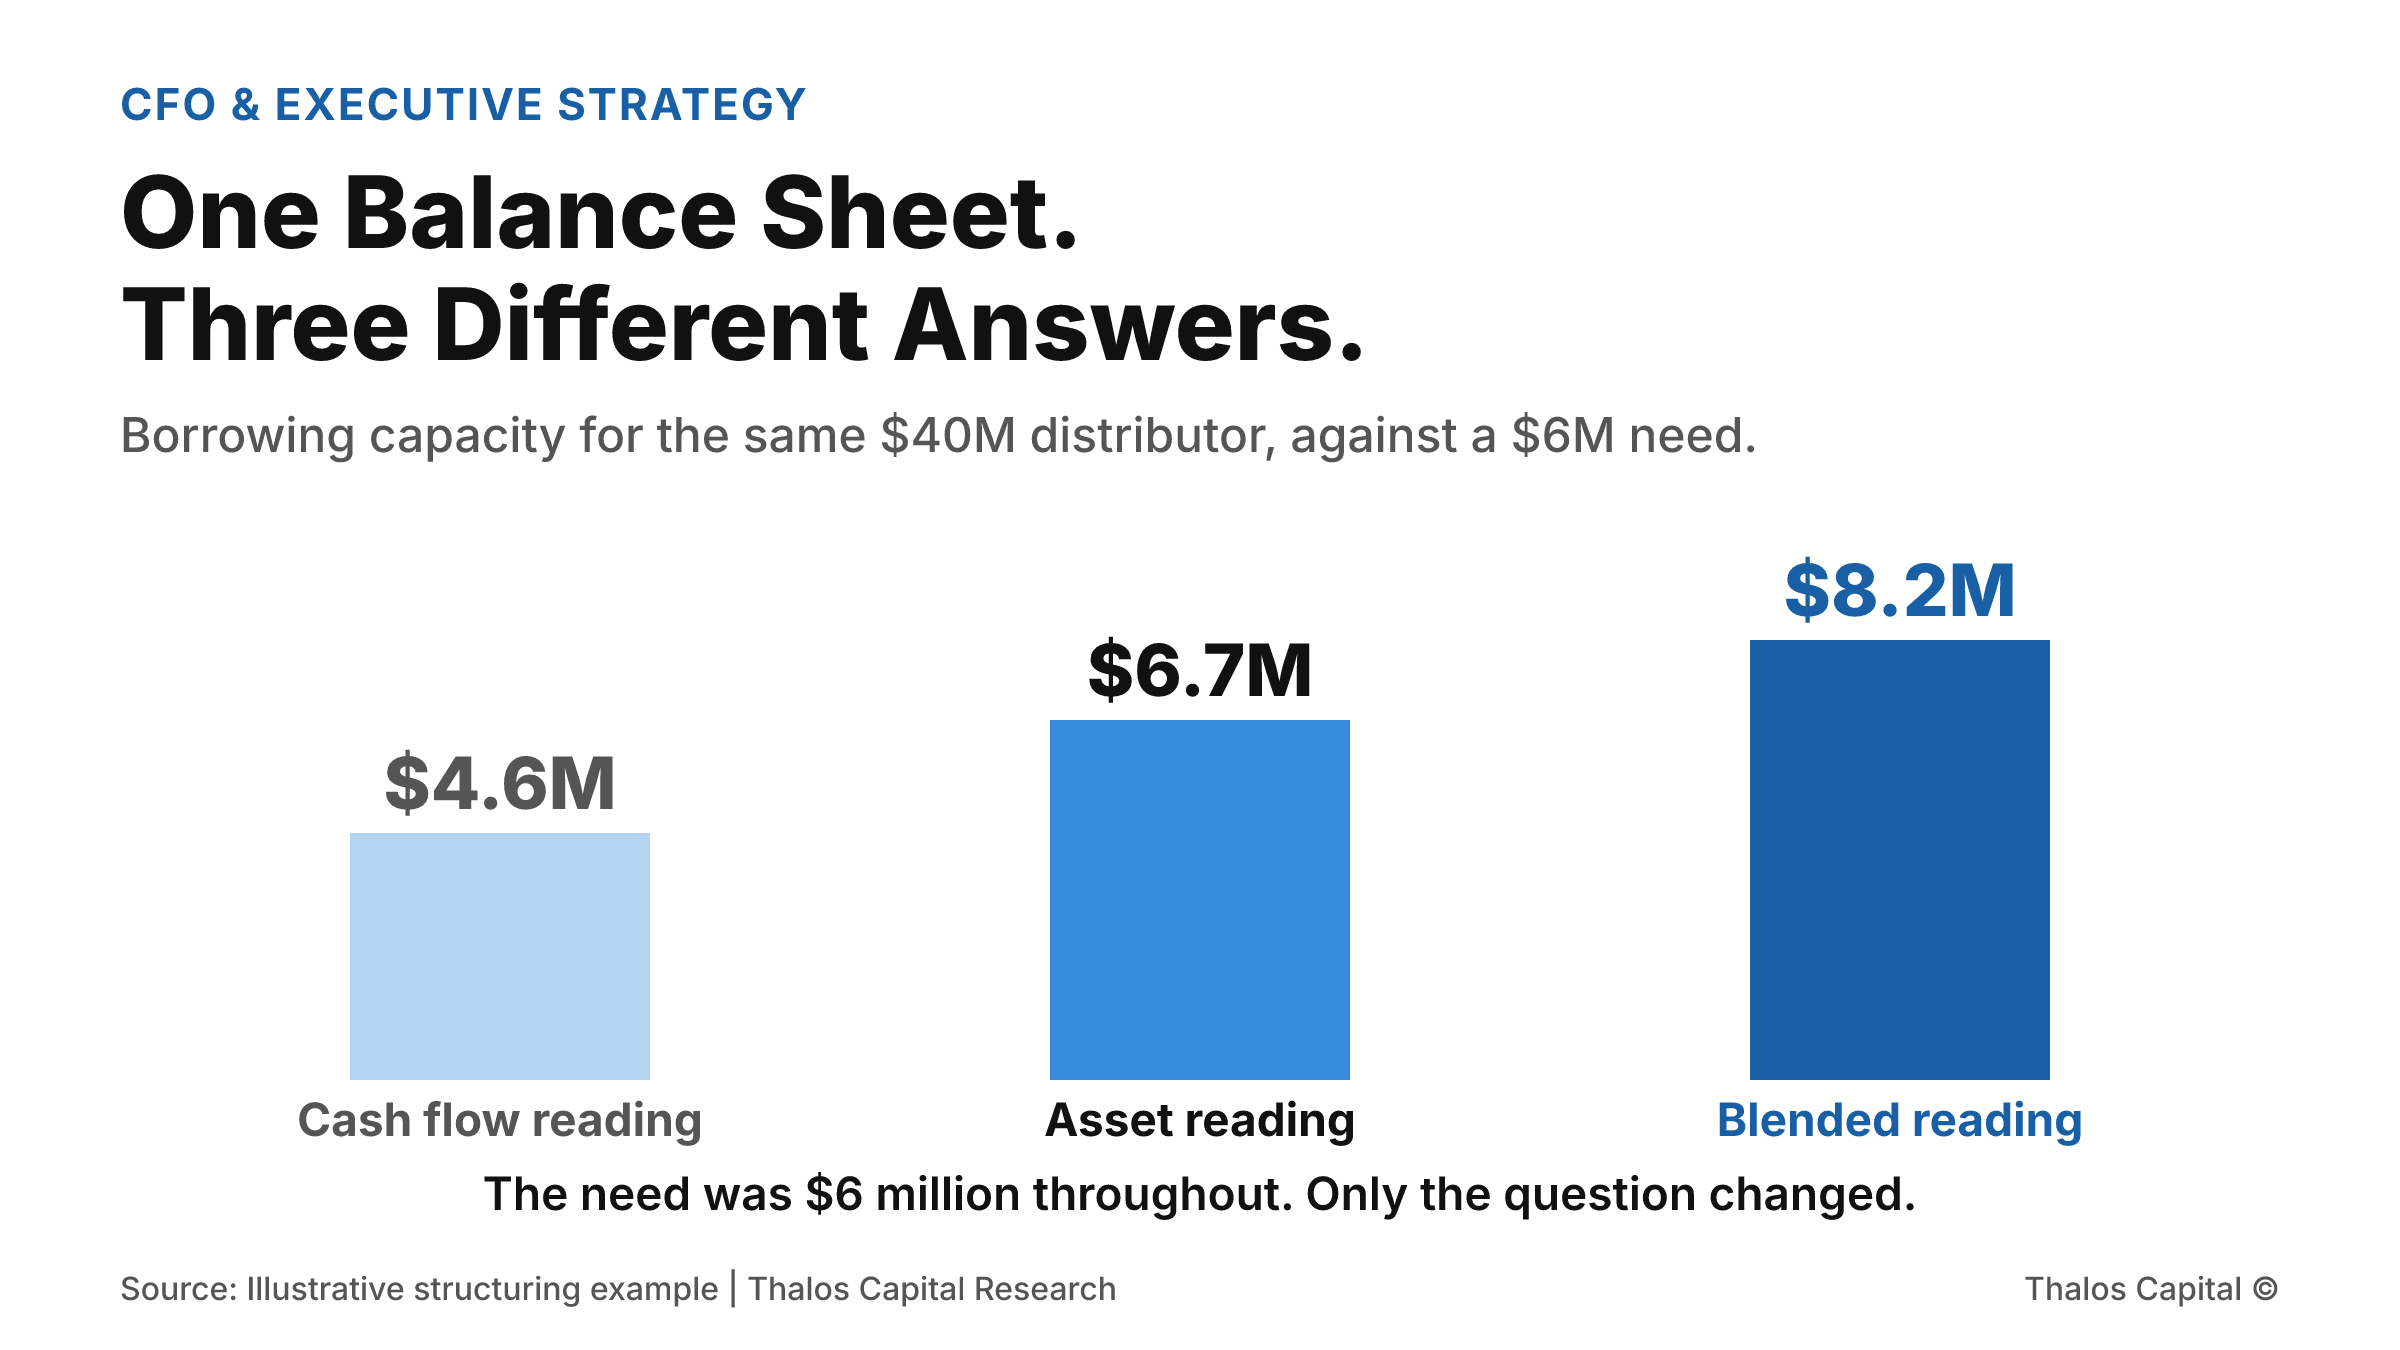
Column chart showing three borrowing capacity readings for the same distributor: $4.6 million on a cash flow reading, $6.7 million on an asset reading, and $8.2 million on a blended reading shown in the darkest navy, against a $6 million financing need.

One Balance Sheet. Three Different Answers.

A distributor doing $40 million in revenue needs $6 million. Read against cash flow it is short. Read against its assets it clears. Read as a blend it borrows $8.2 million. Same company, same week, three answers.
Read More
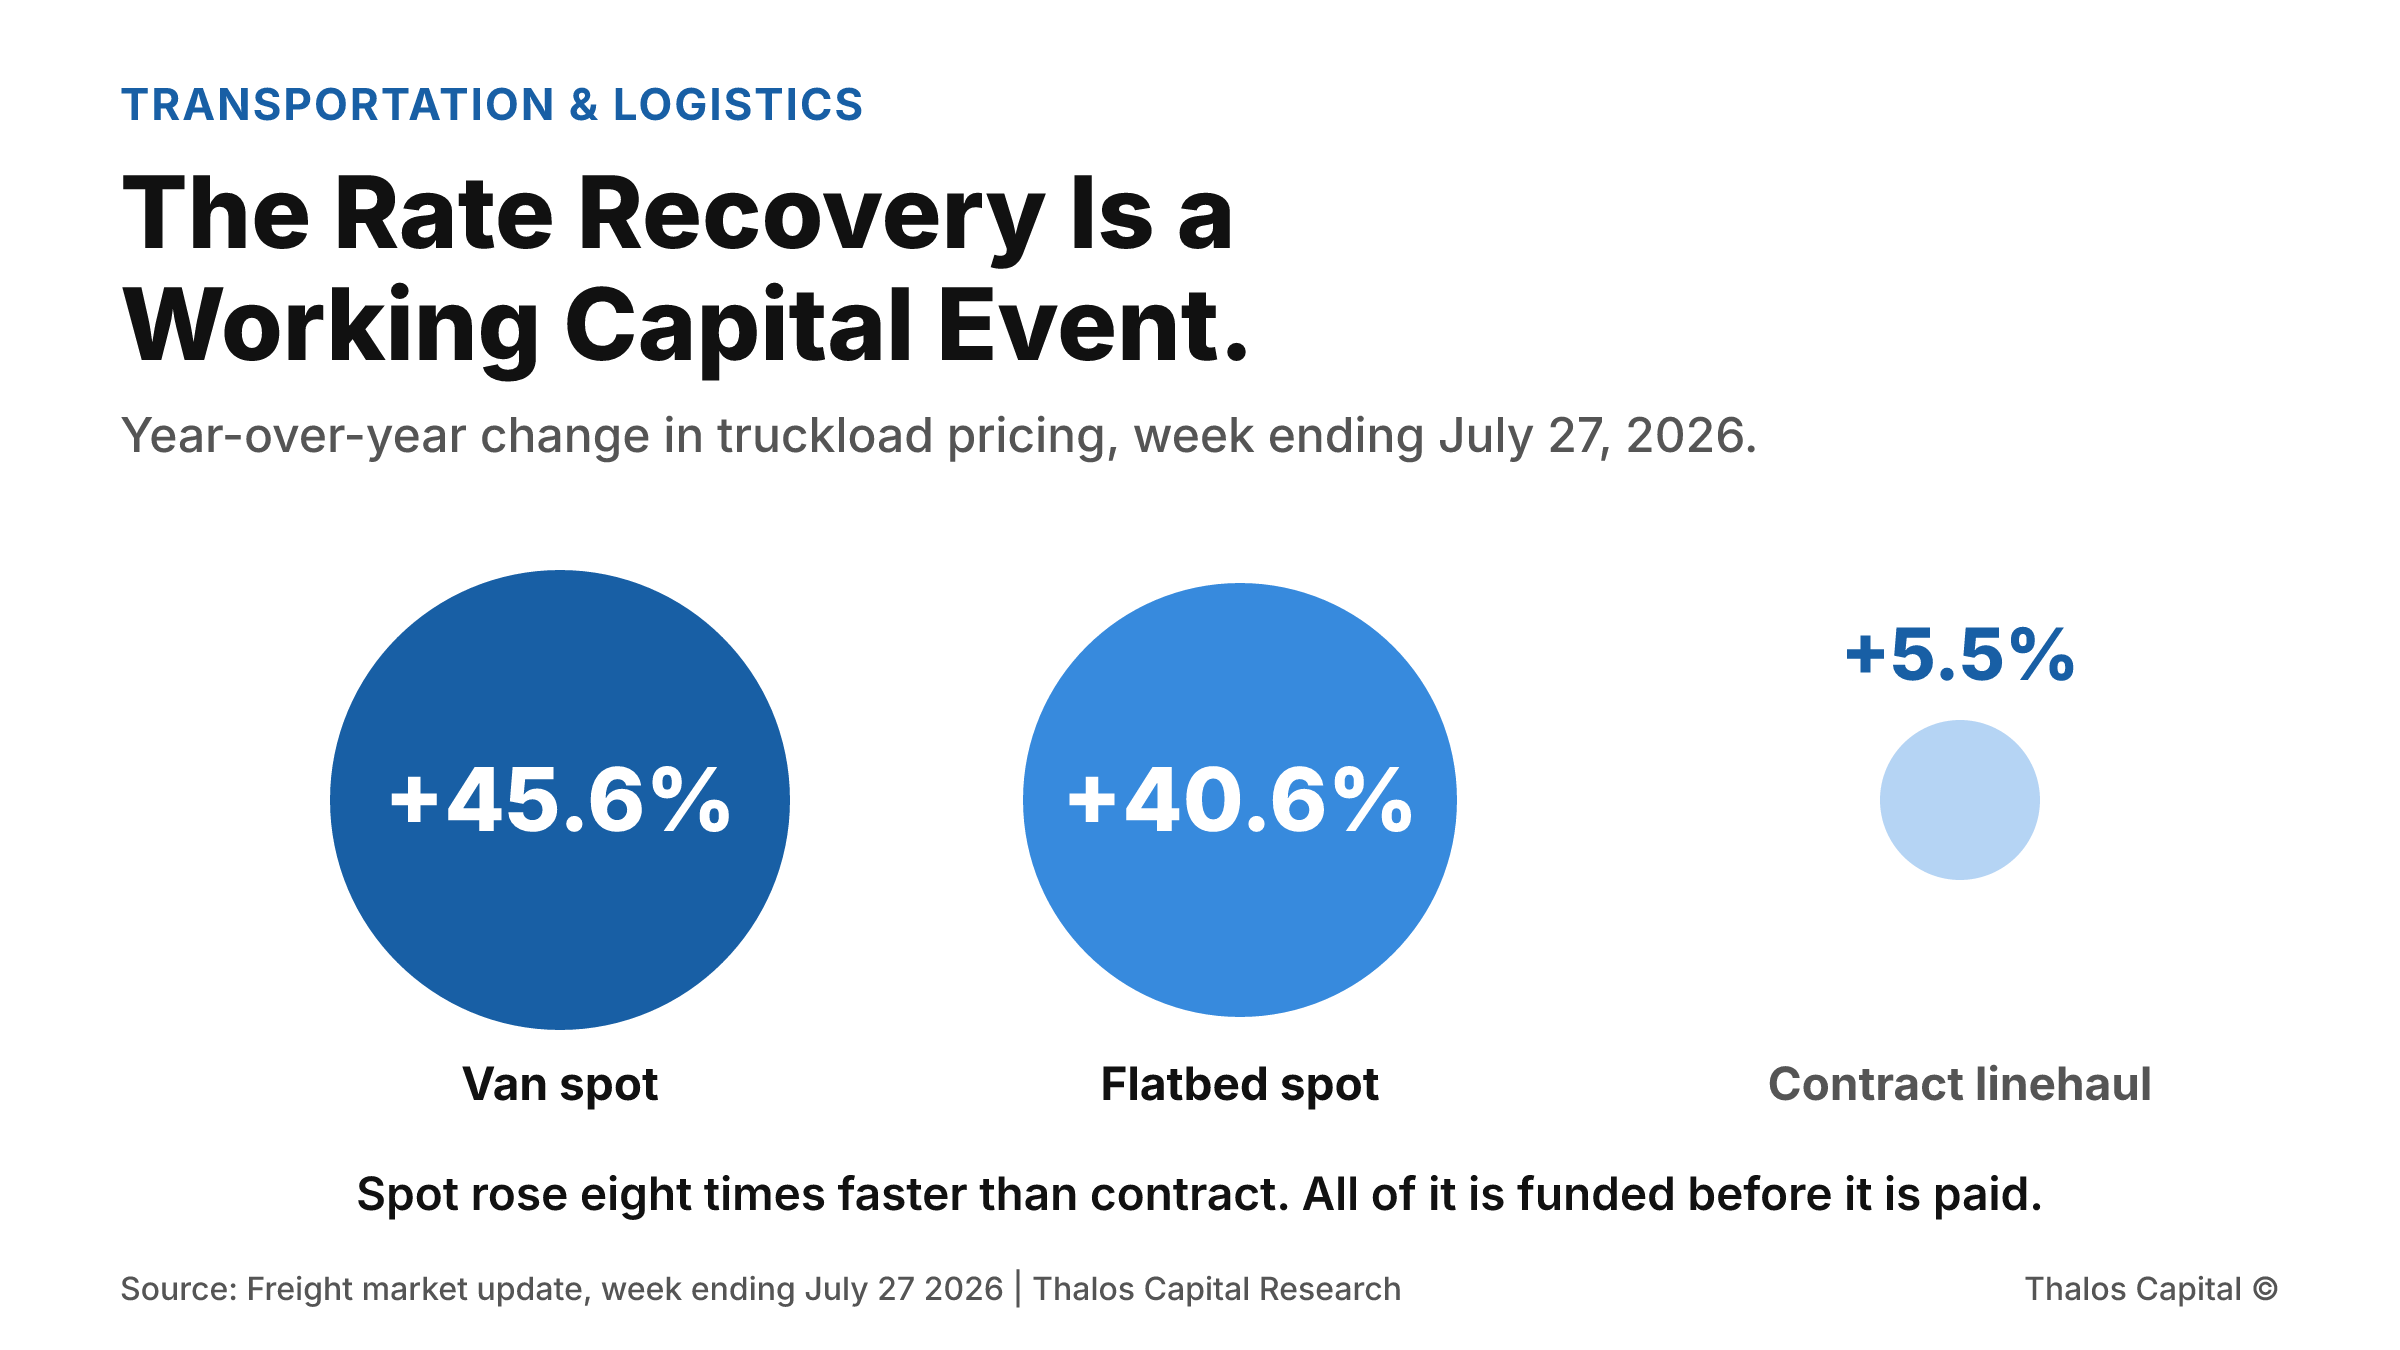
Three proportional circles comparing year-over-year price change in the week ending July 27, 2026: van spot up 45.6 percent shown as the largest navy circle, flatbed spot up 40.6 percent, and contract linehaul pricing up 5.5 percent as a much smaller pale circle.

The Rate Recovery Is a Working Capital Event.

Van spot rates ran 45.6 percent above a year ago in late July while diesel climbed 13.8 percent in four weeks. Both movements enlarge the cash a carrier funds before it gets paid. Why a better freight market consumes capital.
Read More
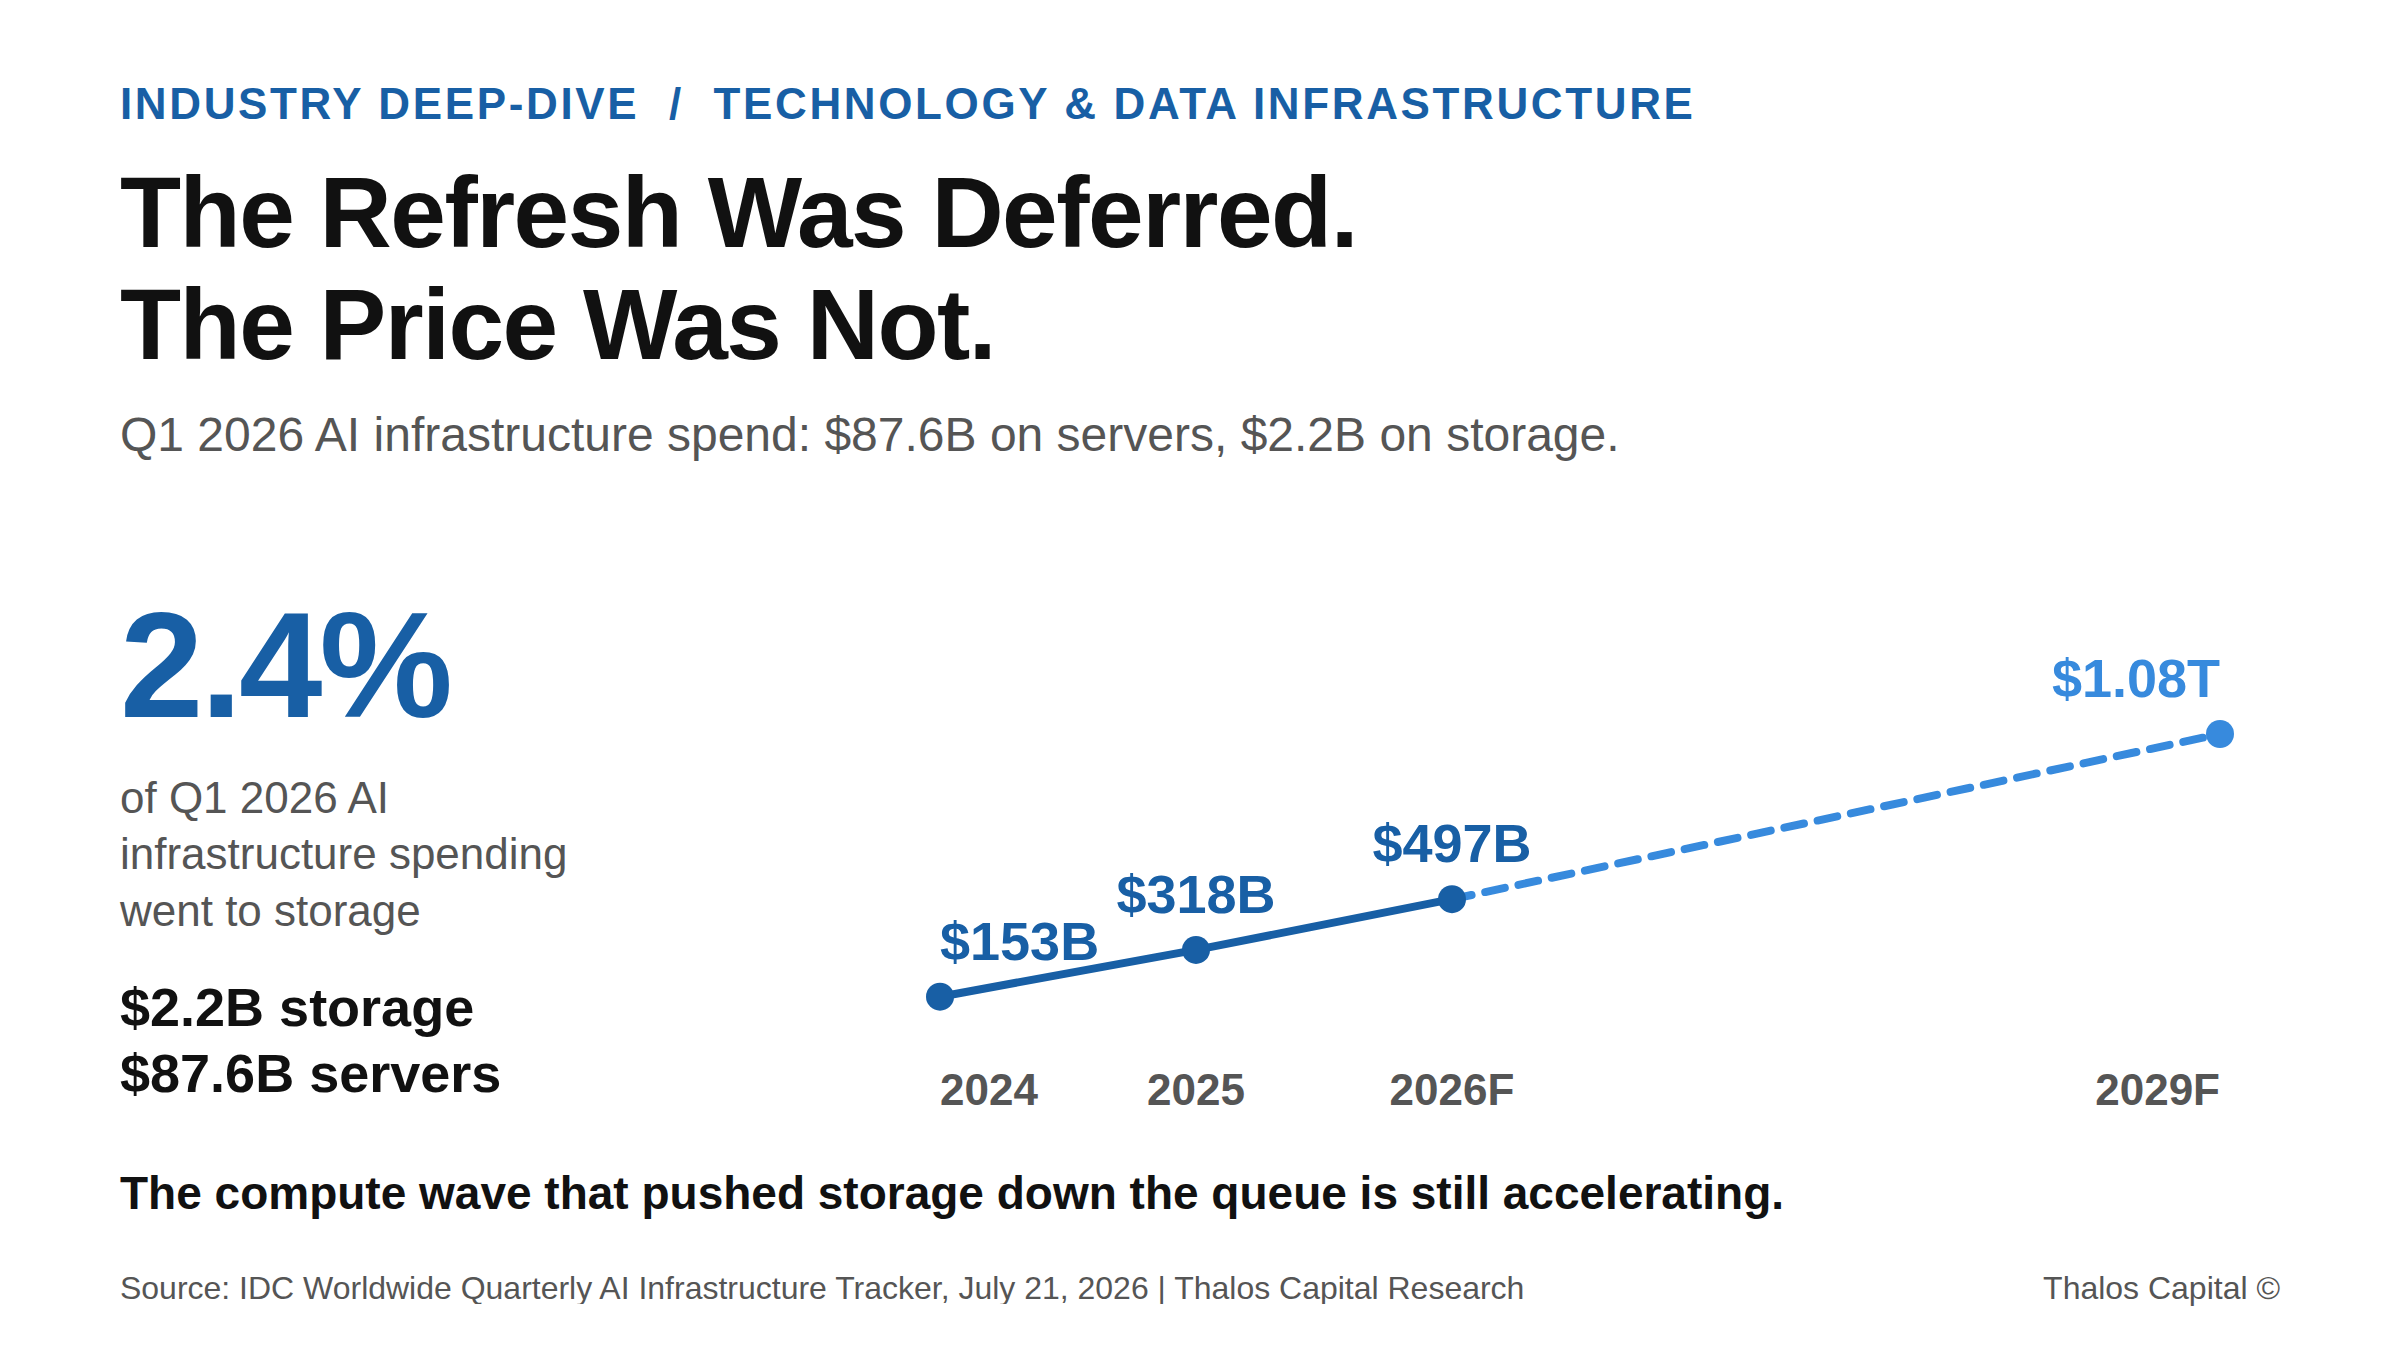
Trend line showing global AI infrastructure spending rising from $153B in 2024 to a forecast $497B in 2026 and $1.08T in 2029, with a callout that storage took 2.4 percent of Q1 2026 spending.

The Storage Refresh You Deferred Comes Due at 2026 Prices

Storage took 2.4% of Q1 2026 AI infrastructure spending. That deferral is expiring into a component market that has repriced every quarter. What it costs, and how to structure the refresh.
Read More
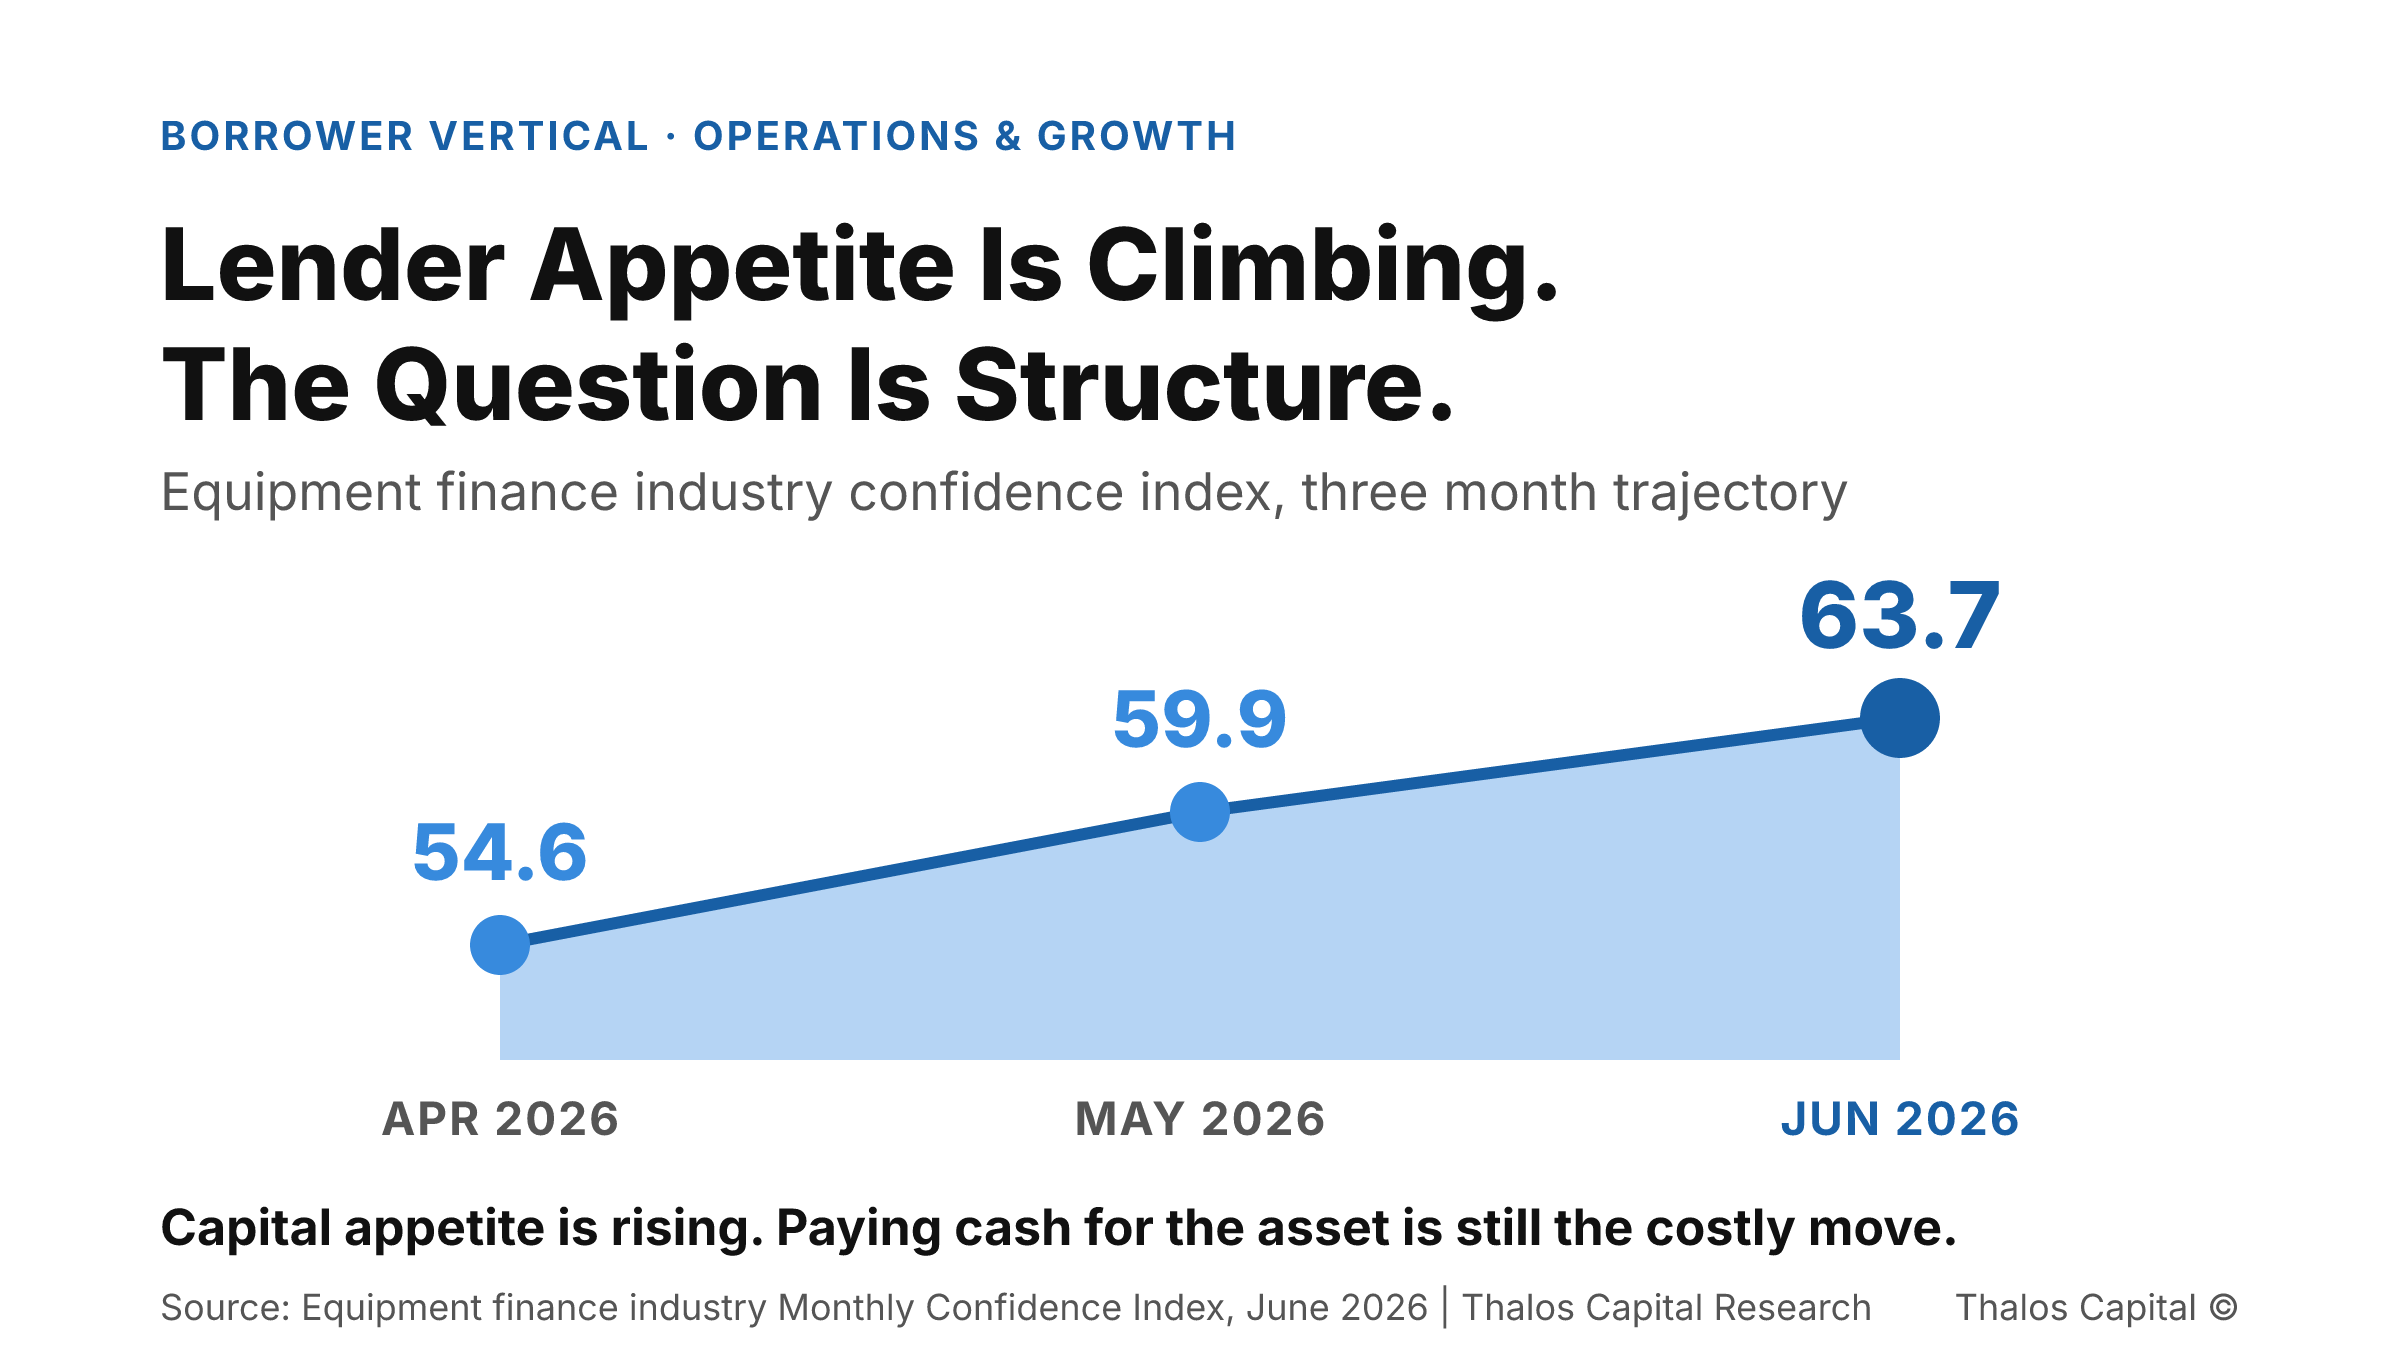
Filled area trend chart showing the equipment finance industry monthly confidence index climbing from 54.6 in April 2026 to 59.9 in May to 63.7 in June.

Paying Cash for Equipment Is Not the Conservative Move. It Is the Expensive One.

Capex demand is rising into a working capital squeeze. Why paying cash for equipment is the expensive move, and how layering the structure preserves the liquidity growth consumes.
Read More
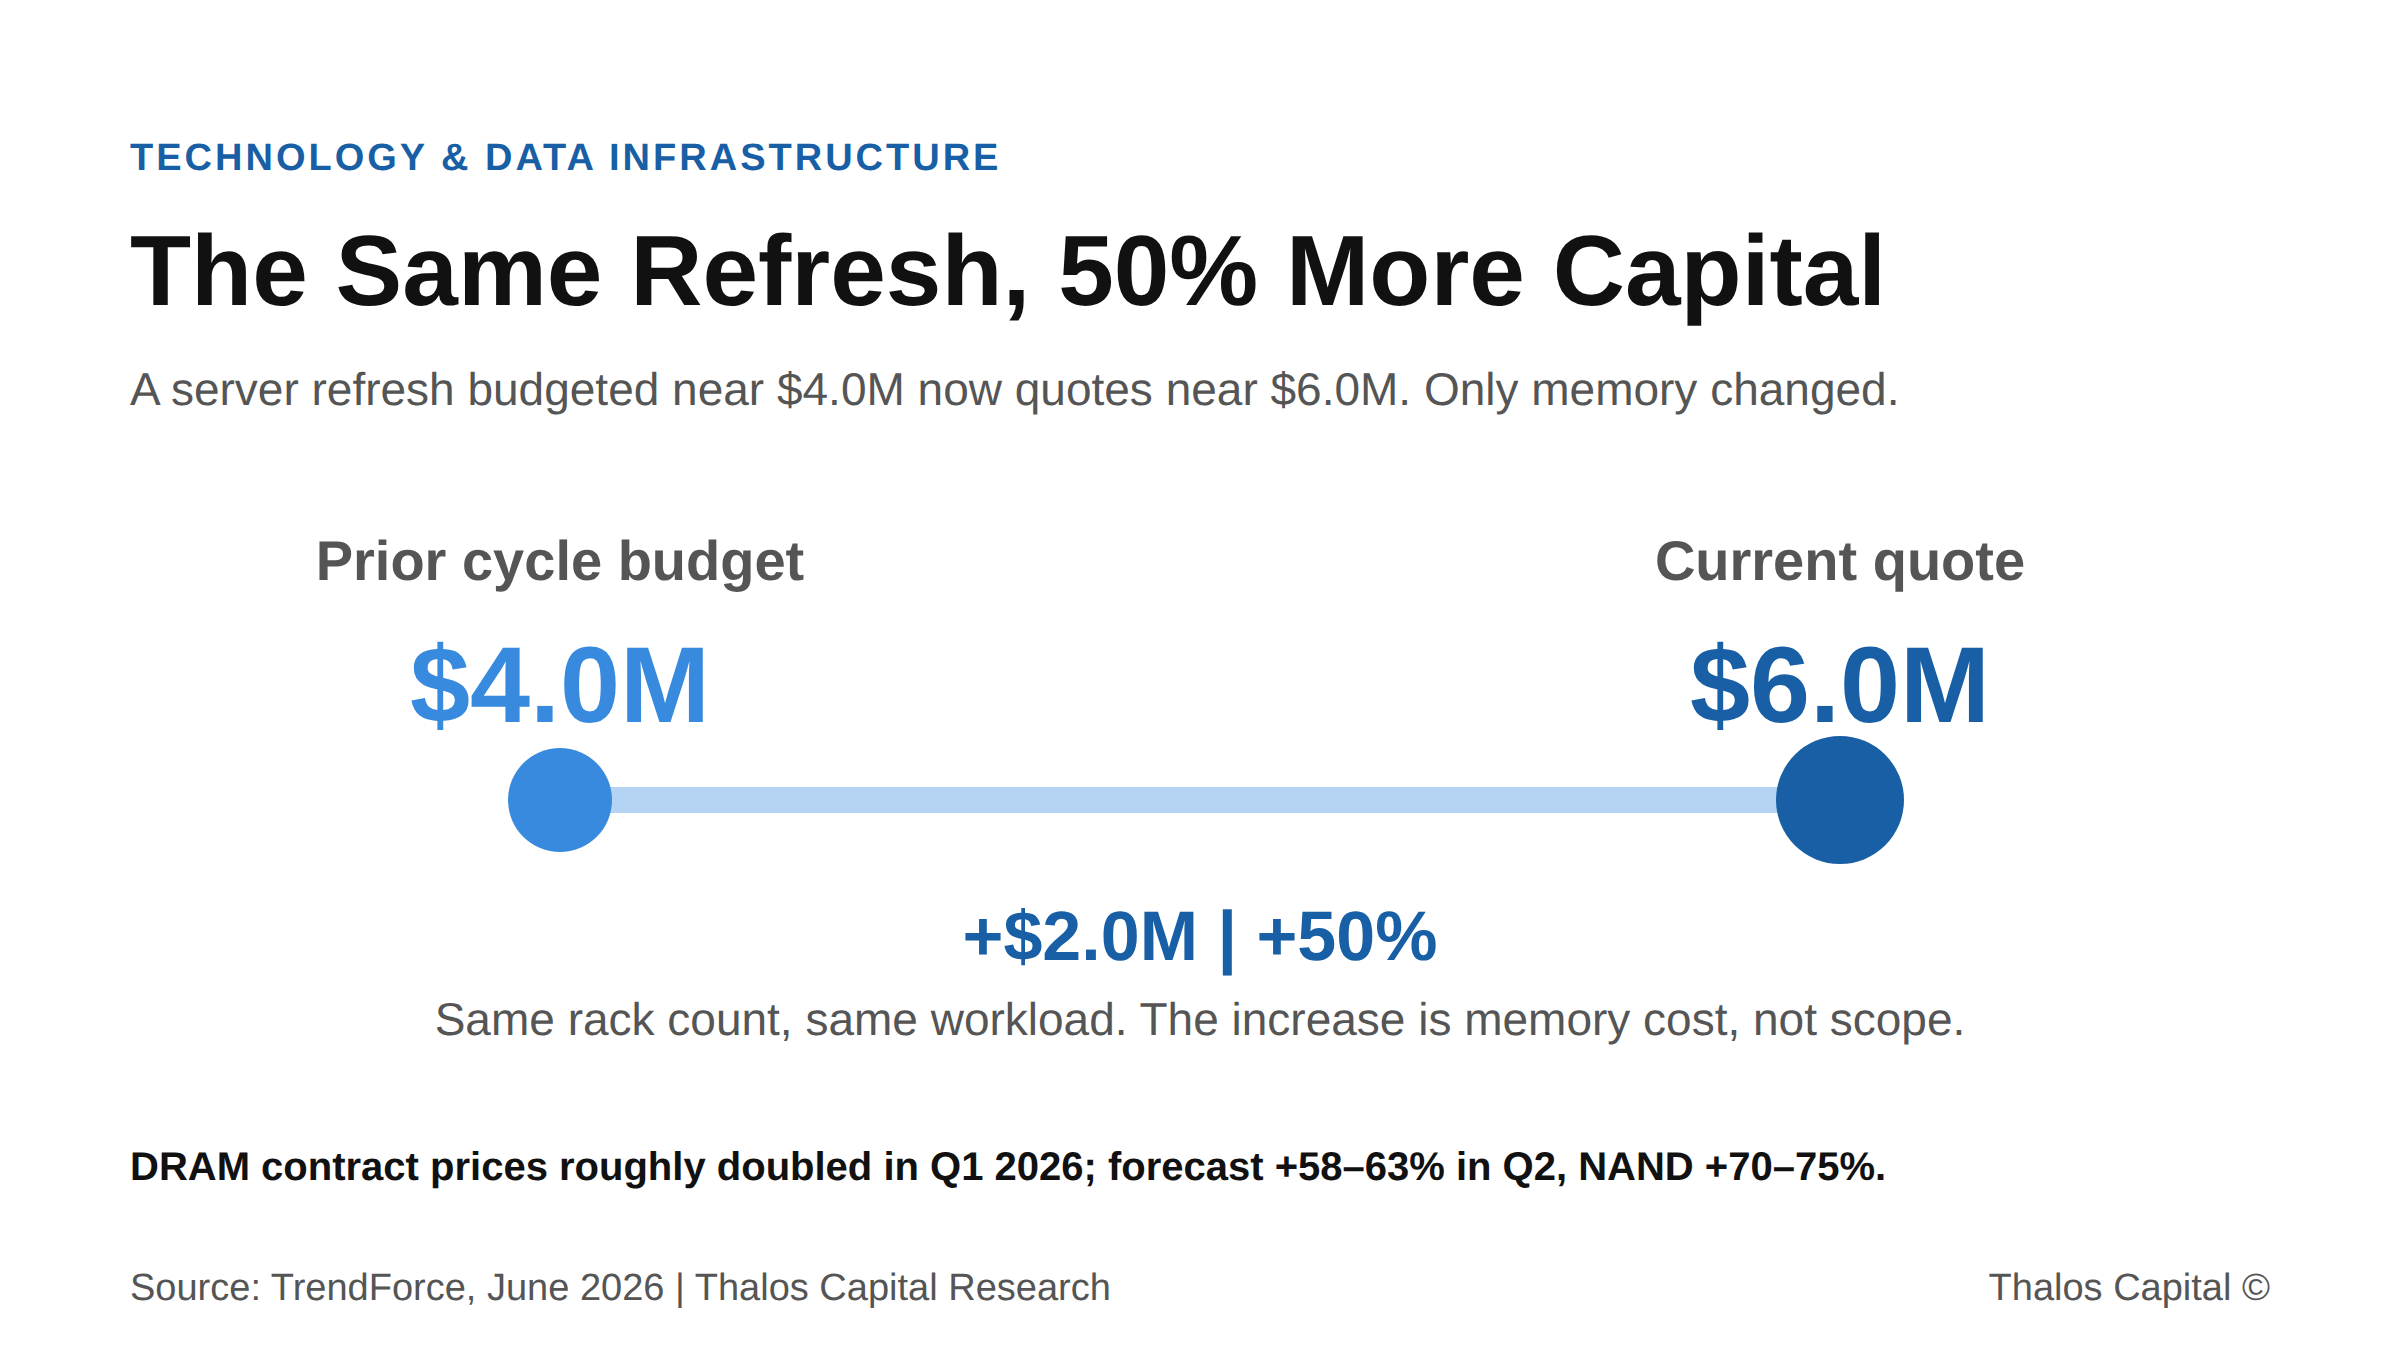
Two-point range chart showing a data-infrastructure refresh rising from a $4.0M prior-cycle budget to a $6.0M current quote, a 50 percent increase driven by 2026 memory price inflation.

The Same Server Refresh Now Costs 50% More: How One Operator Funded It Without Draining the Business

Memory prices doubled in 2026, pushing a $4M server refresh to $6M. How structuring the financing, not paying cash, preserves the liquidity that runs the business.
Read More
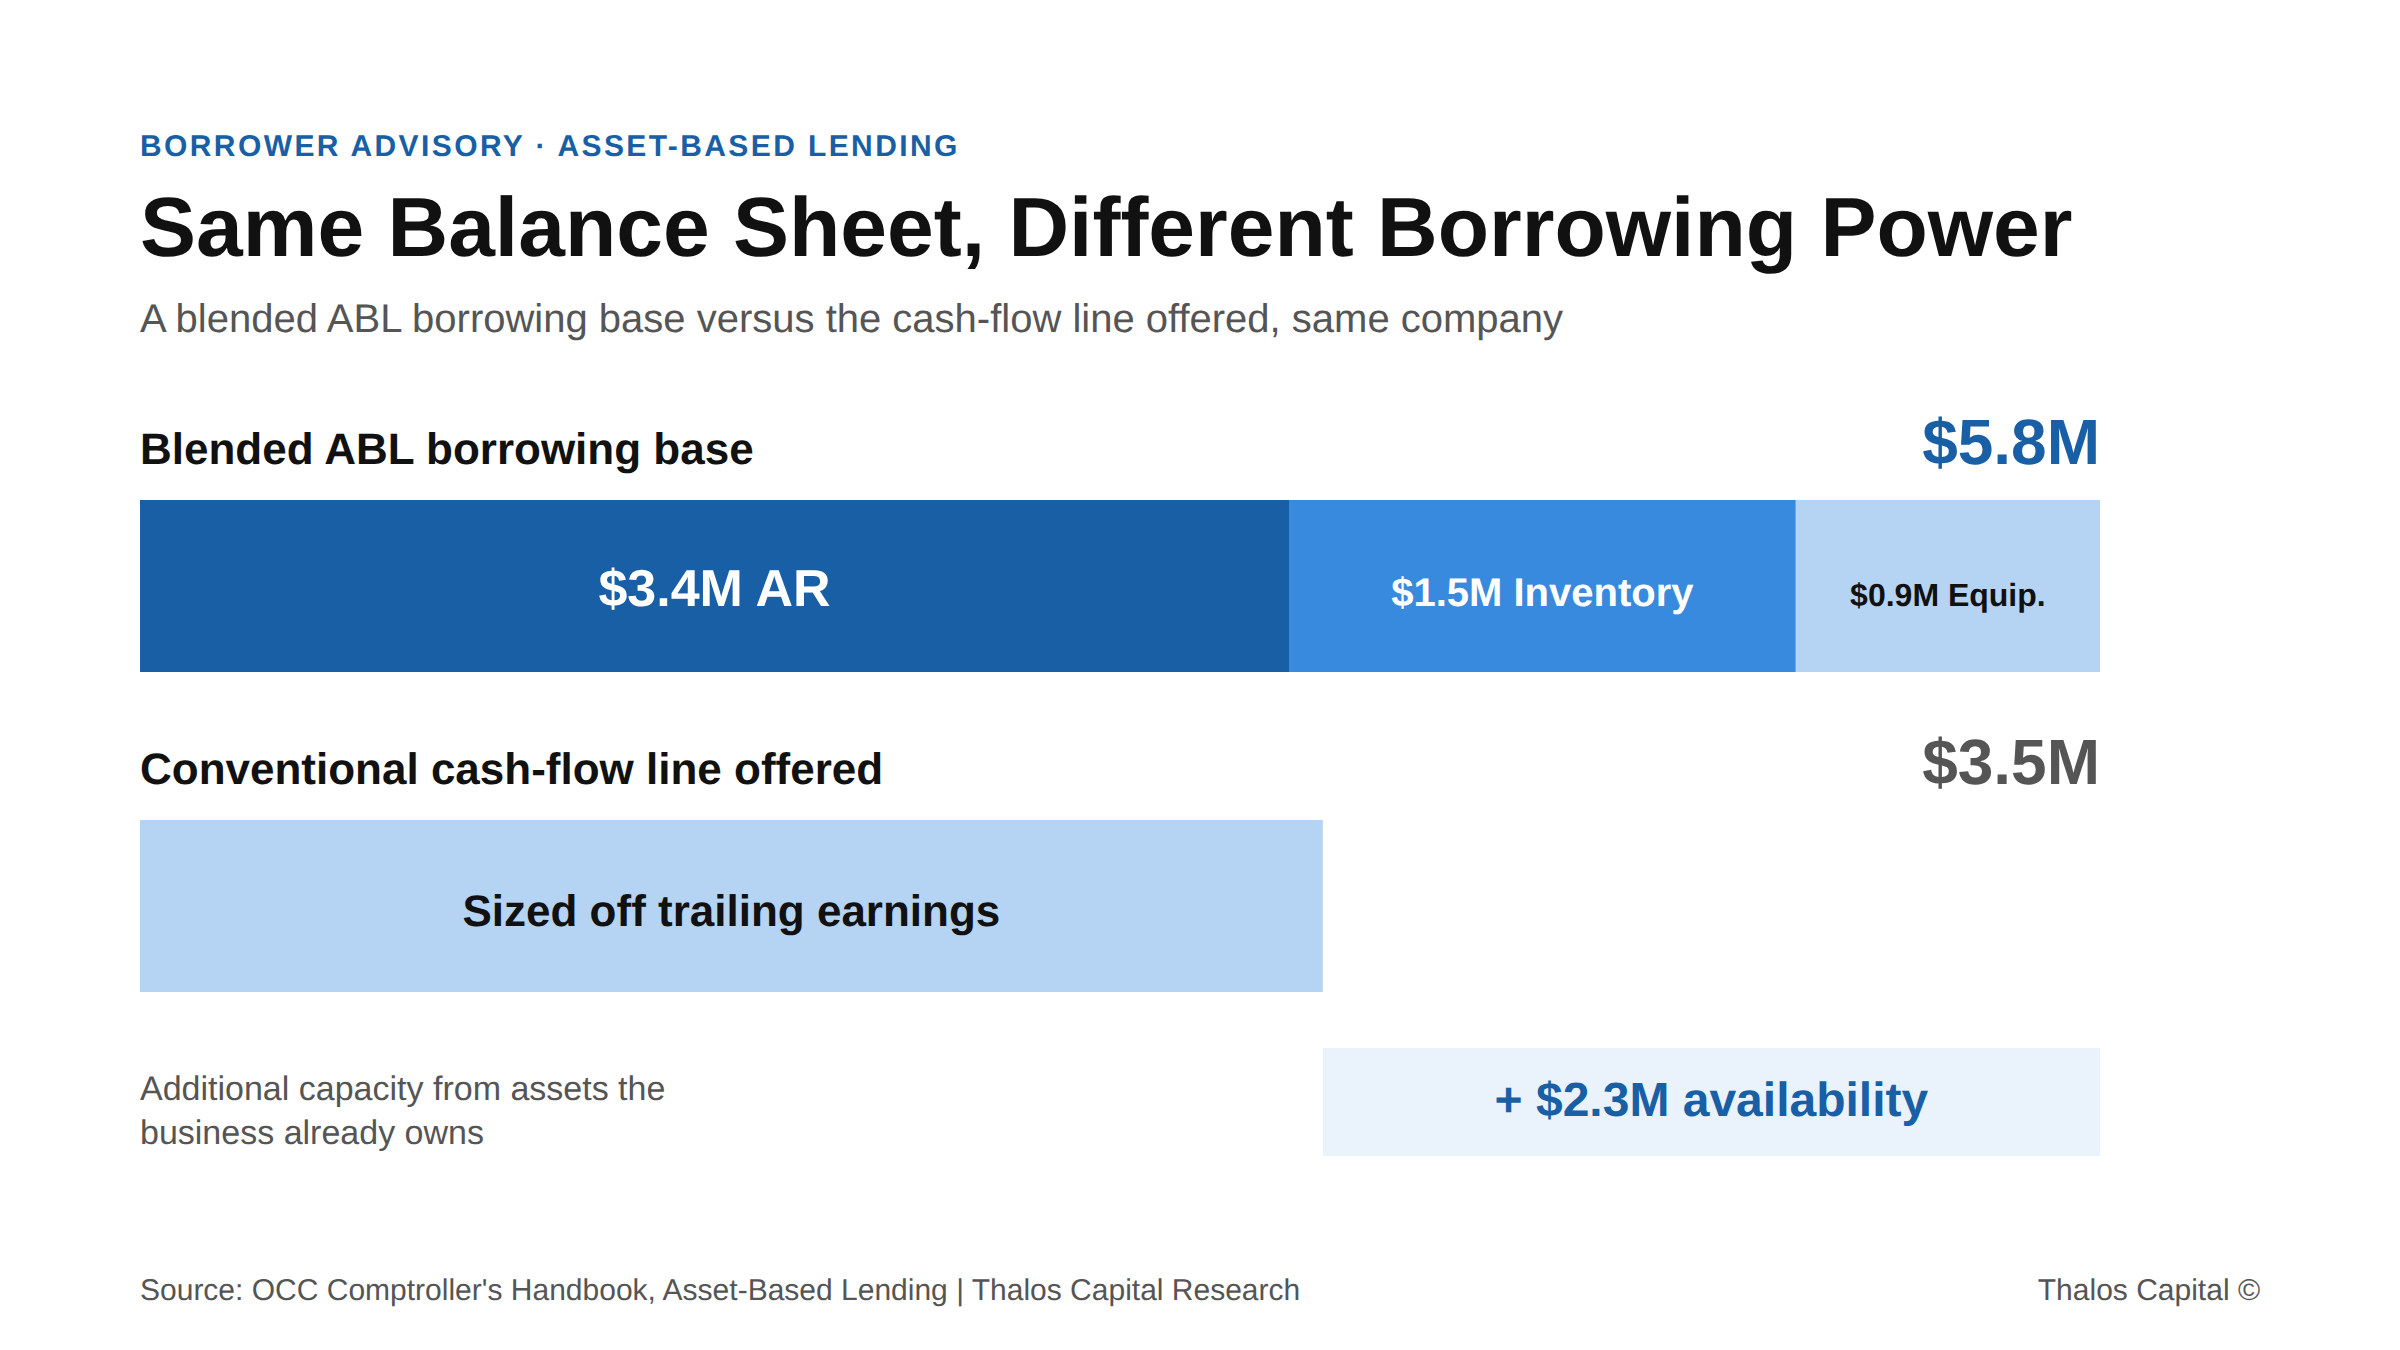
Single stacked bar. how a blended borrowing base is built, against the cash-flow line offered.

Asset-Rich, Credit-Capped: Why Tightening Operators Borrow Against the Wrong Thing

Asset-rich operators tightening through rising costs often borrow against the wrong thing. Why a cash-flow line caps capacity the balance sheet could exceed, with the numbers.
Read More
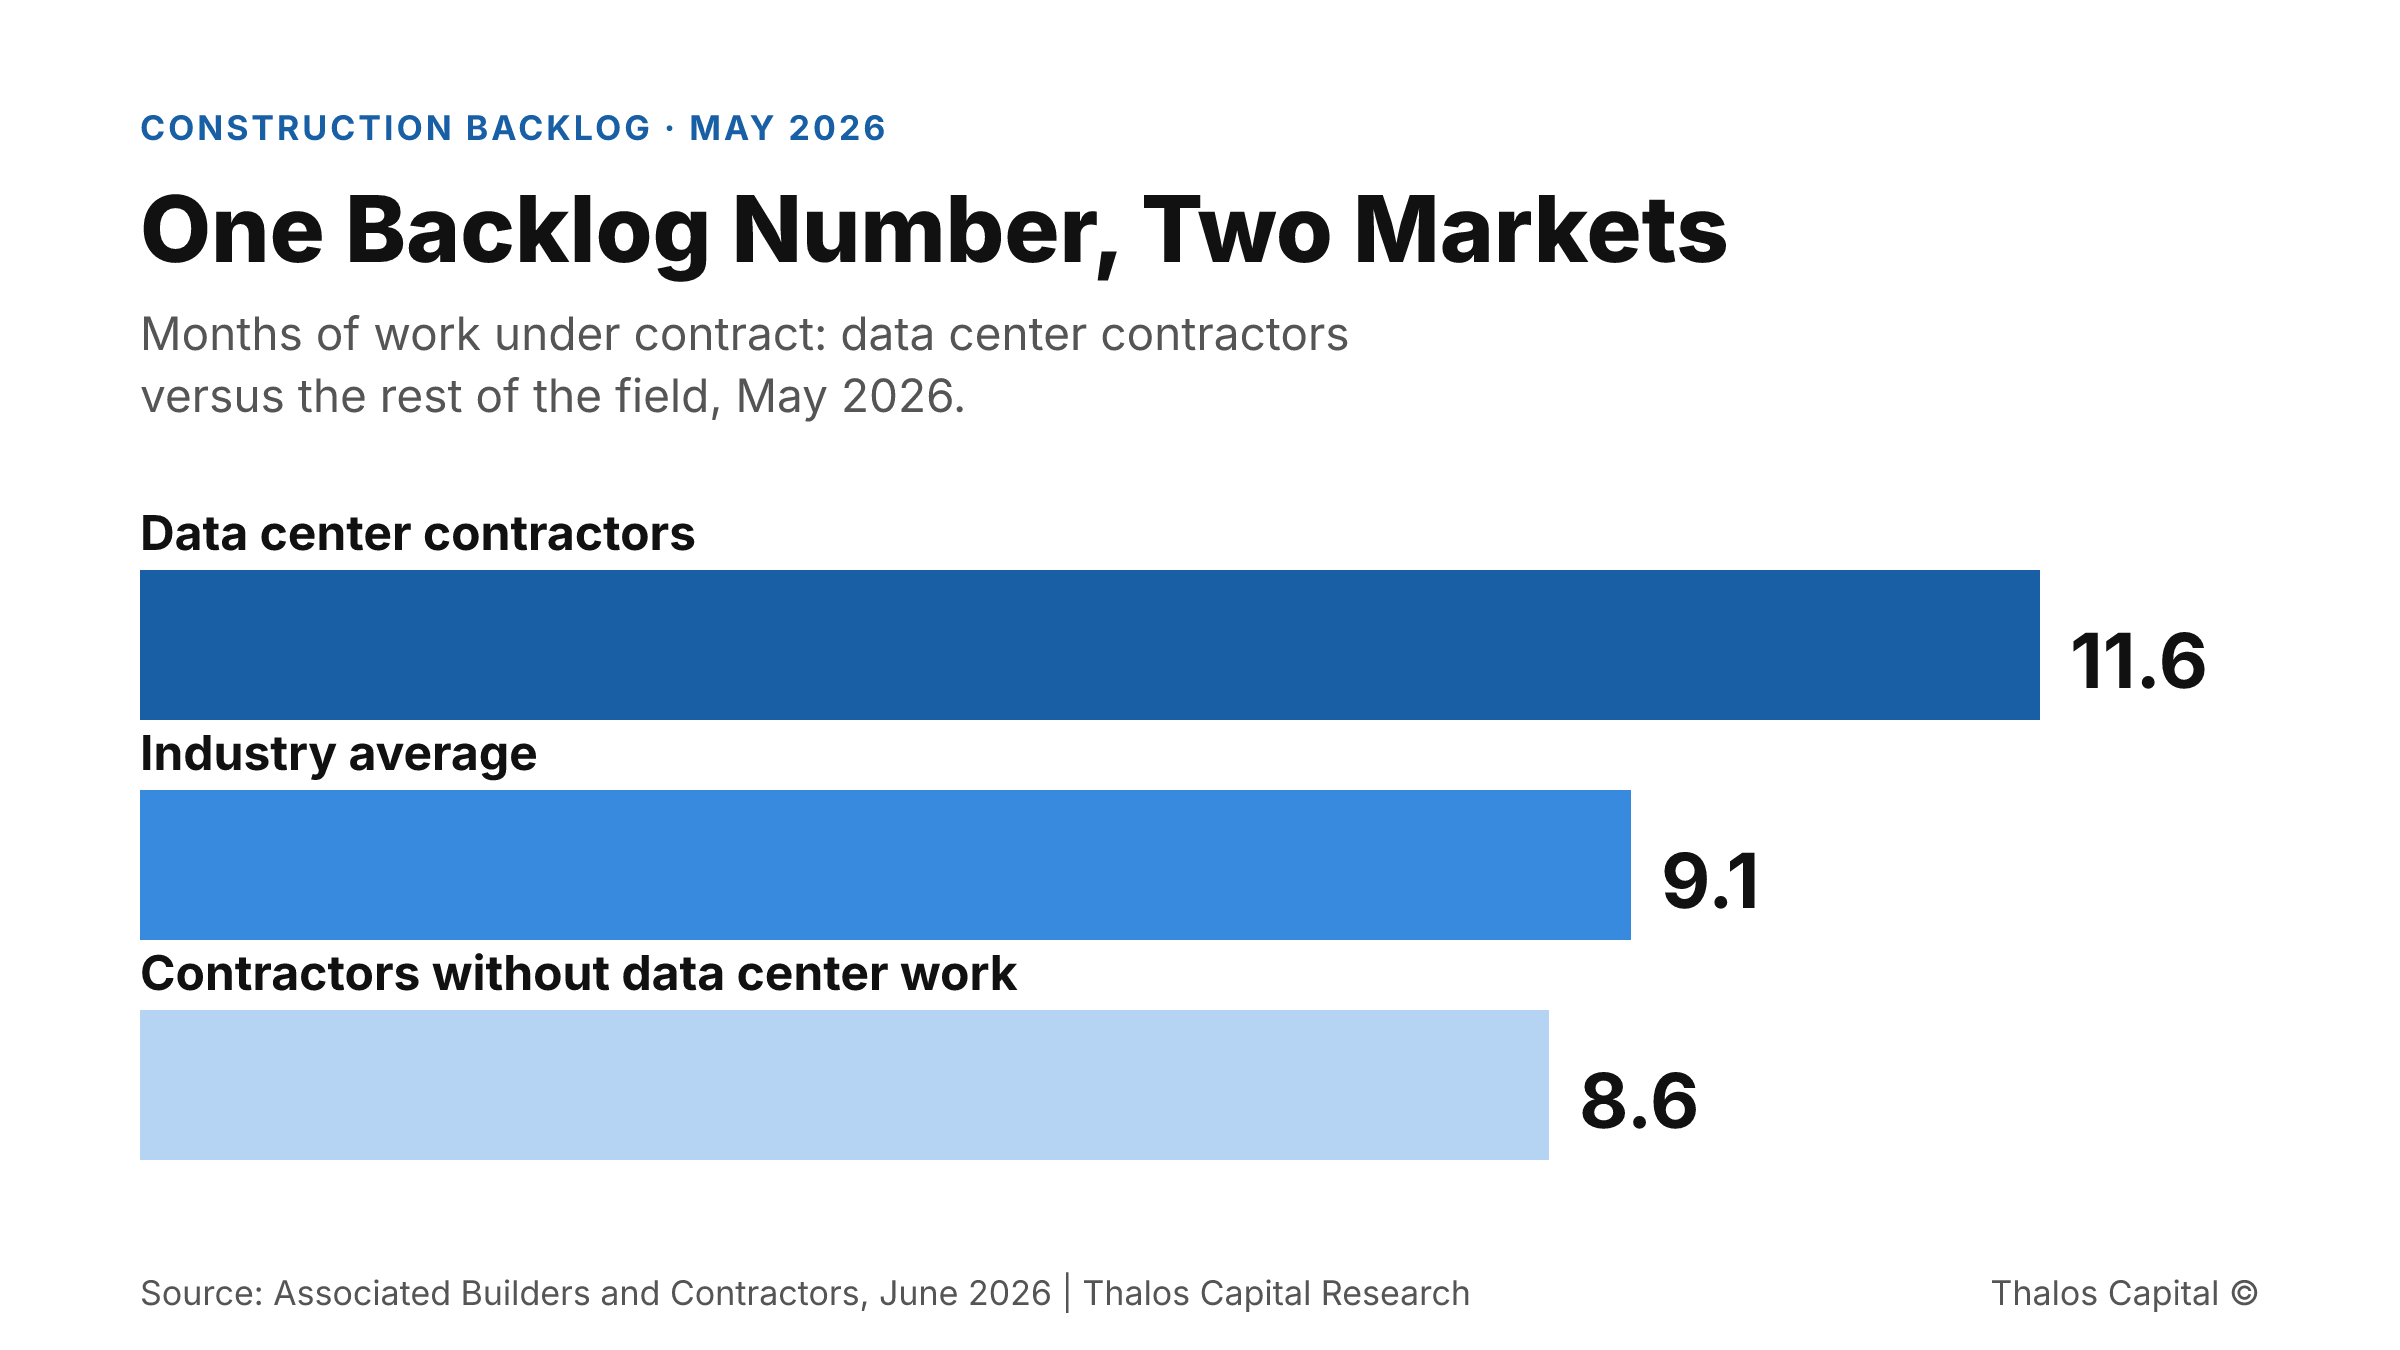
Horizontal bar chart showing construction backlog of 11.6 months for data center contractors, 9.1 months industry average, and 8.6 months for contractors without data center work, May 2026

The Three-Month Backlog Gap Now Splitting the Construction Market

Construction backlog hit a three-year high in May, but the gain is concentrated in data center work. Why the 86% of contractors outside that lane risk being priced off a market they do not occupy.
Read More
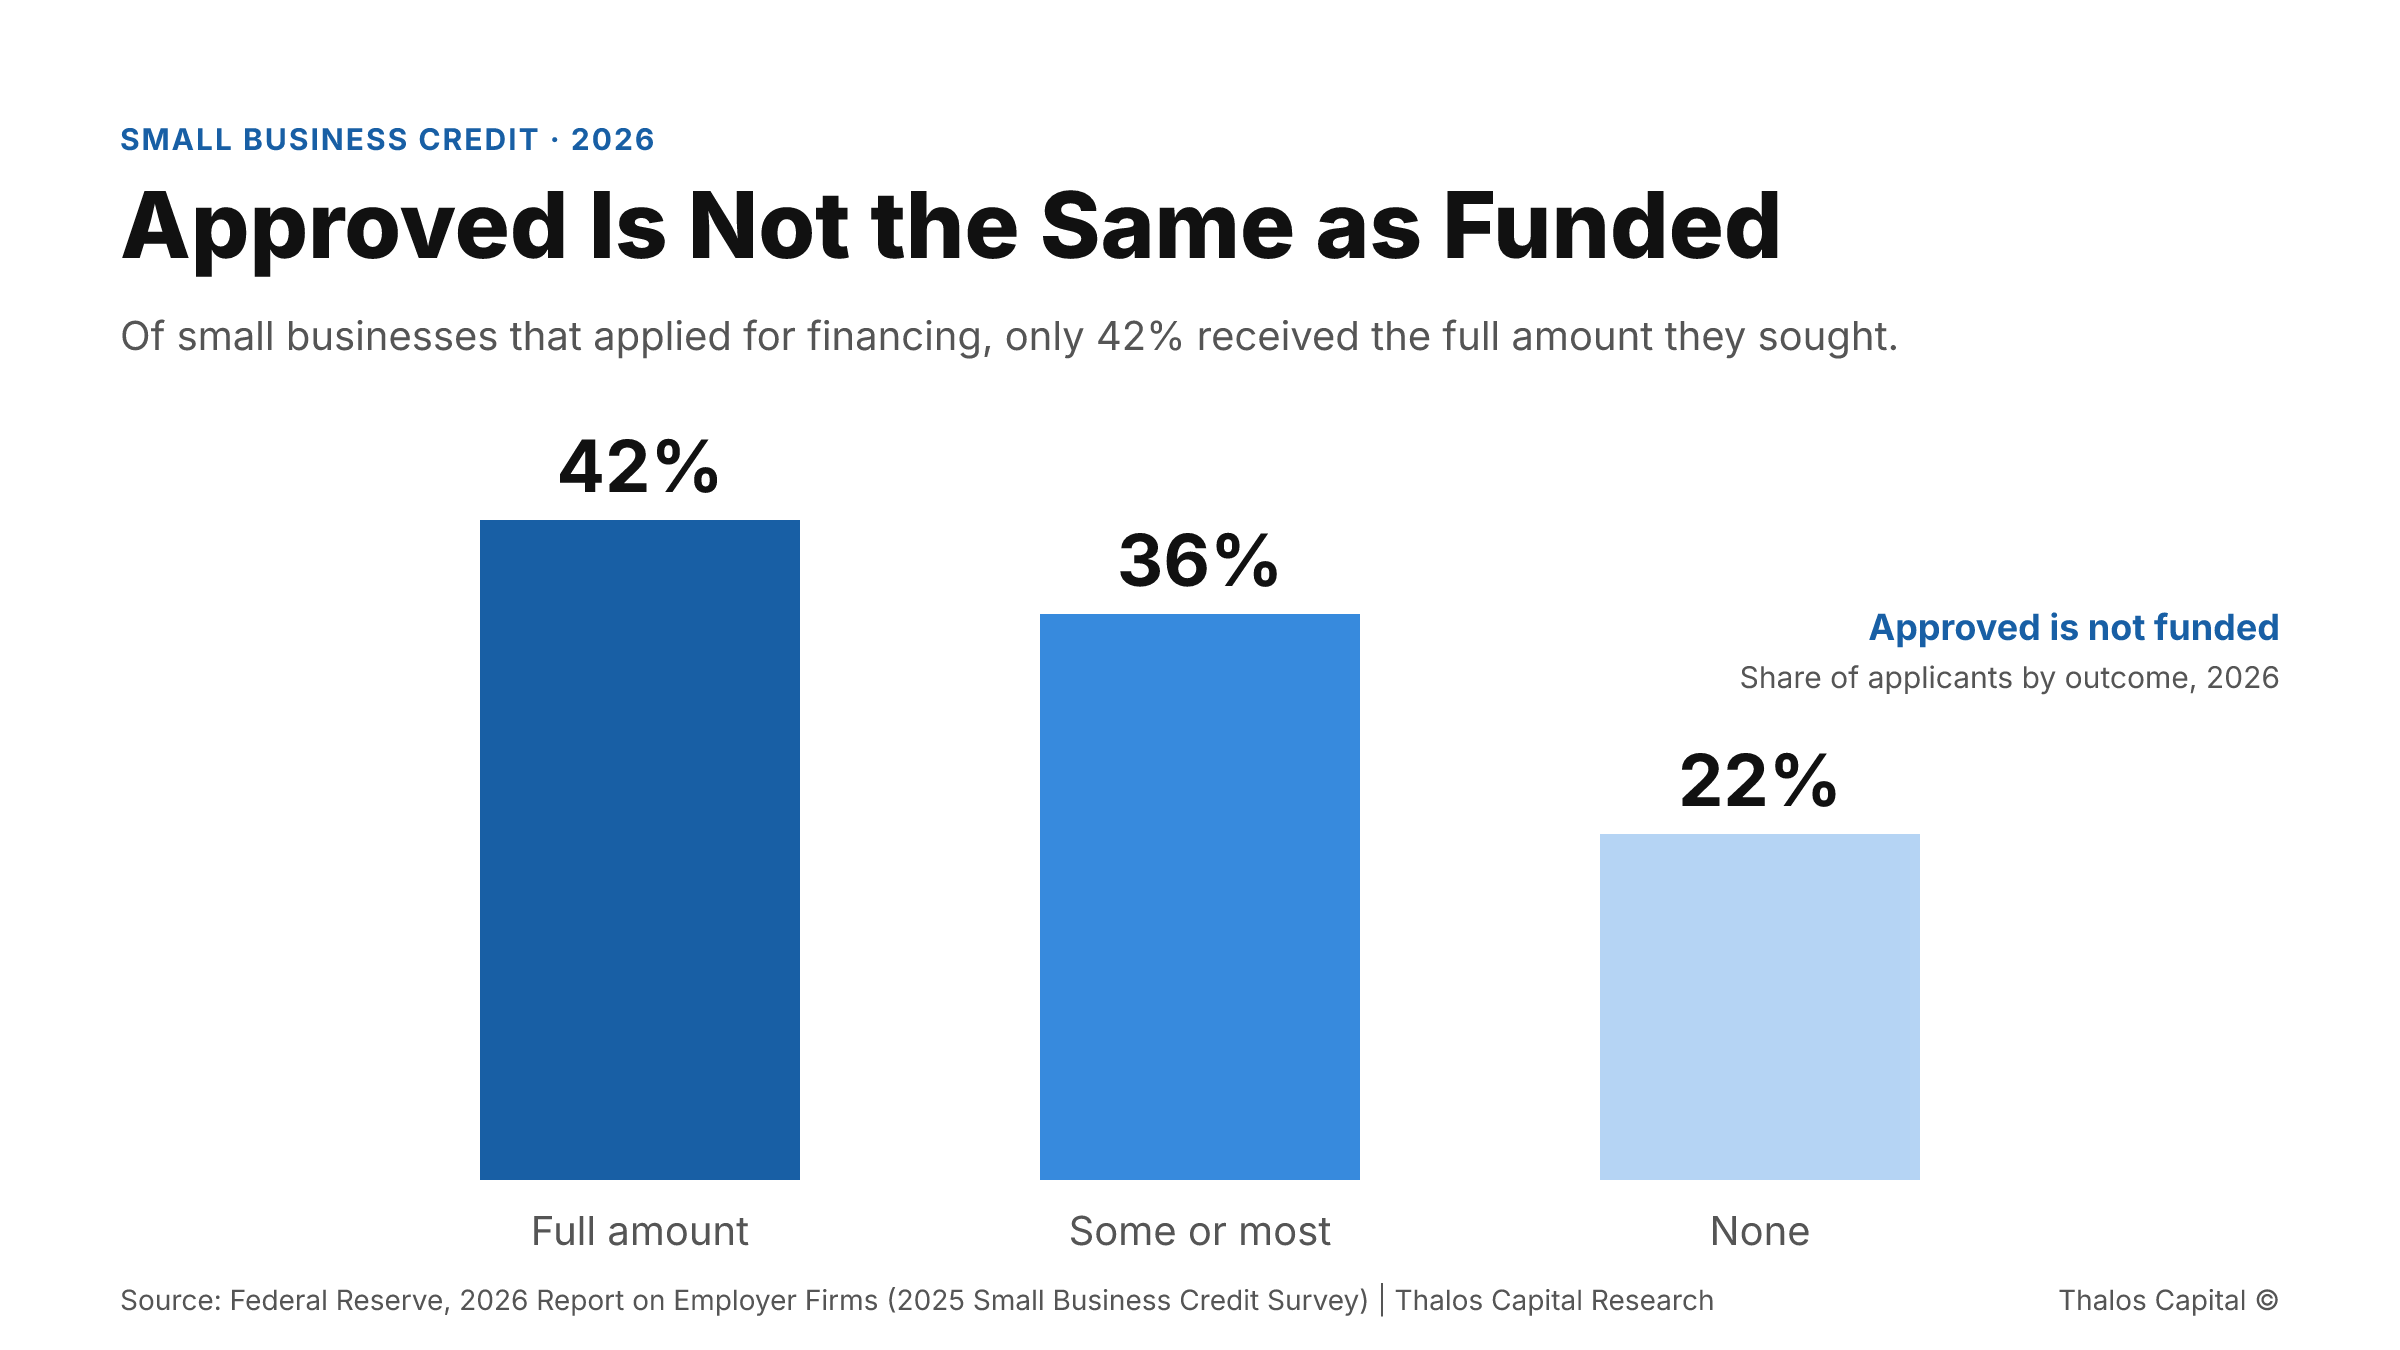
Bar chart showing 42 percent of small business financing applicants received the full amount, 36 percent some or most, 22 percent none.

Getting Approved Is Not Getting Funded: The 42% Problem

Only 42% of small businesses get the full financing they request. Why partial approval is the most expensive outcome, and what fully funded borrowers do differently.
Read More
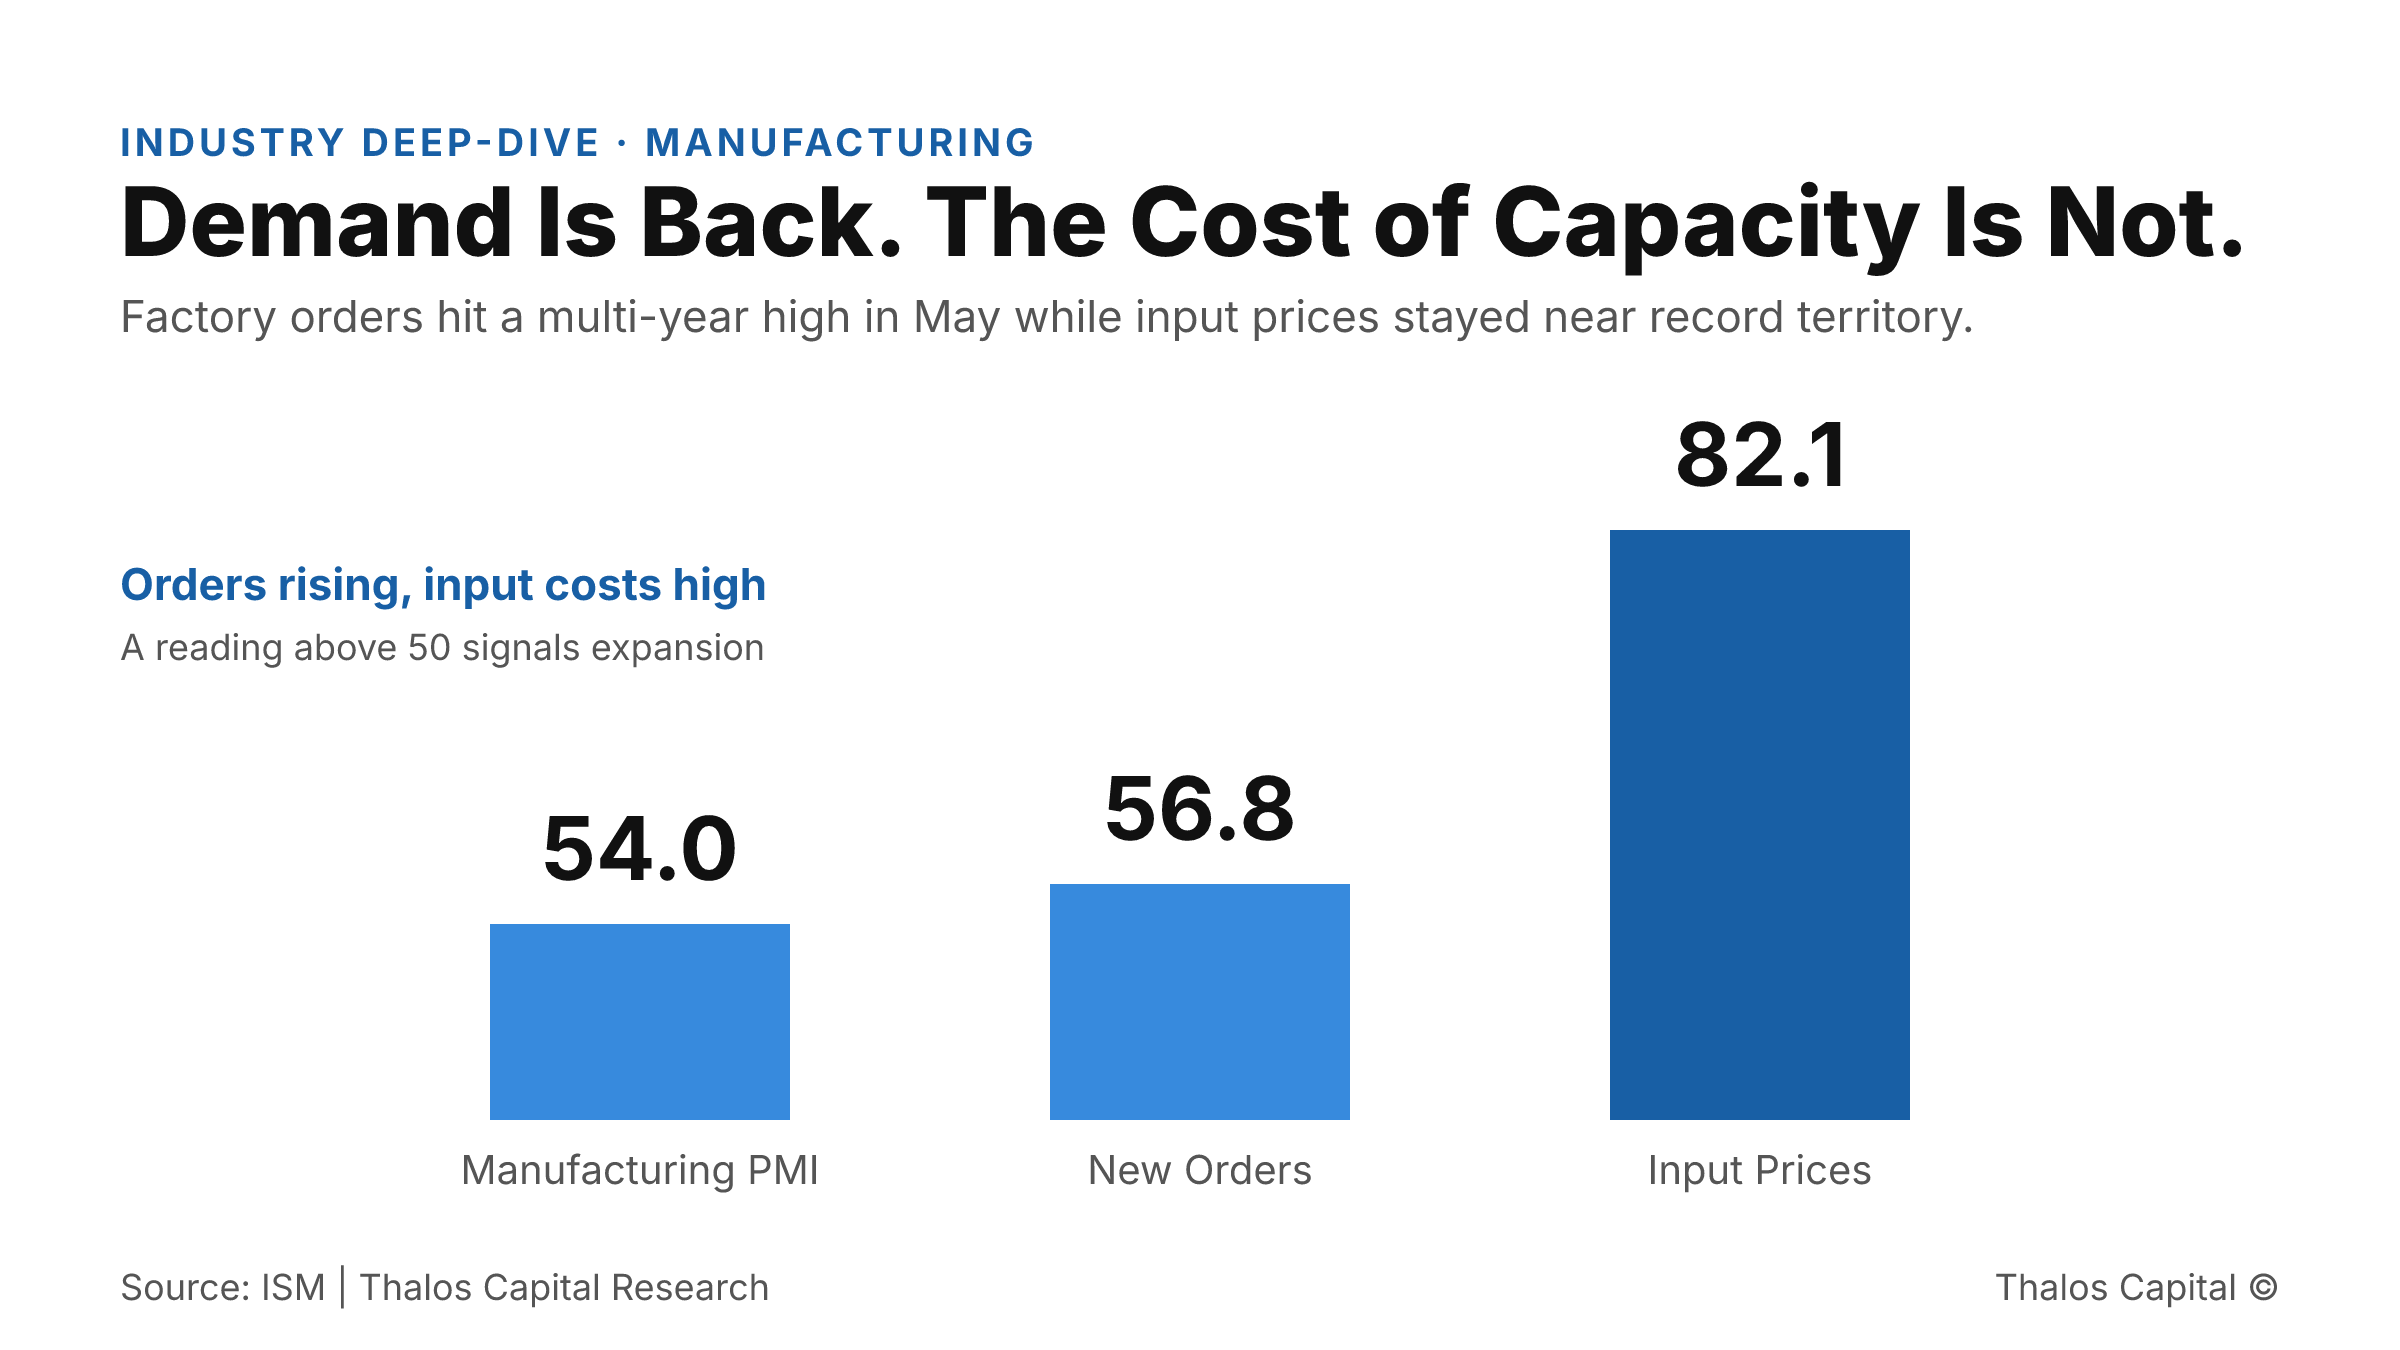
Bar chart of May 2026 ISM manufacturing readings showing the PMI at 54.0, New Orders at 56.8, and the Prices Index at 82.1, with demand expanding while input prices stay elevated.

The Order Came In. The Cash to Fill It Did Not.

Manufacturing demand hit a multi-year high in May while input prices stayed near record levels. Why funding capacity now depends on how equipment and working capital financing is structured and sourced.
Read More
Working through a financing decision?
Insights are a starting point. A conversation maps your actual options.
Tell us what you are financing and we will map the structures and sources that fit.
Submit your financing request →
Explore our financing solutions
Equipment FinancingWorking CapitalAsset-Based LendingStrategic Debt