Category

Financing Strategy

17 insights · page 2 of 3

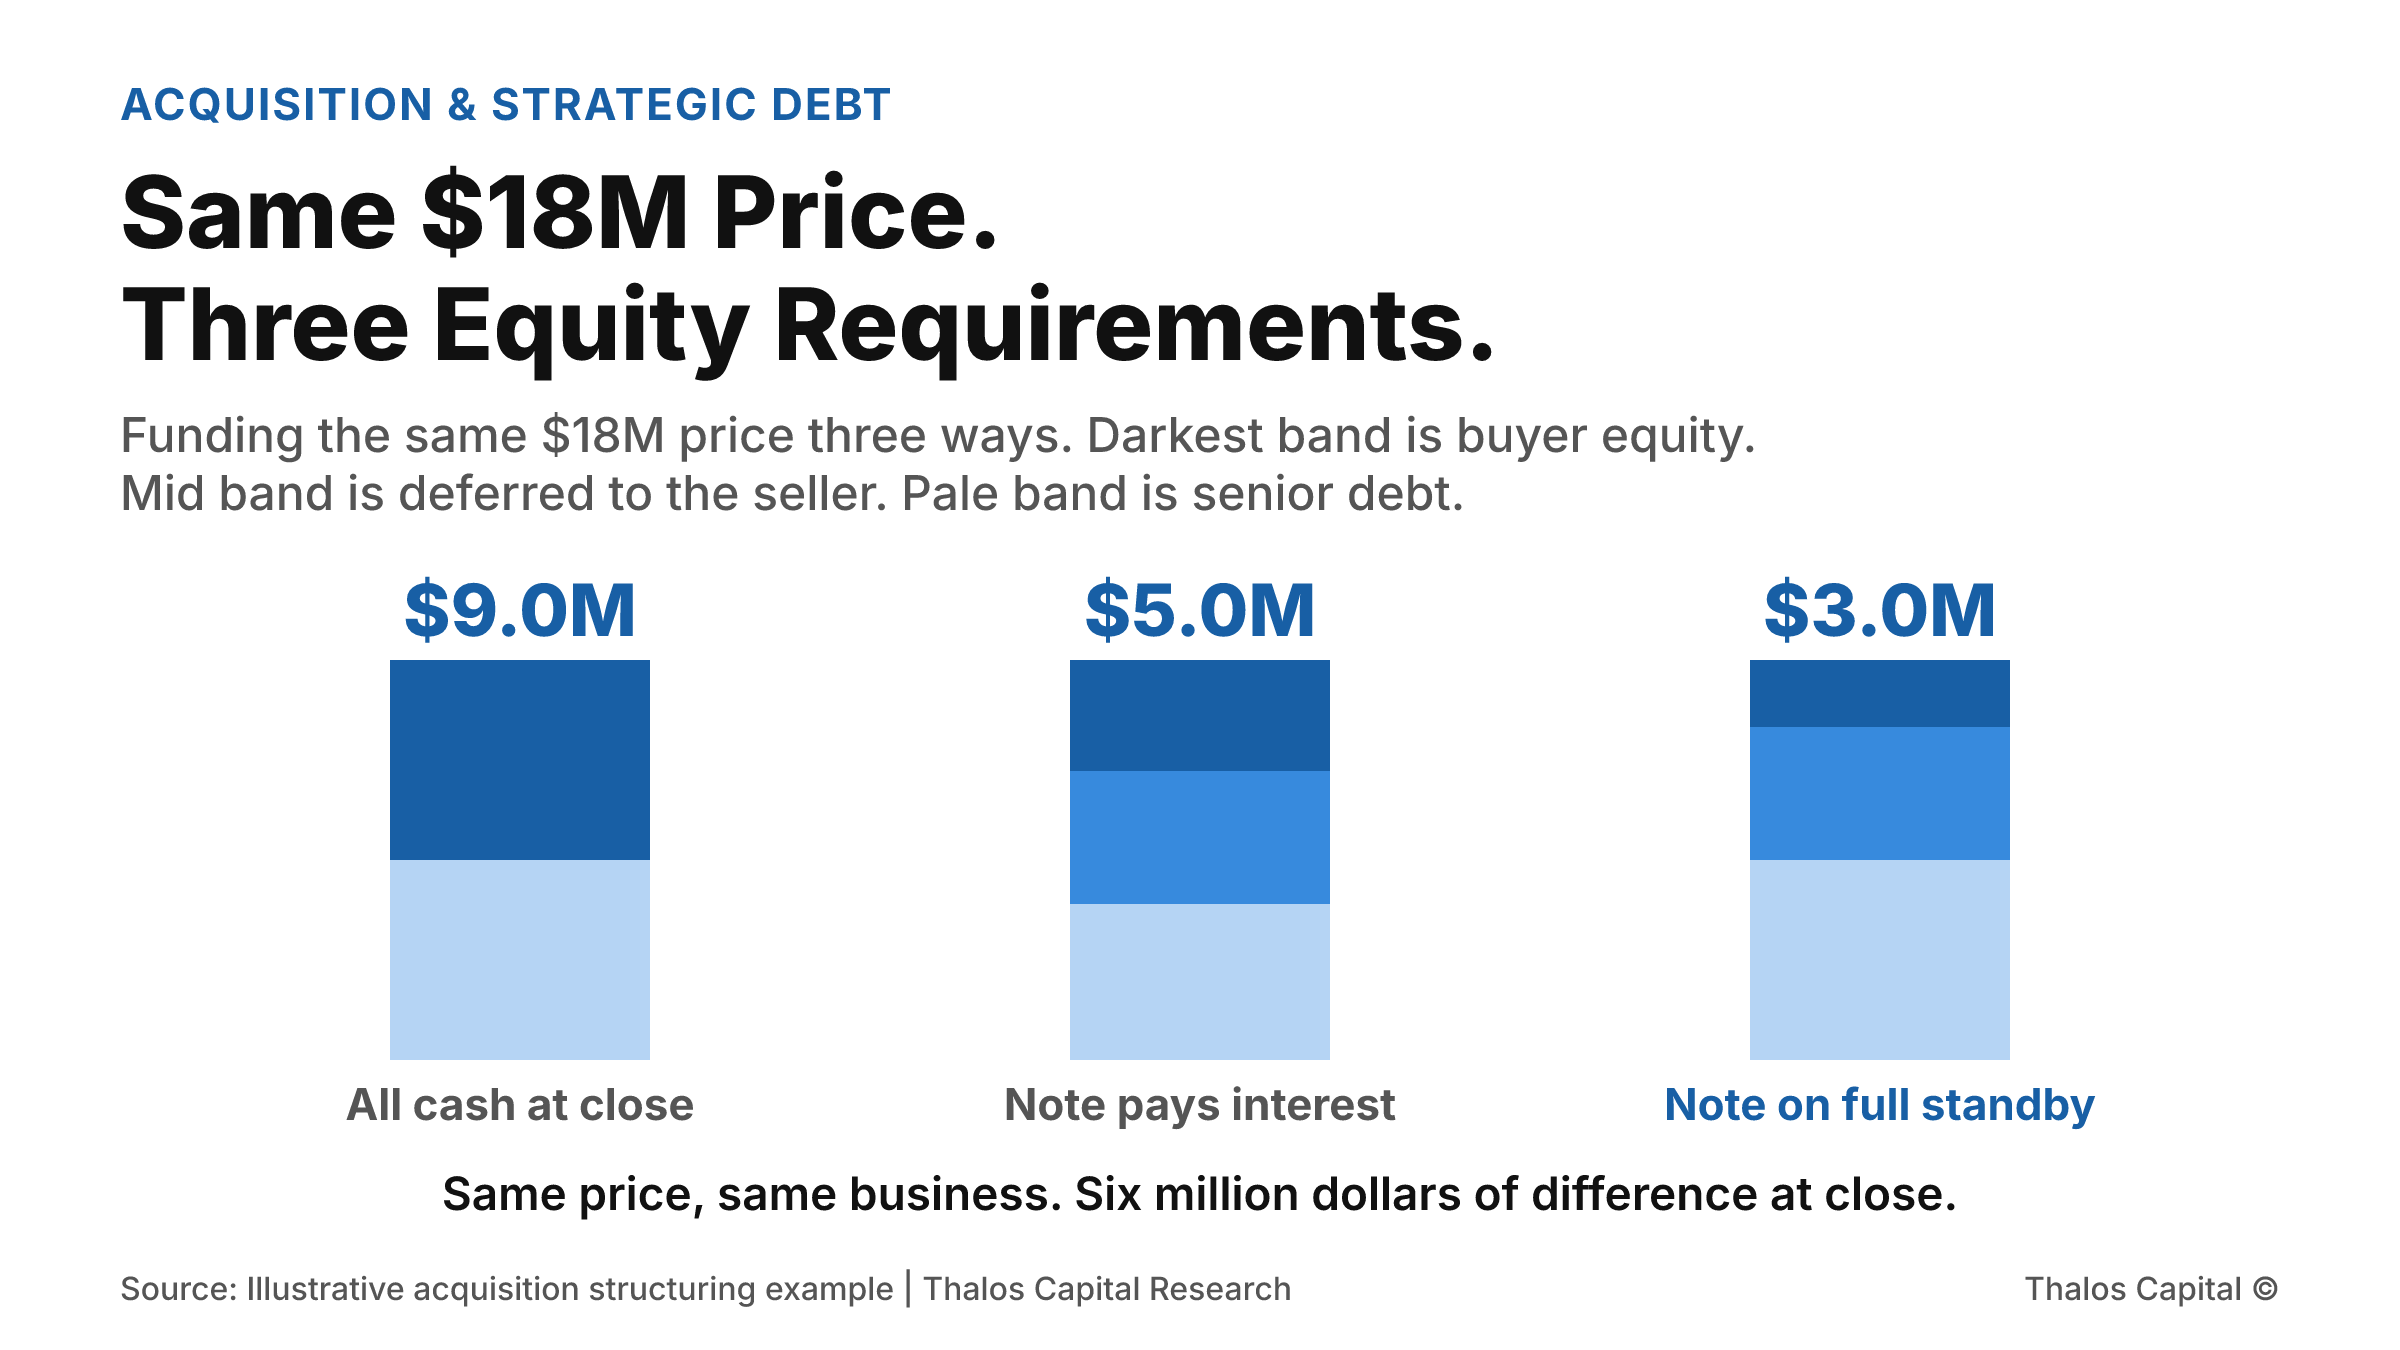
Three small stacked columns funding the same $18 million purchase price, showing buyer equity at close of $9 million on an all-cash deal, $5 million when the seller note pays current interest, and $3 million when the seller note sits on full standby.

Same $18M Price. Three Different Equity Requirements.

Two buyers agree the same $18 million price for the same business. Depending on how the deferred consideration is structured, the cash the buyer needs at close is $9 million, $5 million, or $3 million. The price never changed.
Read More
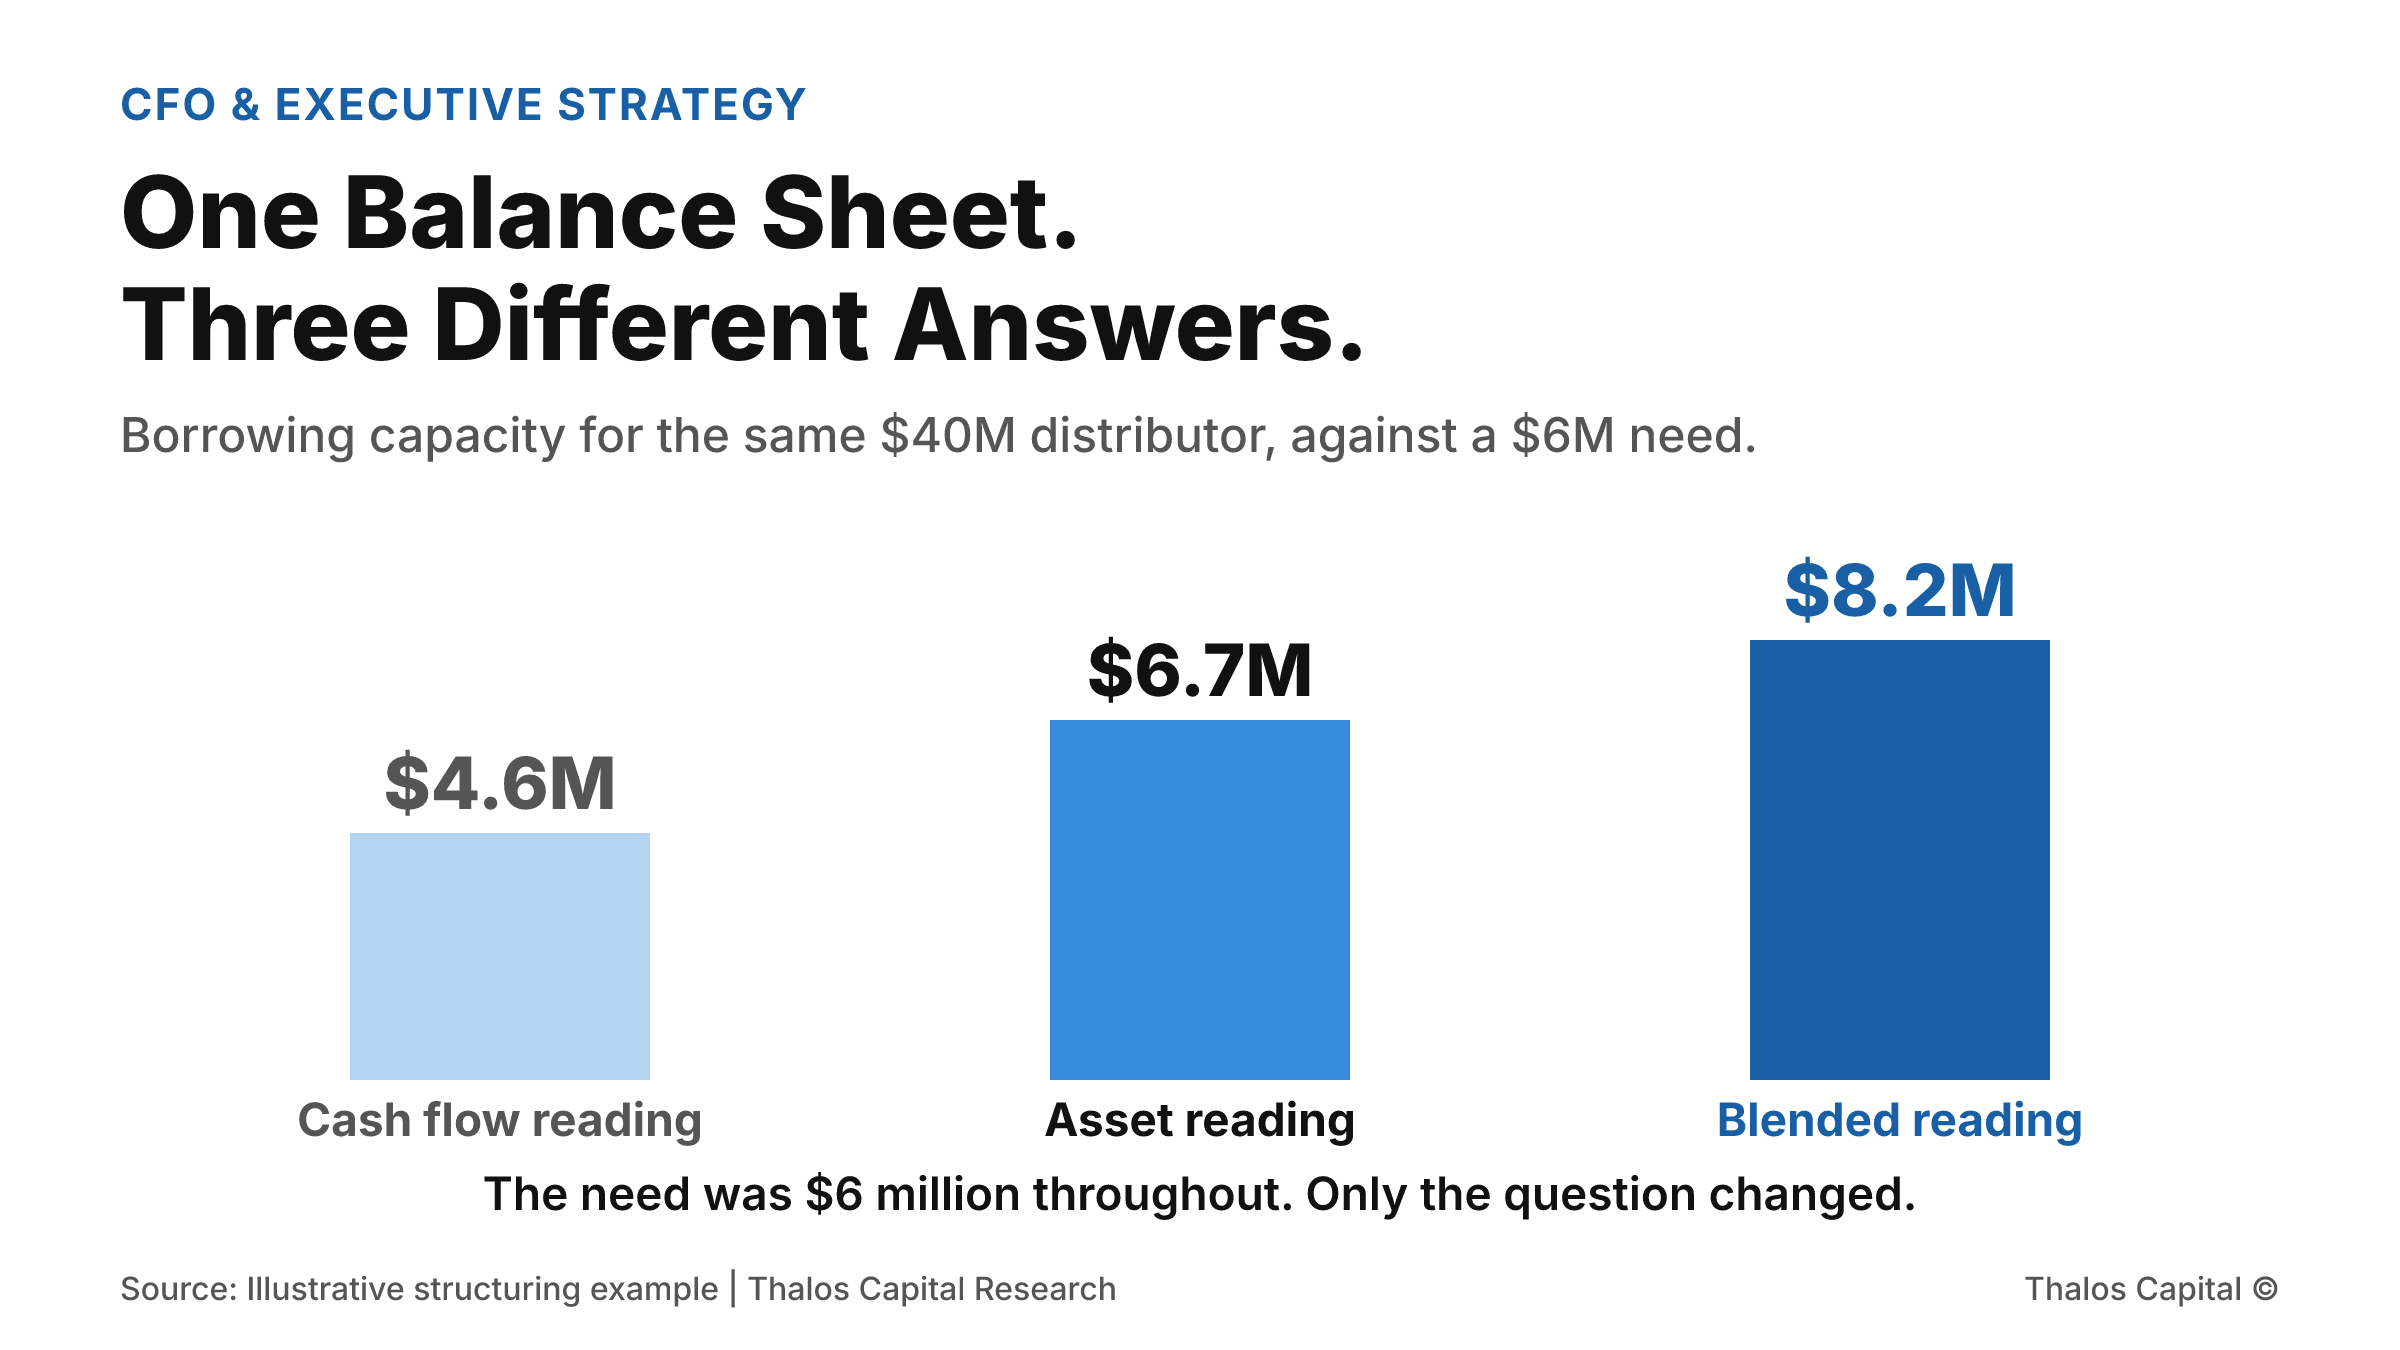
Column chart showing three borrowing capacity readings for the same distributor: $4.6 million on a cash flow reading, $6.7 million on an asset reading, and $8.2 million on a blended reading shown in the darkest navy, against a $6 million financing need.

One Balance Sheet. Three Different Answers.

A distributor doing $40 million in revenue needs $6 million. Read against cash flow it is short. Read against its assets it clears. Read as a blend it borrows $8.2 million. Same company, same week, three answers.
Read More
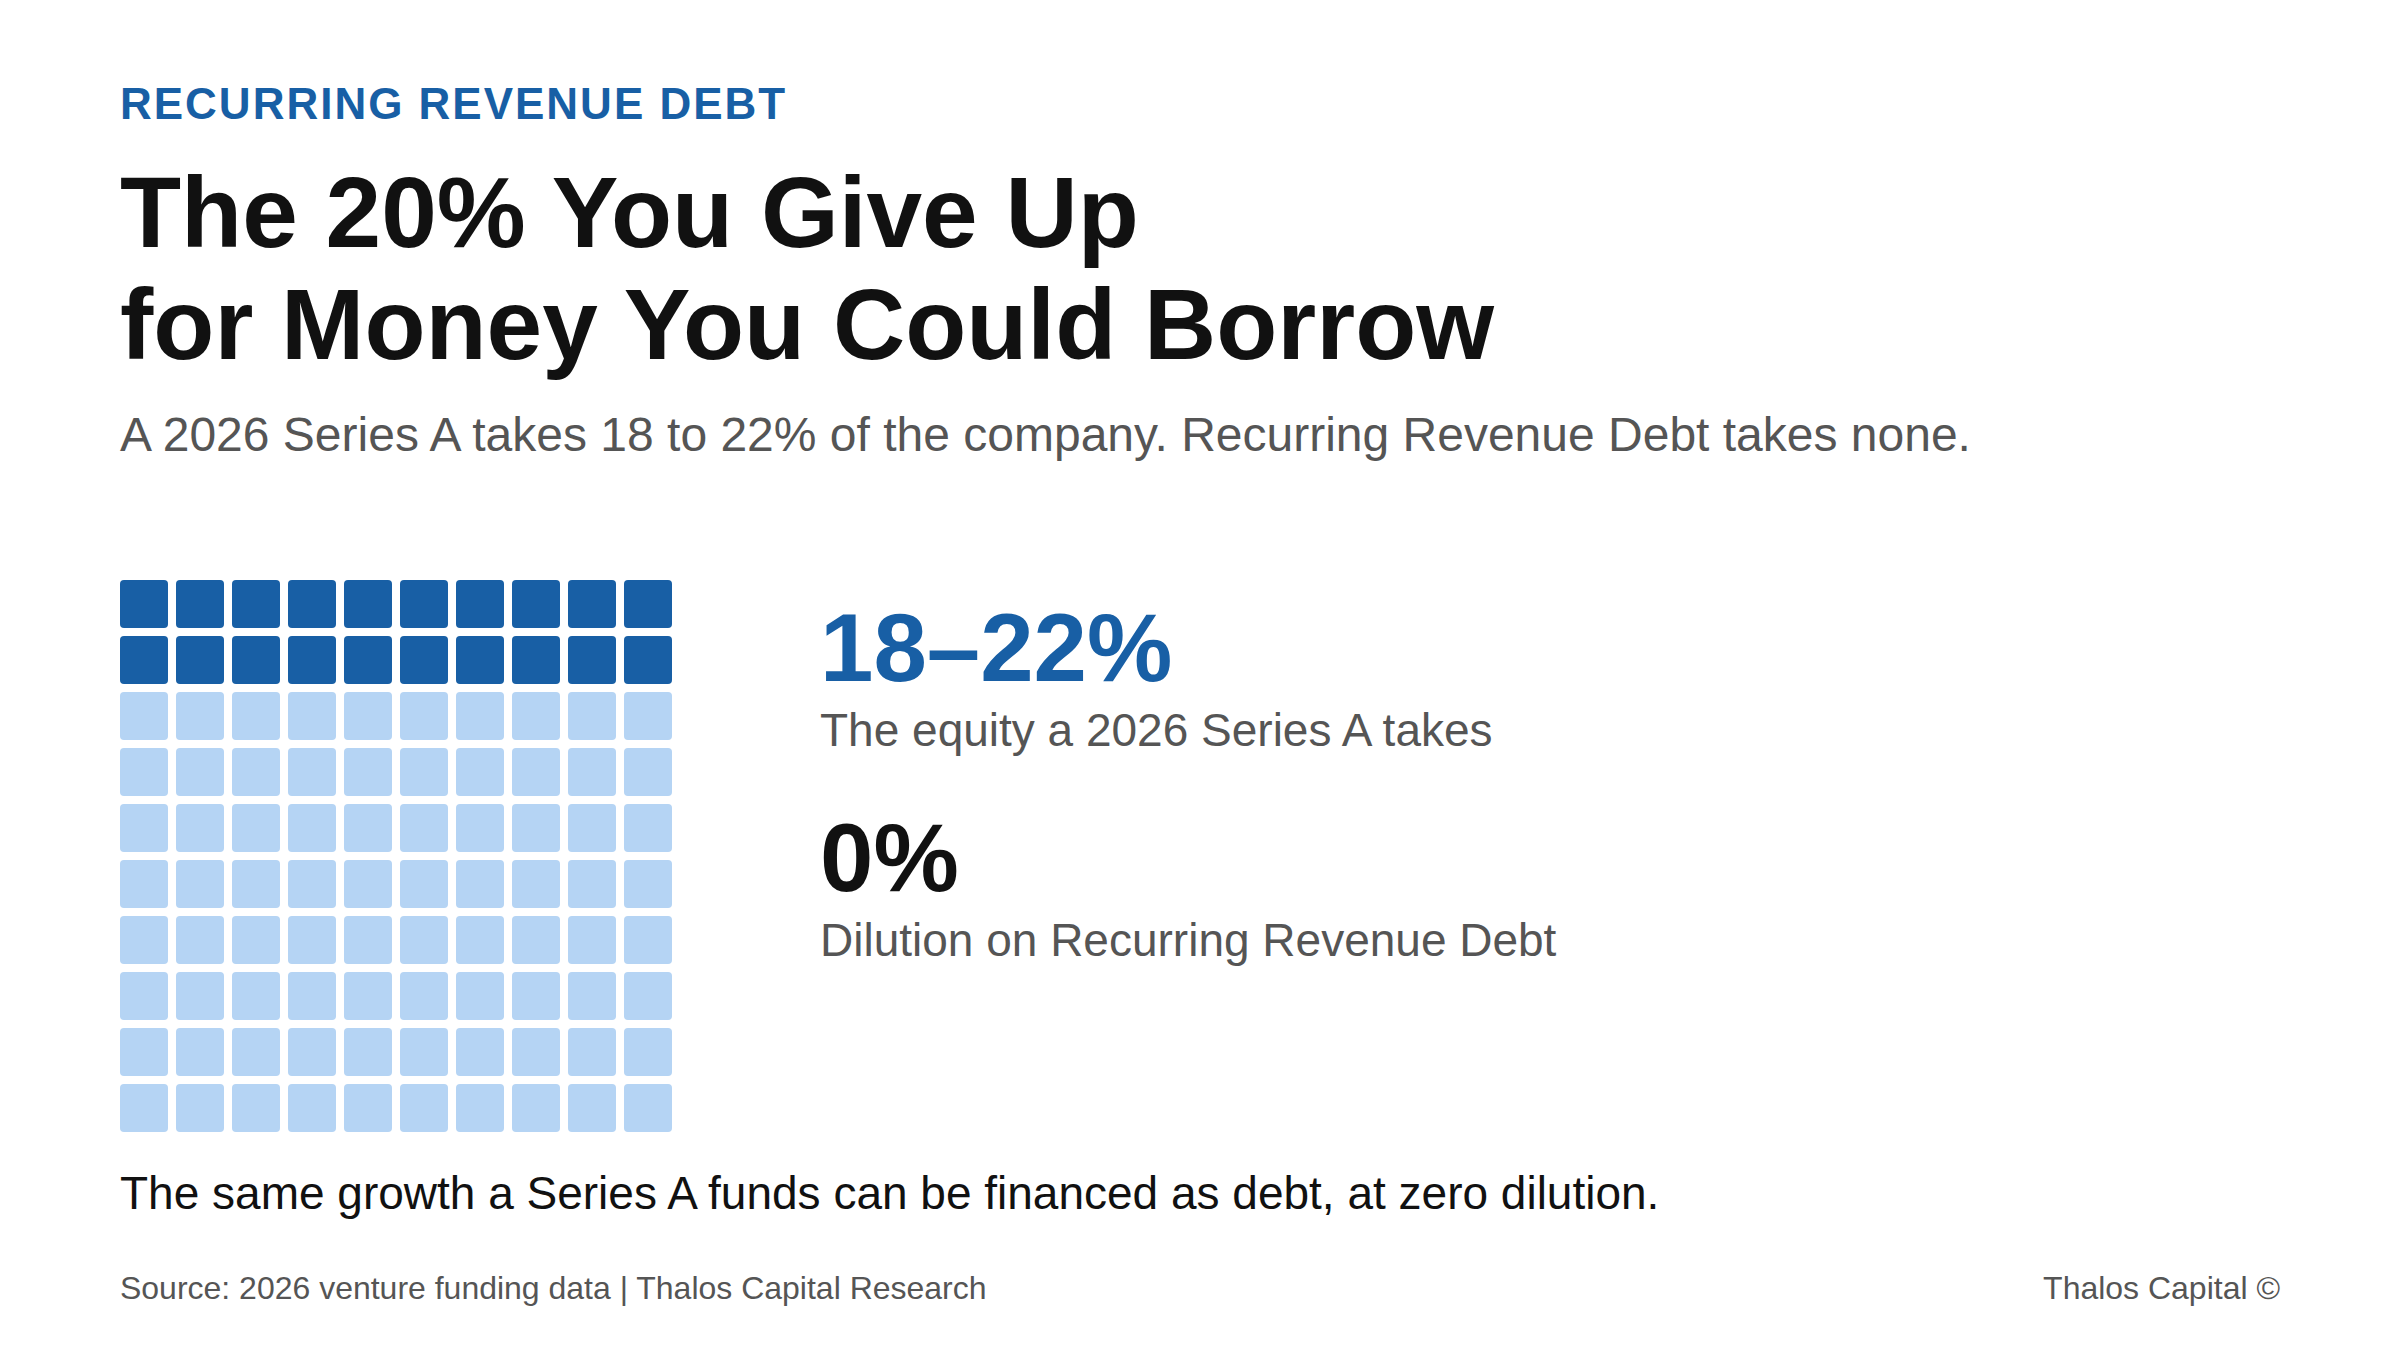
Waffle grid of 100 squares with 20 shaded navy, showing the 18 to 22 percent equity a 2026 Series A takes versus 0 percent dilution on Recurring Revenue Debt.

The 20% You Give Up for Money You Could Borrow: The Series A Math Founders Skip

A 2026 Series A takes 18 to 22% of the company at a reset valuation. For a recurring-revenue business that already clears the revenue bar, that dilution is a choice, not a requirement.
Read More
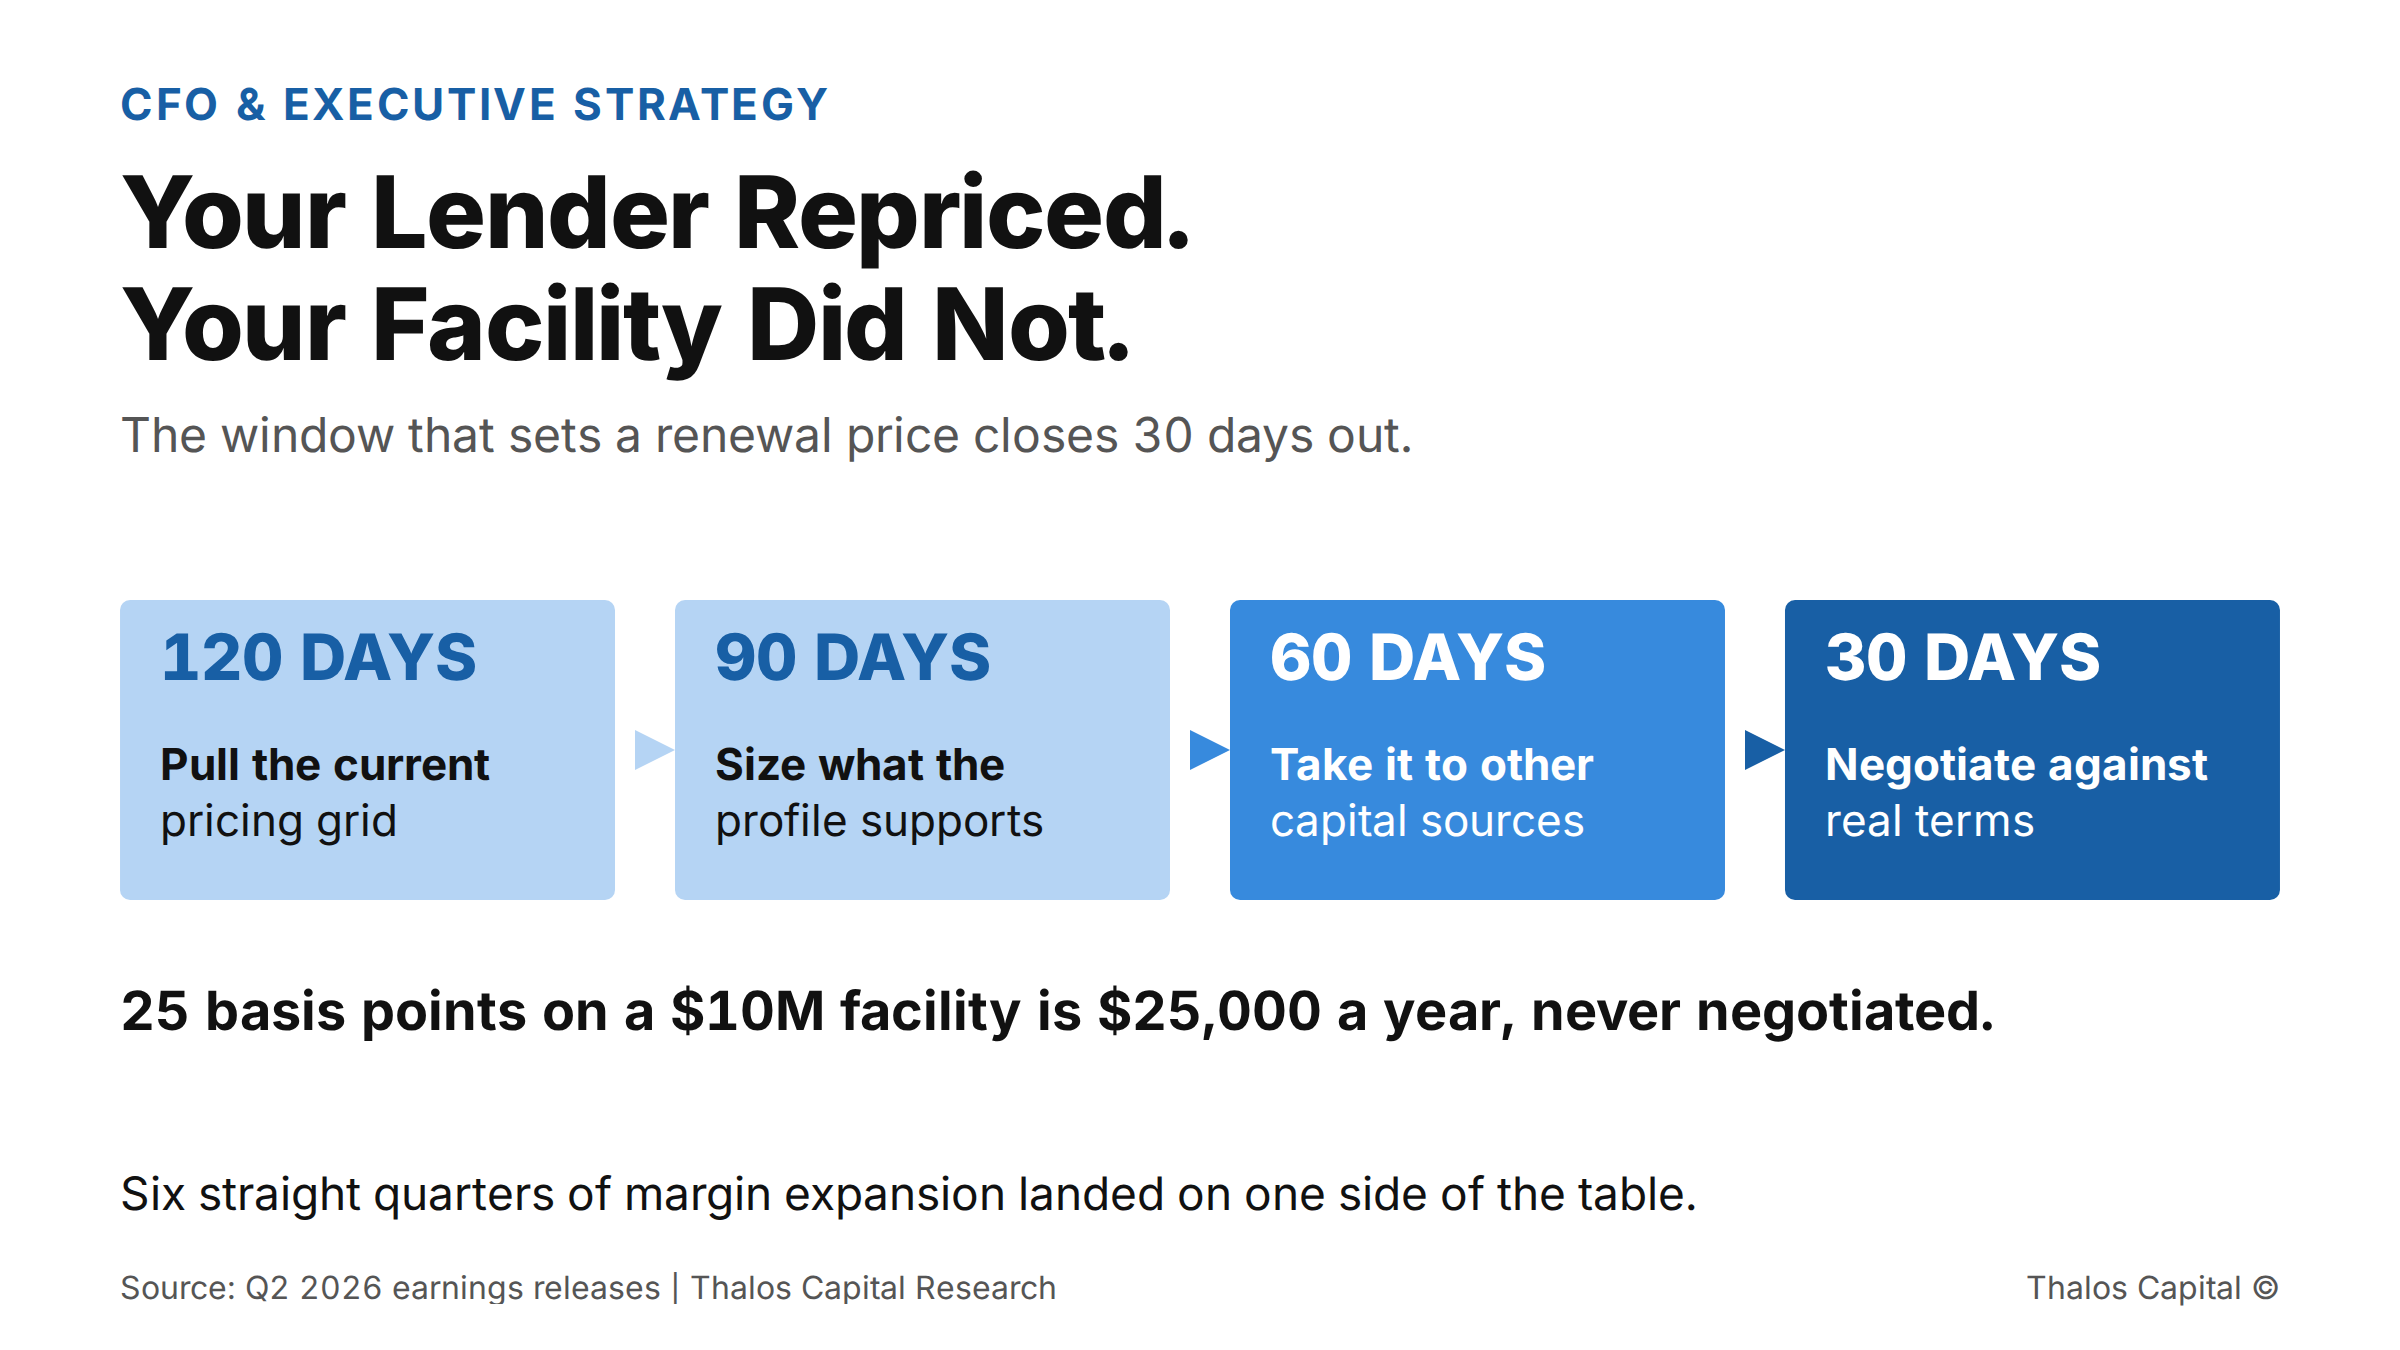
A four stage renewal sequence running from 120 days before maturity to 30 days, ending with a note that 25 basis points on a $10 million facility is $25,000 a year.

Six Straight Quarters of Margin Expansion Went to the Lender. Your Renewal Did Not Reprice.

Regional lenders posted a sixth straight quarter of margin expansion. Borrower pricing does not move with it. What an untested 25 basis point renewal gap actually costs, and the 120 day sequence that changes it.
Read More
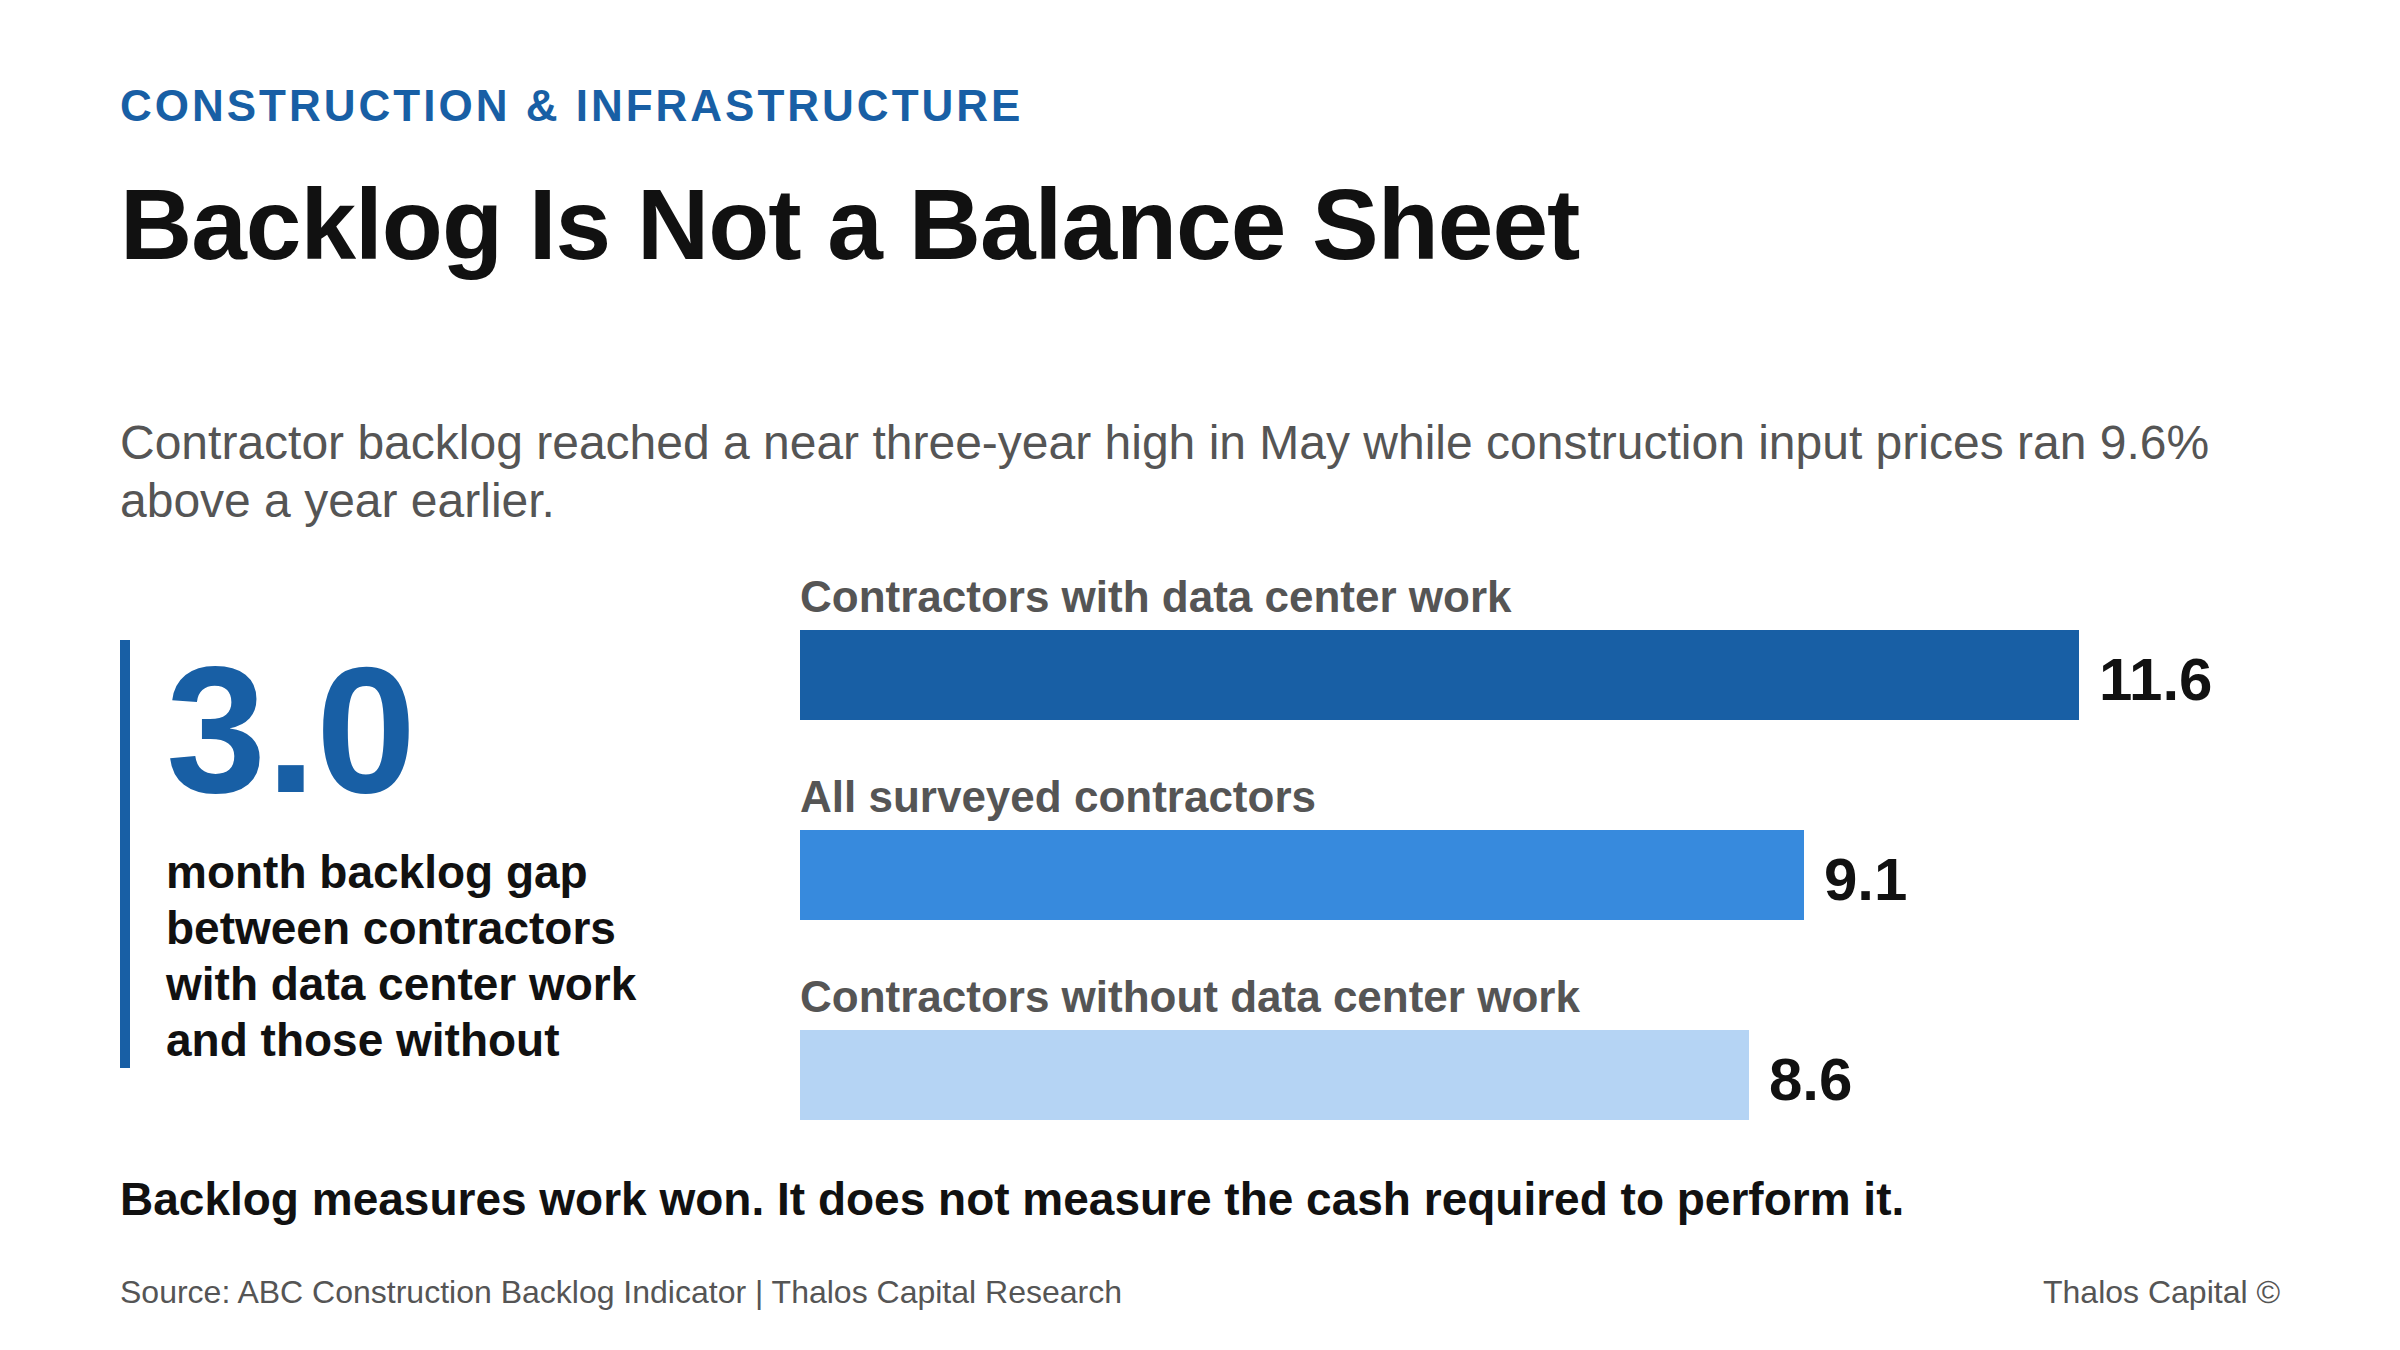
Horizontal bar chart of May 2026 construction backlog in months, showing 11.6 months for contractors with data center work, 9.1 months across all surveyed contractors, and 8.6 months for contractors without data center work, a three-month gap.

Construction Backlog Is Not a Balance Sheet

Contractor backlog hit a near three-year high while input prices ran 9.6% above a year earlier. Why a full order book is a financing liability before it is an asset, and how to structure against it.
Read More
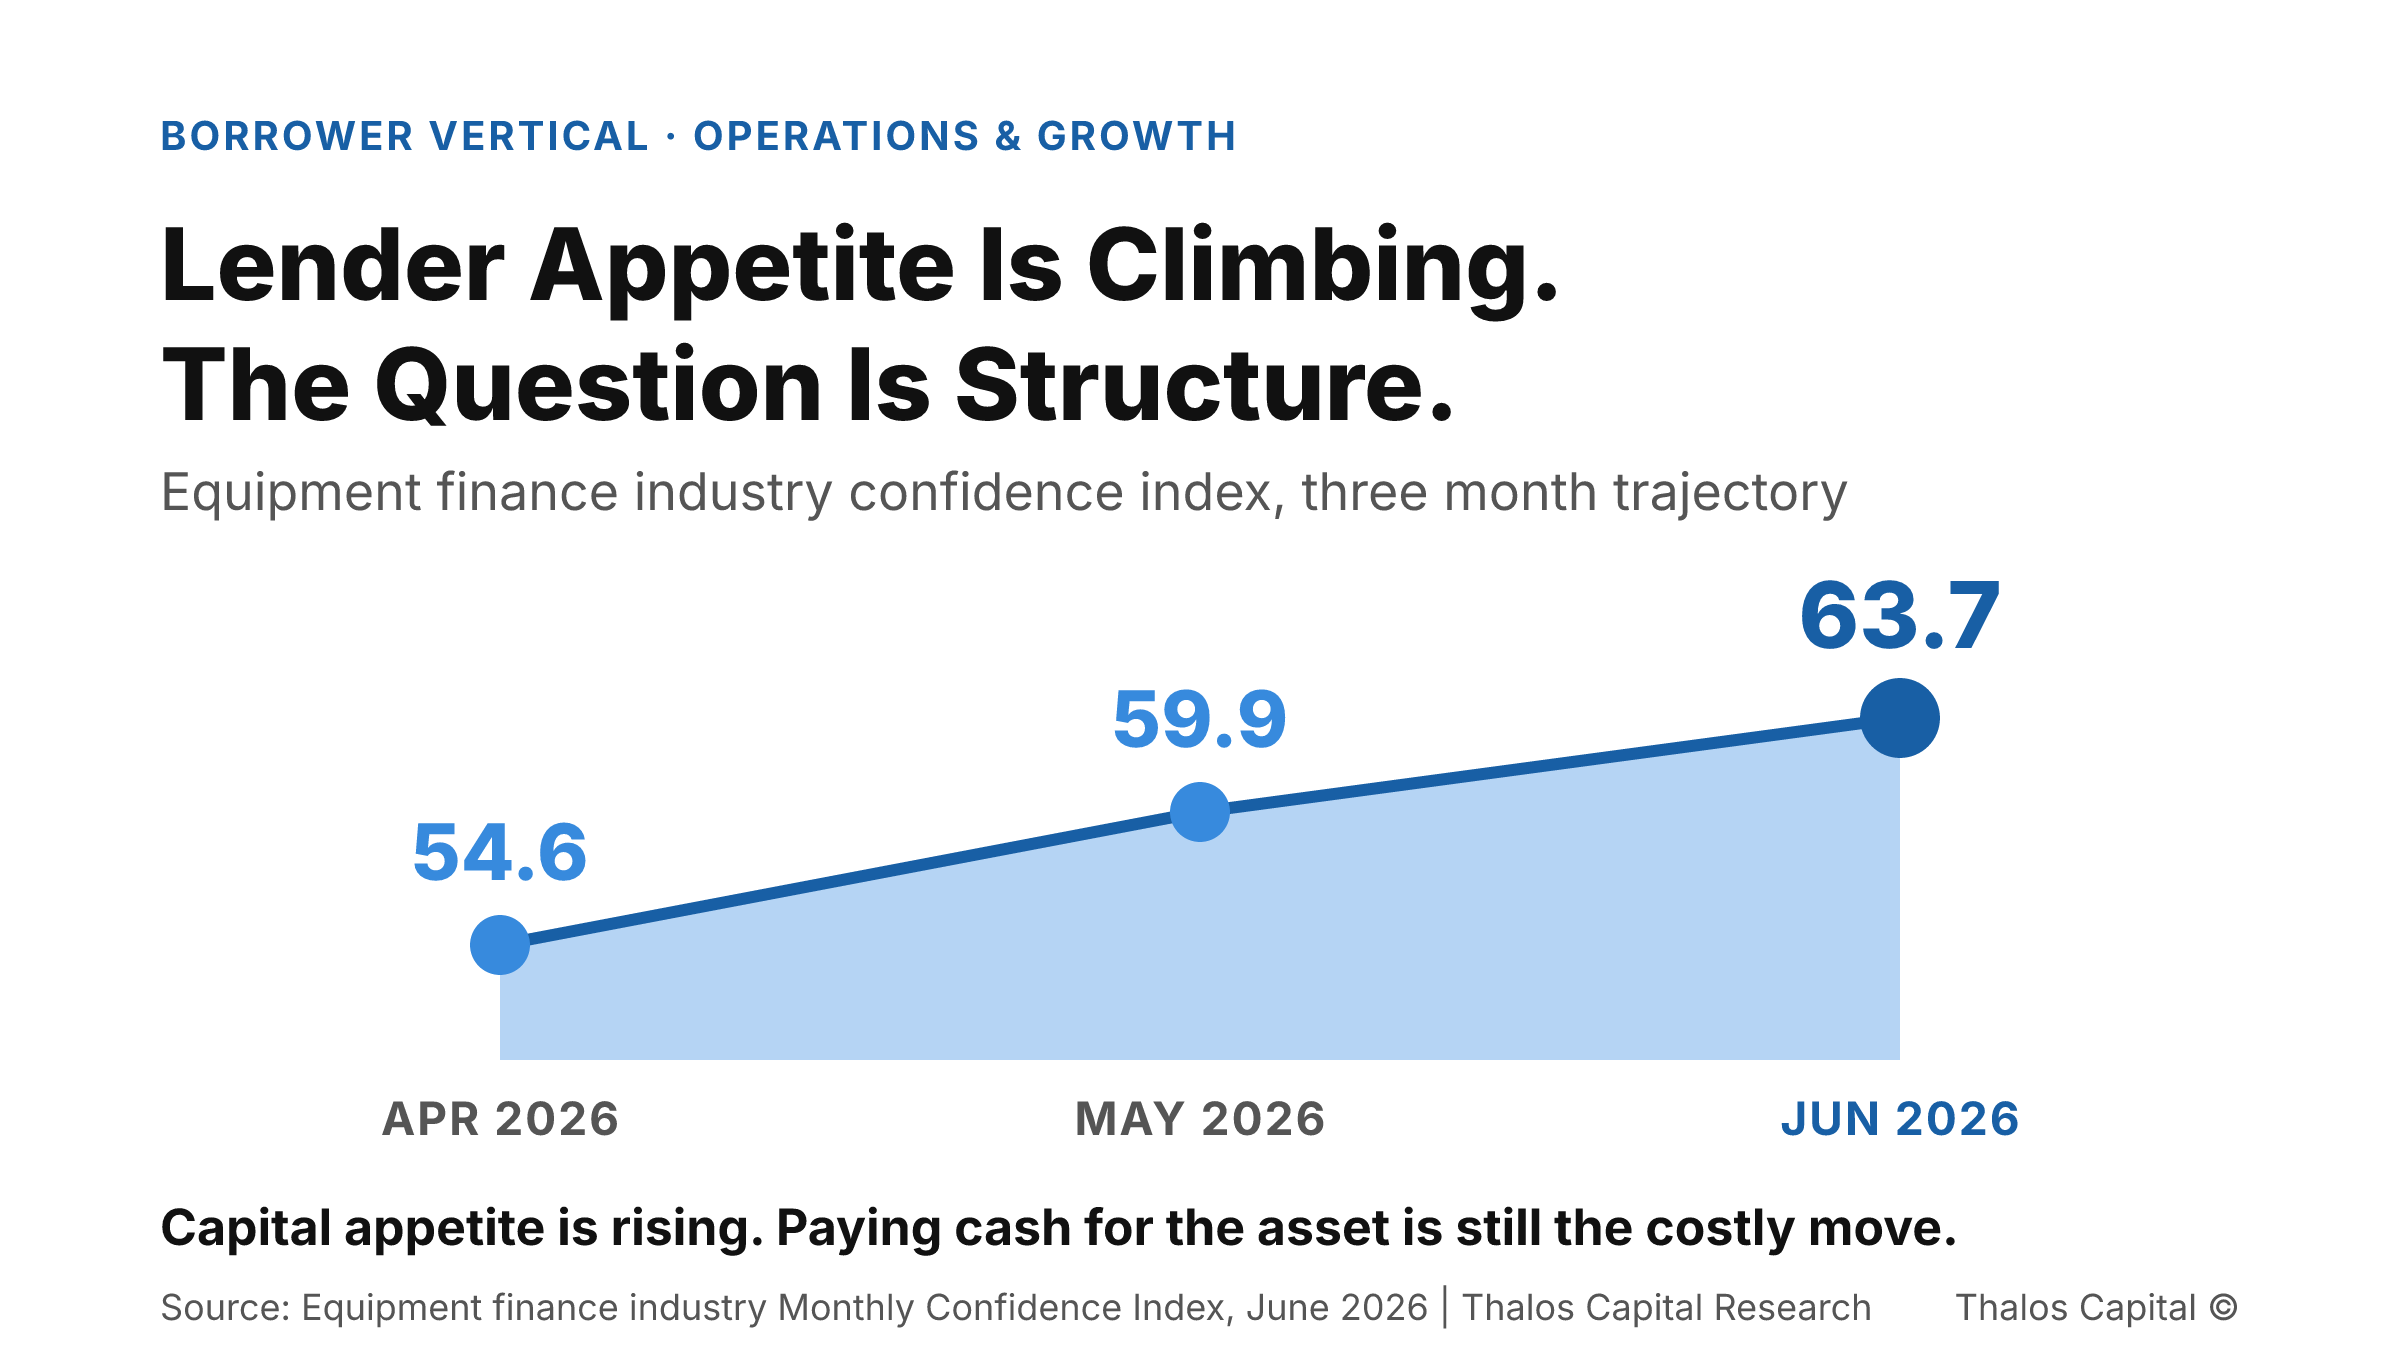
Filled area trend chart showing the equipment finance industry monthly confidence index climbing from 54.6 in April 2026 to 59.9 in May to 63.7 in June.

Paying Cash for Equipment Is Not the Conservative Move. It Is the Expensive One.

Capex demand is rising into a working capital squeeze. Why paying cash for equipment is the expensive move, and how layering the structure preserves the liquidity growth consumes.
Read More
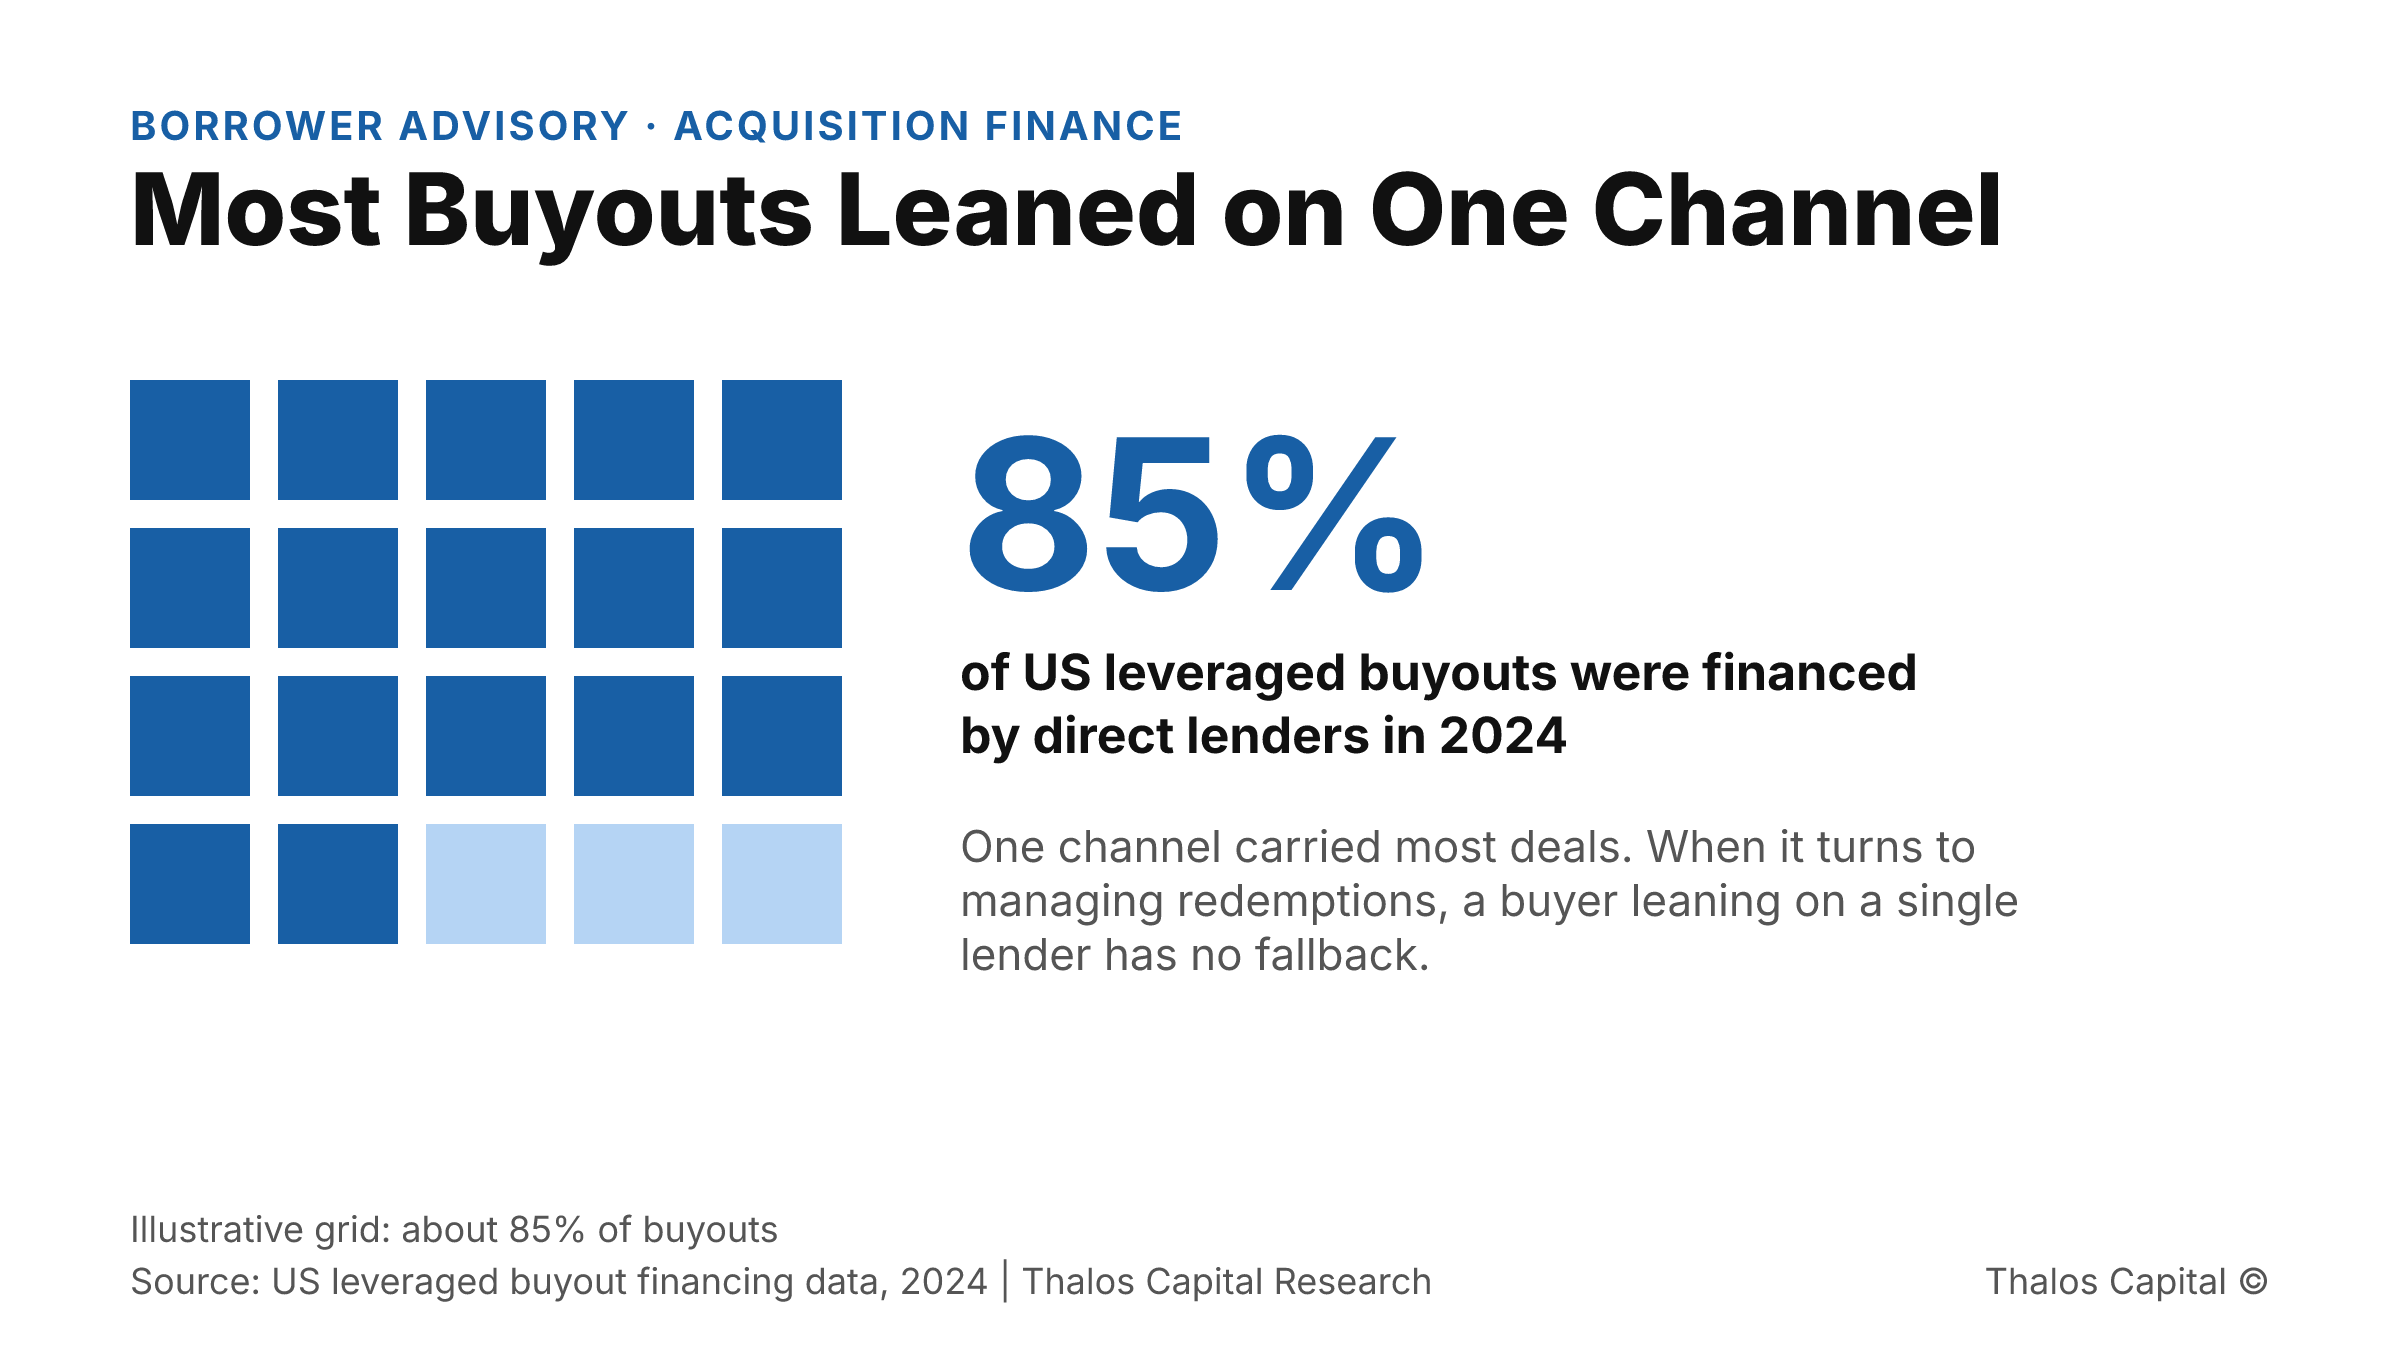
Grid of 20 squares with 17 filled in Thalos navy, illustrating that direct lenders financed about 85% of US leveraged buyouts in 2024.

The Single-Lender Acquisition Is Narrowing Just as Deal Flow Returns

Private credit redemptions jumped 217% in a quarter. For acquirers leaning on one lender, the risk is no longer deal supply, it is certainty of close. Here is the defense.
Read More
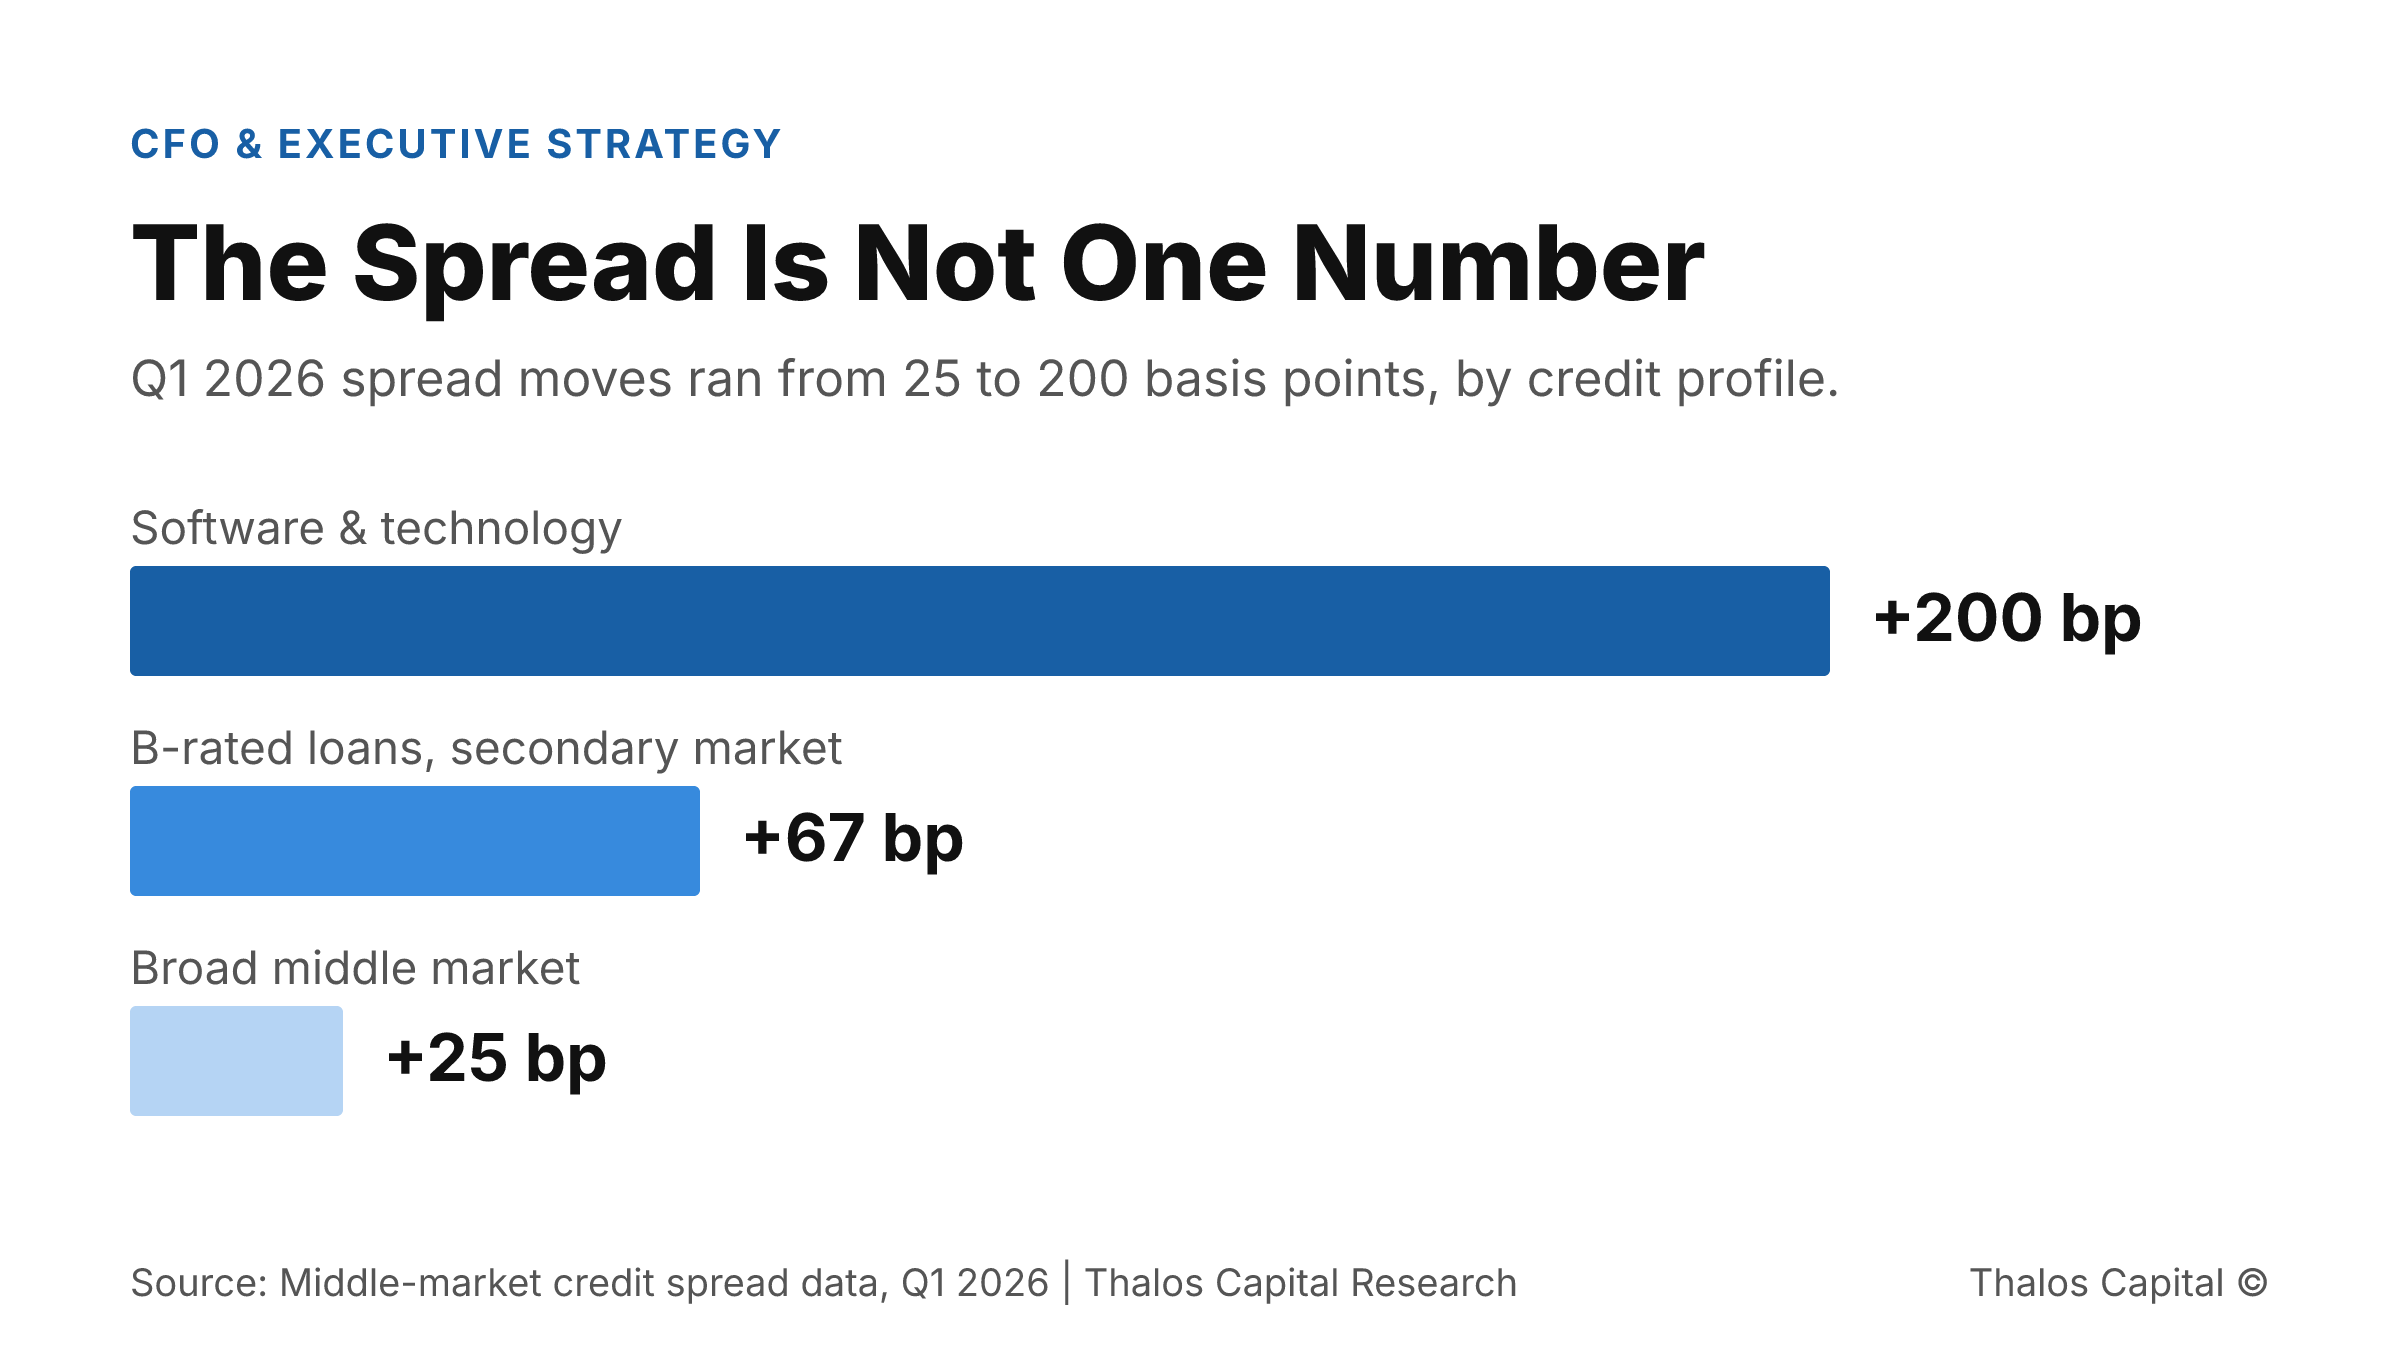
Horizontal bar chart of Q1 2026 middle-market spread moves of 25, 67, and 200 basis points by credit profile.

Lowest Rate, Worst Deal: Why Structure Beats Spread in This Credit Market

The cheapest quoted rate is rarely the lowest cost of capital. With Q1 2026 spreads ranging 25 to 200 bp, structure, not headline spread, decides what a facility actually costs.
Read More
Working through a financing decision?
Insights are a starting point. A conversation maps your actual options.
Tell us what you are financing and we will map the structures and sources that fit.
Submit your financing request →
Explore our financing solutions
Equipment FinancingWorking CapitalAsset-Based LendingStrategic Debt