Category

Capital Markets & Trends

25 insights · page 2 of 4

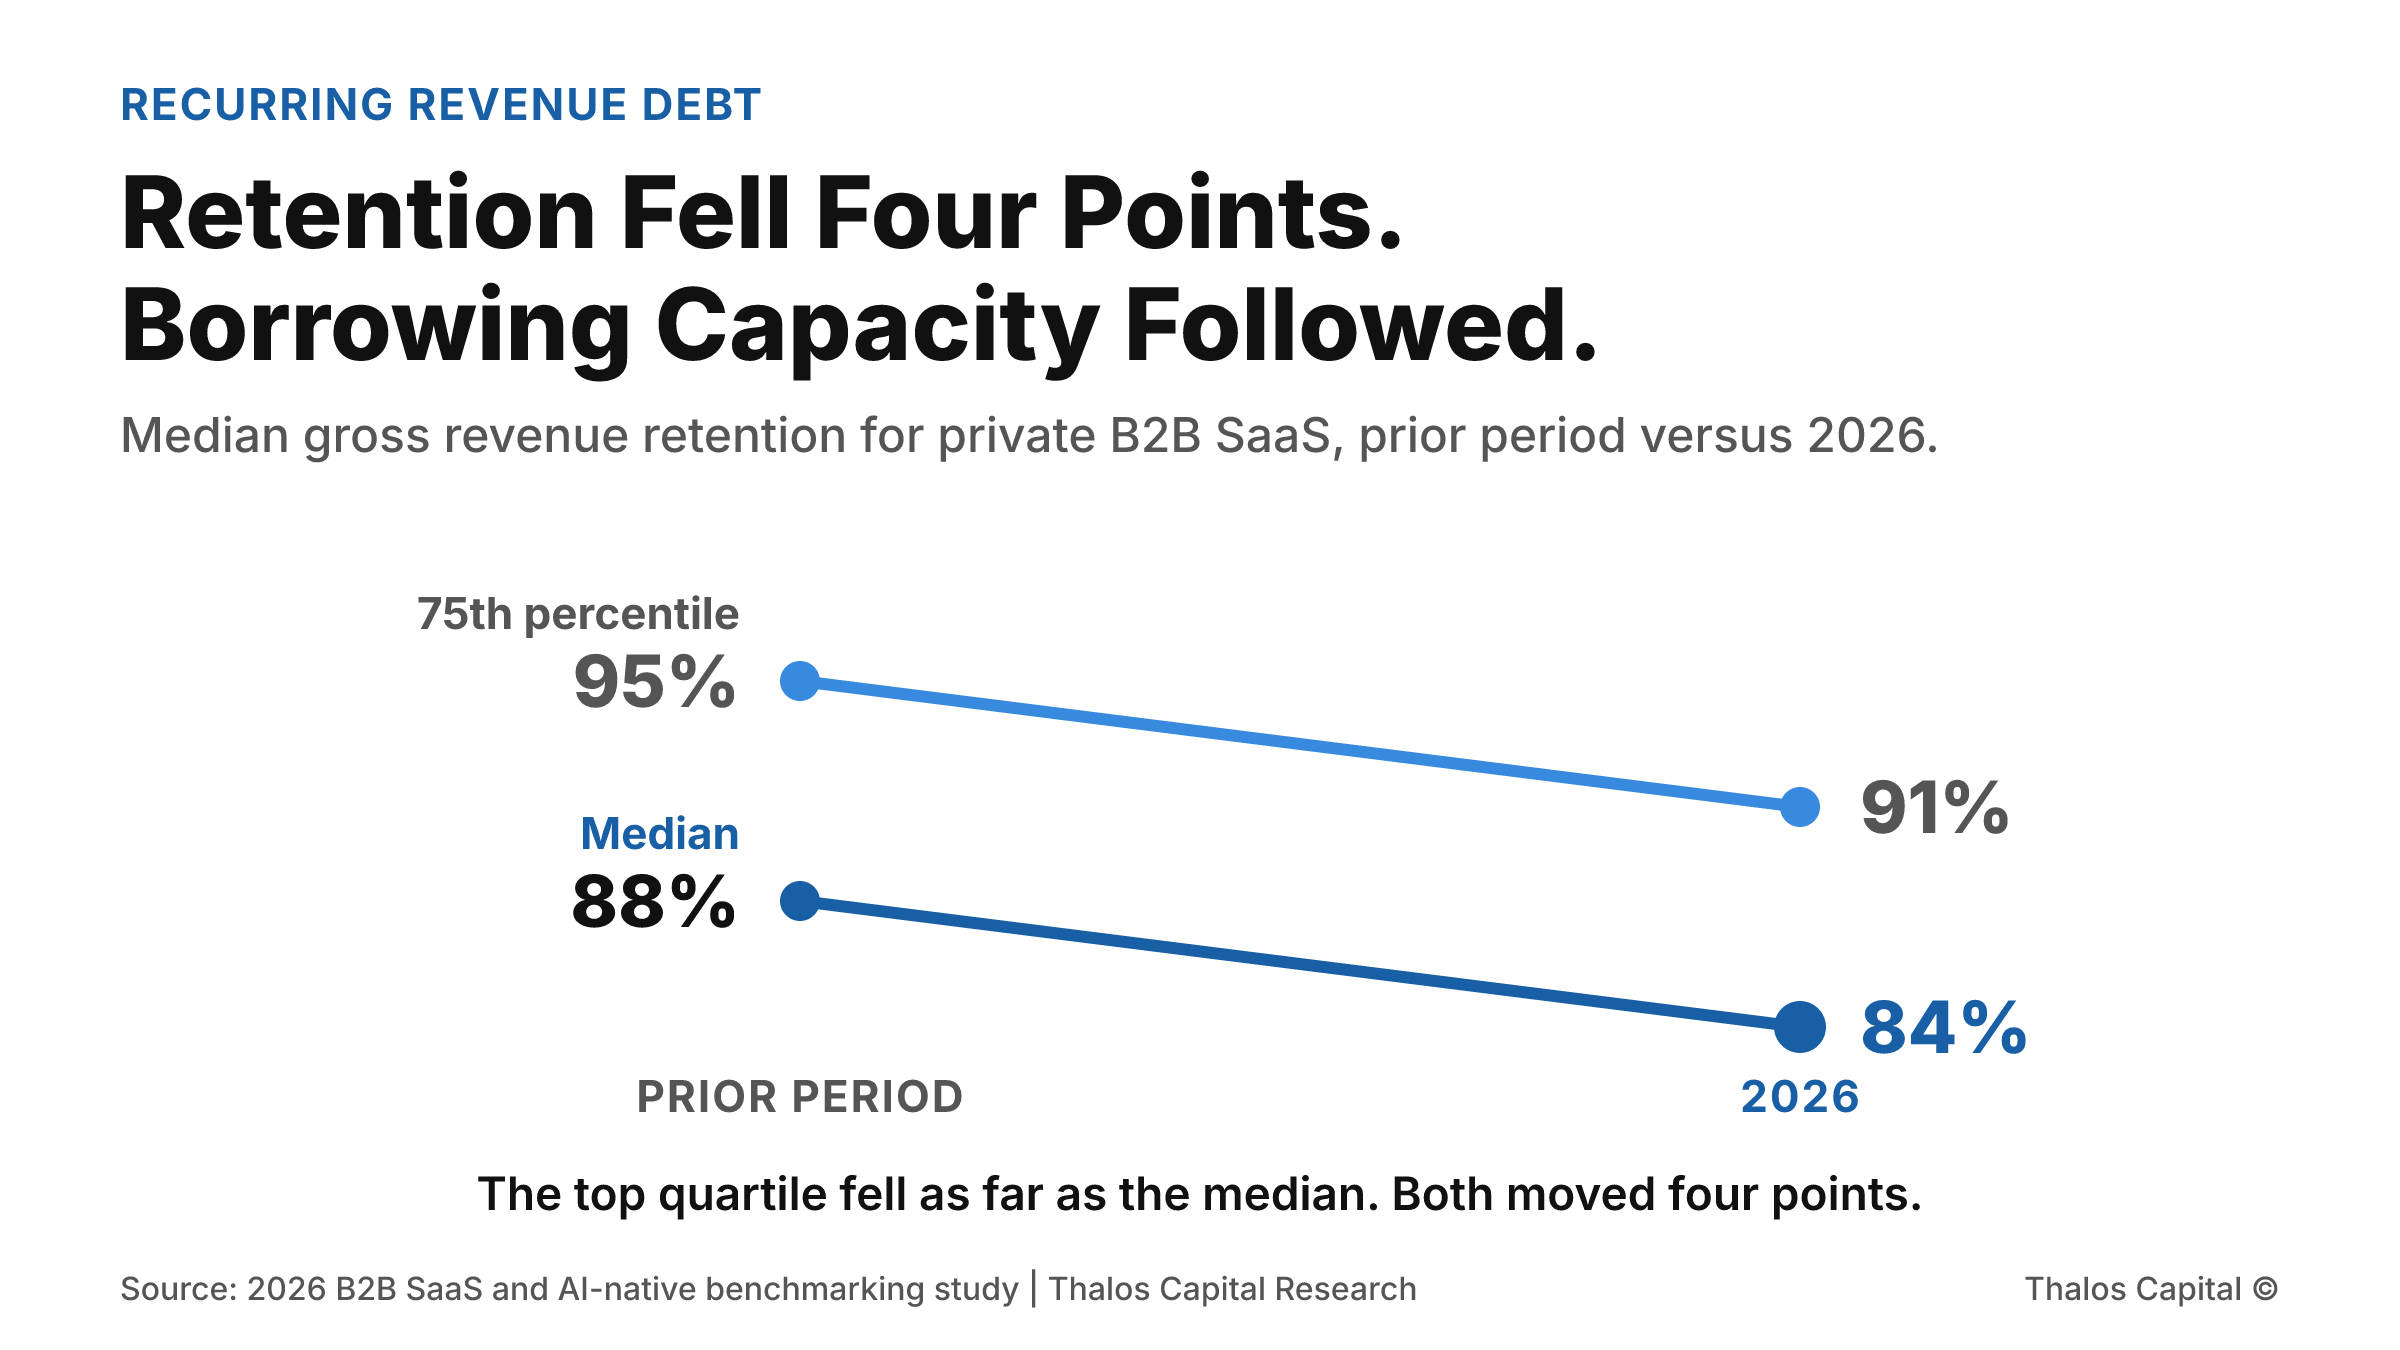
Slope chart comparing gross revenue retention for private B2B SaaS between the prior period and 2026, showing the median falling from 88 percent to 84 percent and the 75th percentile falling from 95 percent to 91 percent, both lines down four points.

Retention Fell Four Points. Your Borrowing Capacity Followed.

Median gross revenue retention for private B2B SaaS fell from 88 to 84 percent in 2026, and the top quartile fell just as far. For a company planning to borrow against contracted revenue, that four point move is a borrowing base question.
Read More
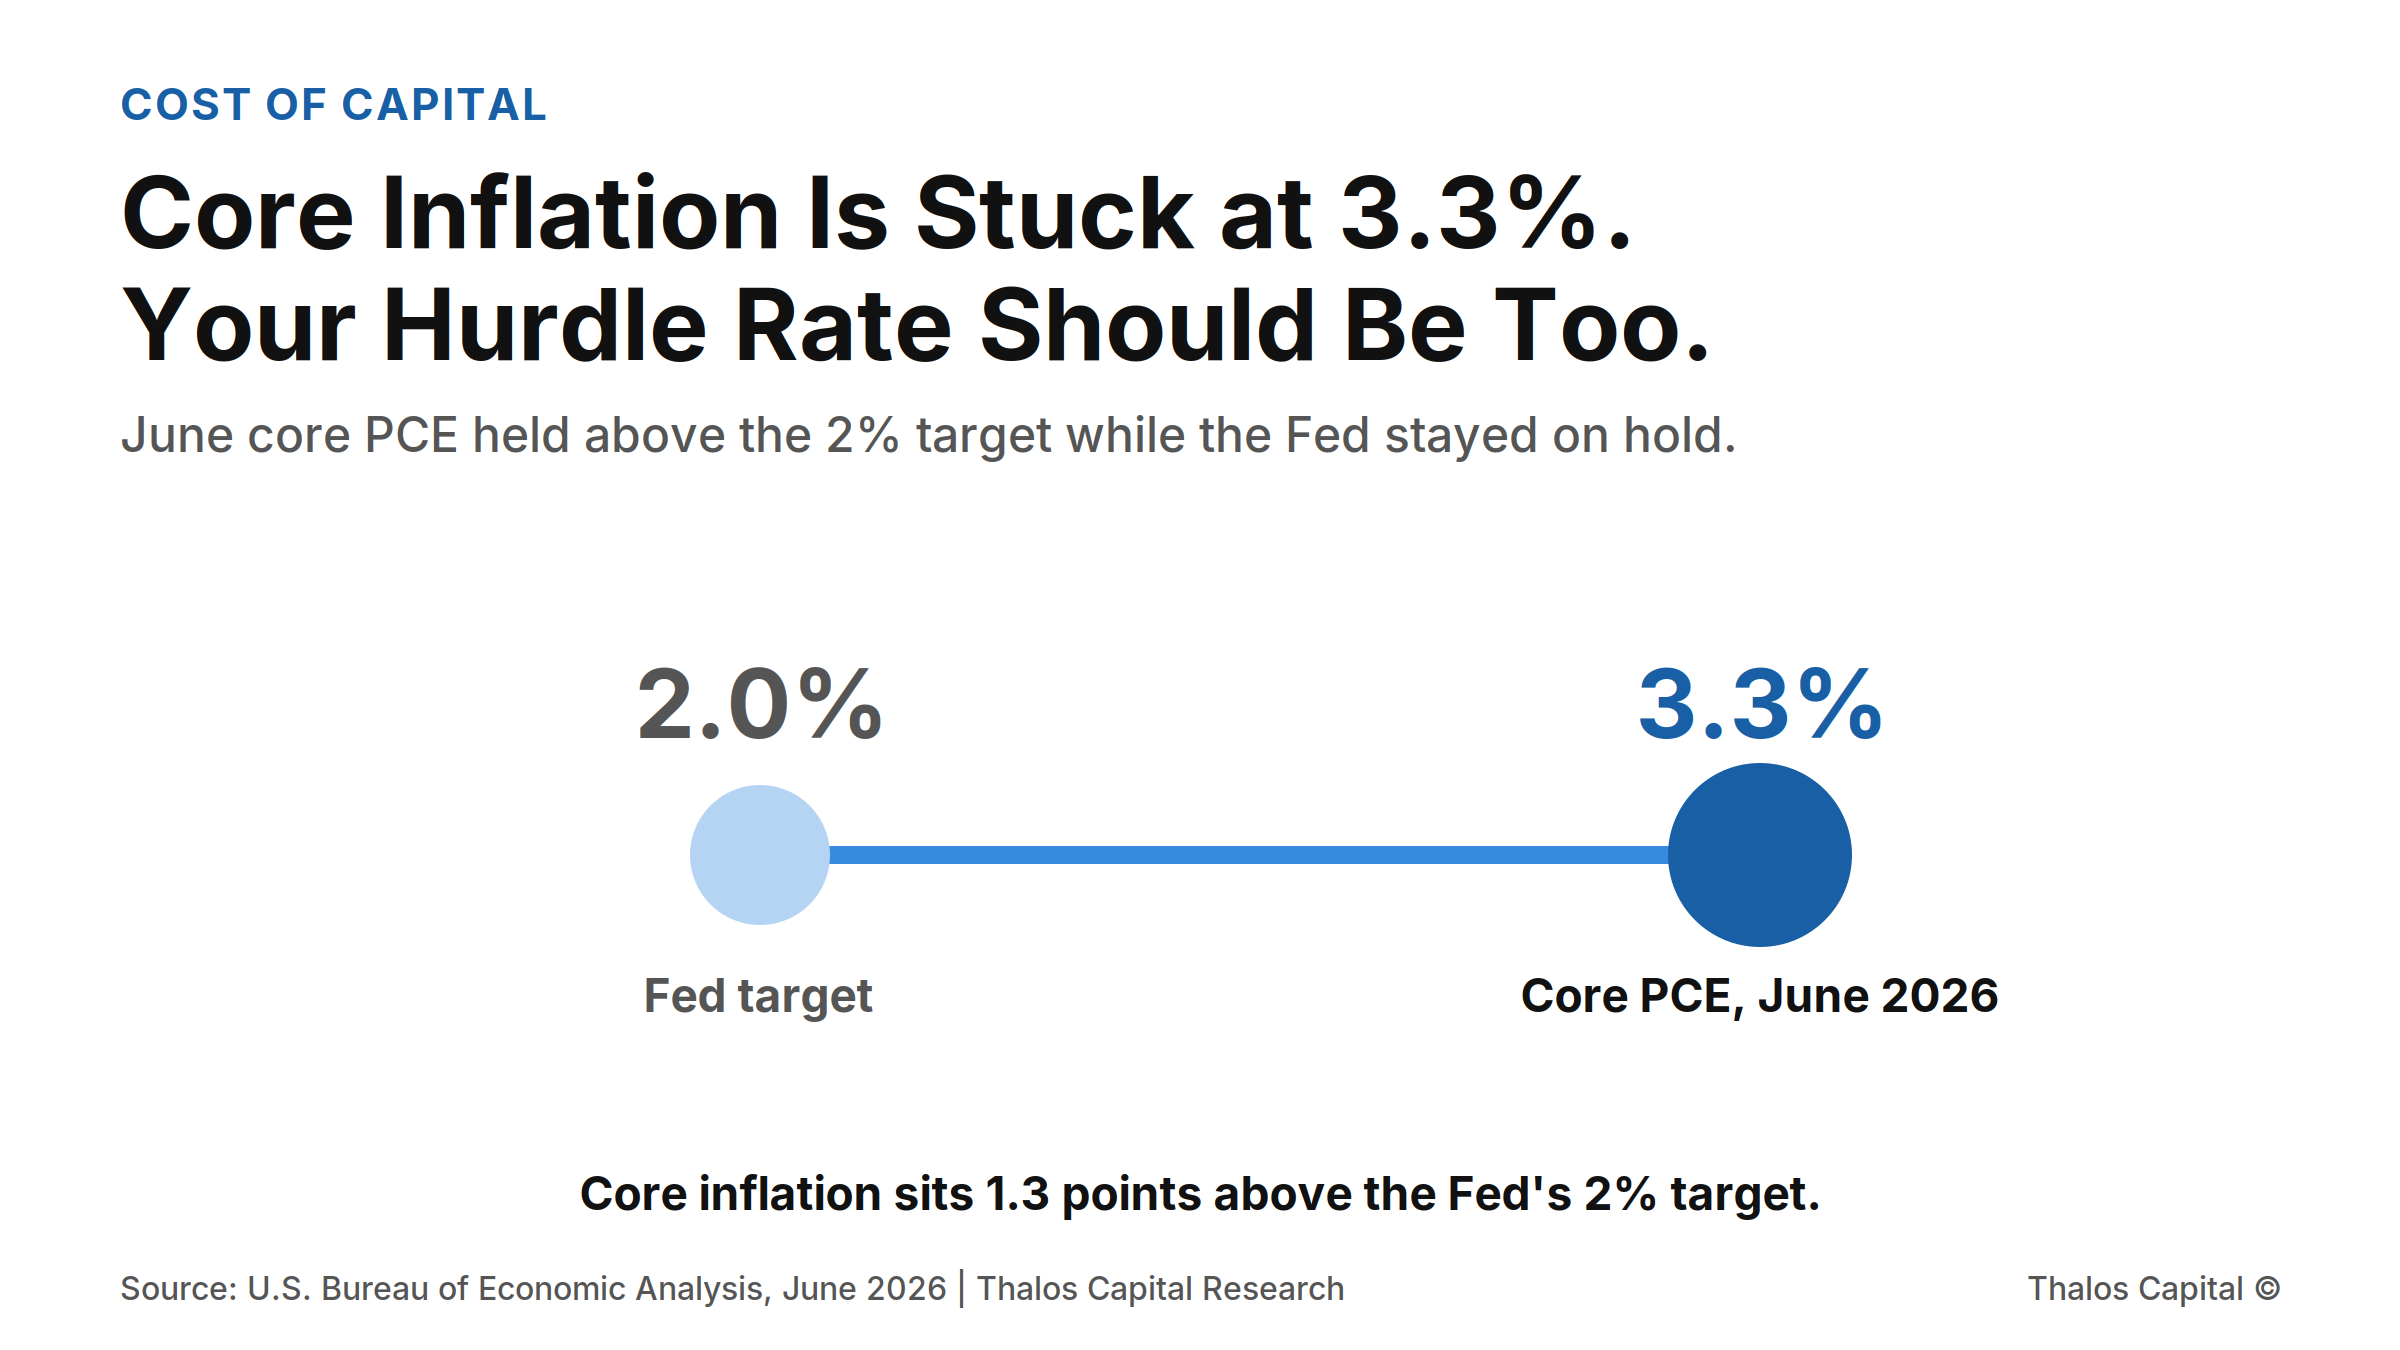
Dumbbell chart contrasting the Federal Reserve's 2 percent inflation target with June 2026 core PCE at 3.3 percent, a gap of 1.3 points, with the 3.3 percent marker shown in navy.

Core Inflation Is Stuck at 3.3 Percent. Your Hurdle Rate Should Be Too.

June core PCE held at 3.3 percent, still above the Fed's 2 percent target, while the policy rate stayed at 3.50 to 3.75 percent. Why a capital plan priced to a 2 percent world mismatches the cost of capital lenders are quoting today.
Read More
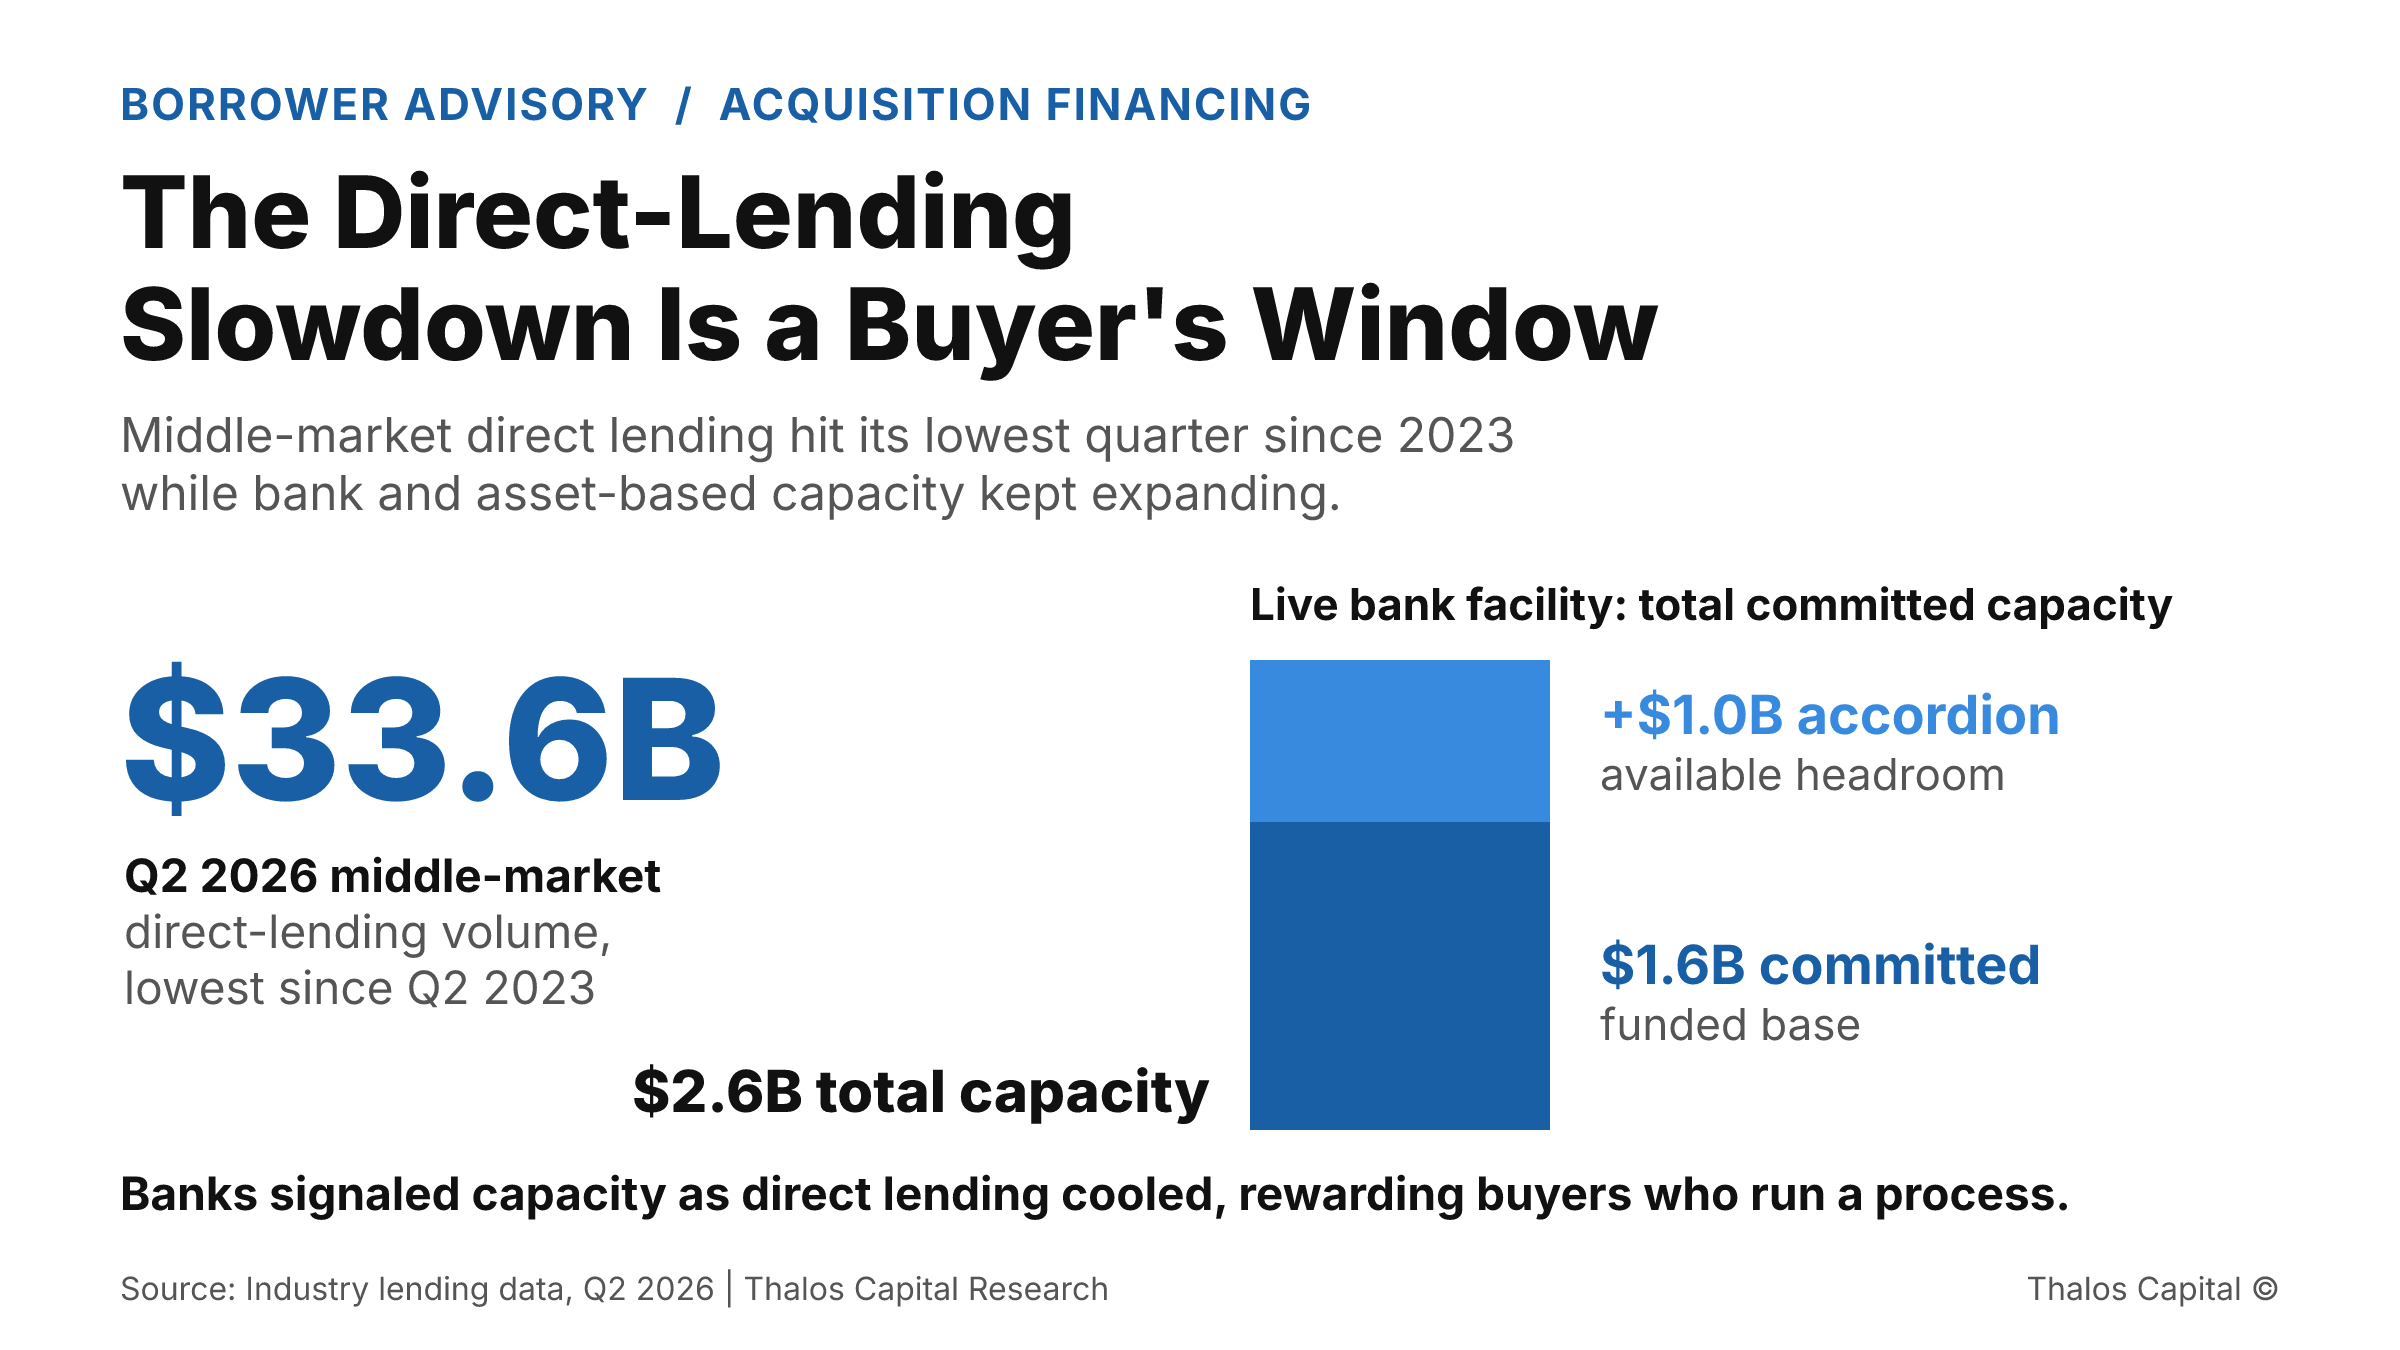
Cover showing Q2 2026 middle-market direct-lending volume of $33.6 billion, the lowest since Q2 2023, beside a stacked bar of a bank facility's $1.6 billion committed capacity plus a $1.0 billion accordion to $2.6 billion.

The Direct-Lending Slowdown Is a Buyer's Financing Window

Middle-market direct lending hit its lowest quarter since 2023 while bank and asset-based capacity expanded. Why the buyers who run a multi-source process capture the leverage.
Read More
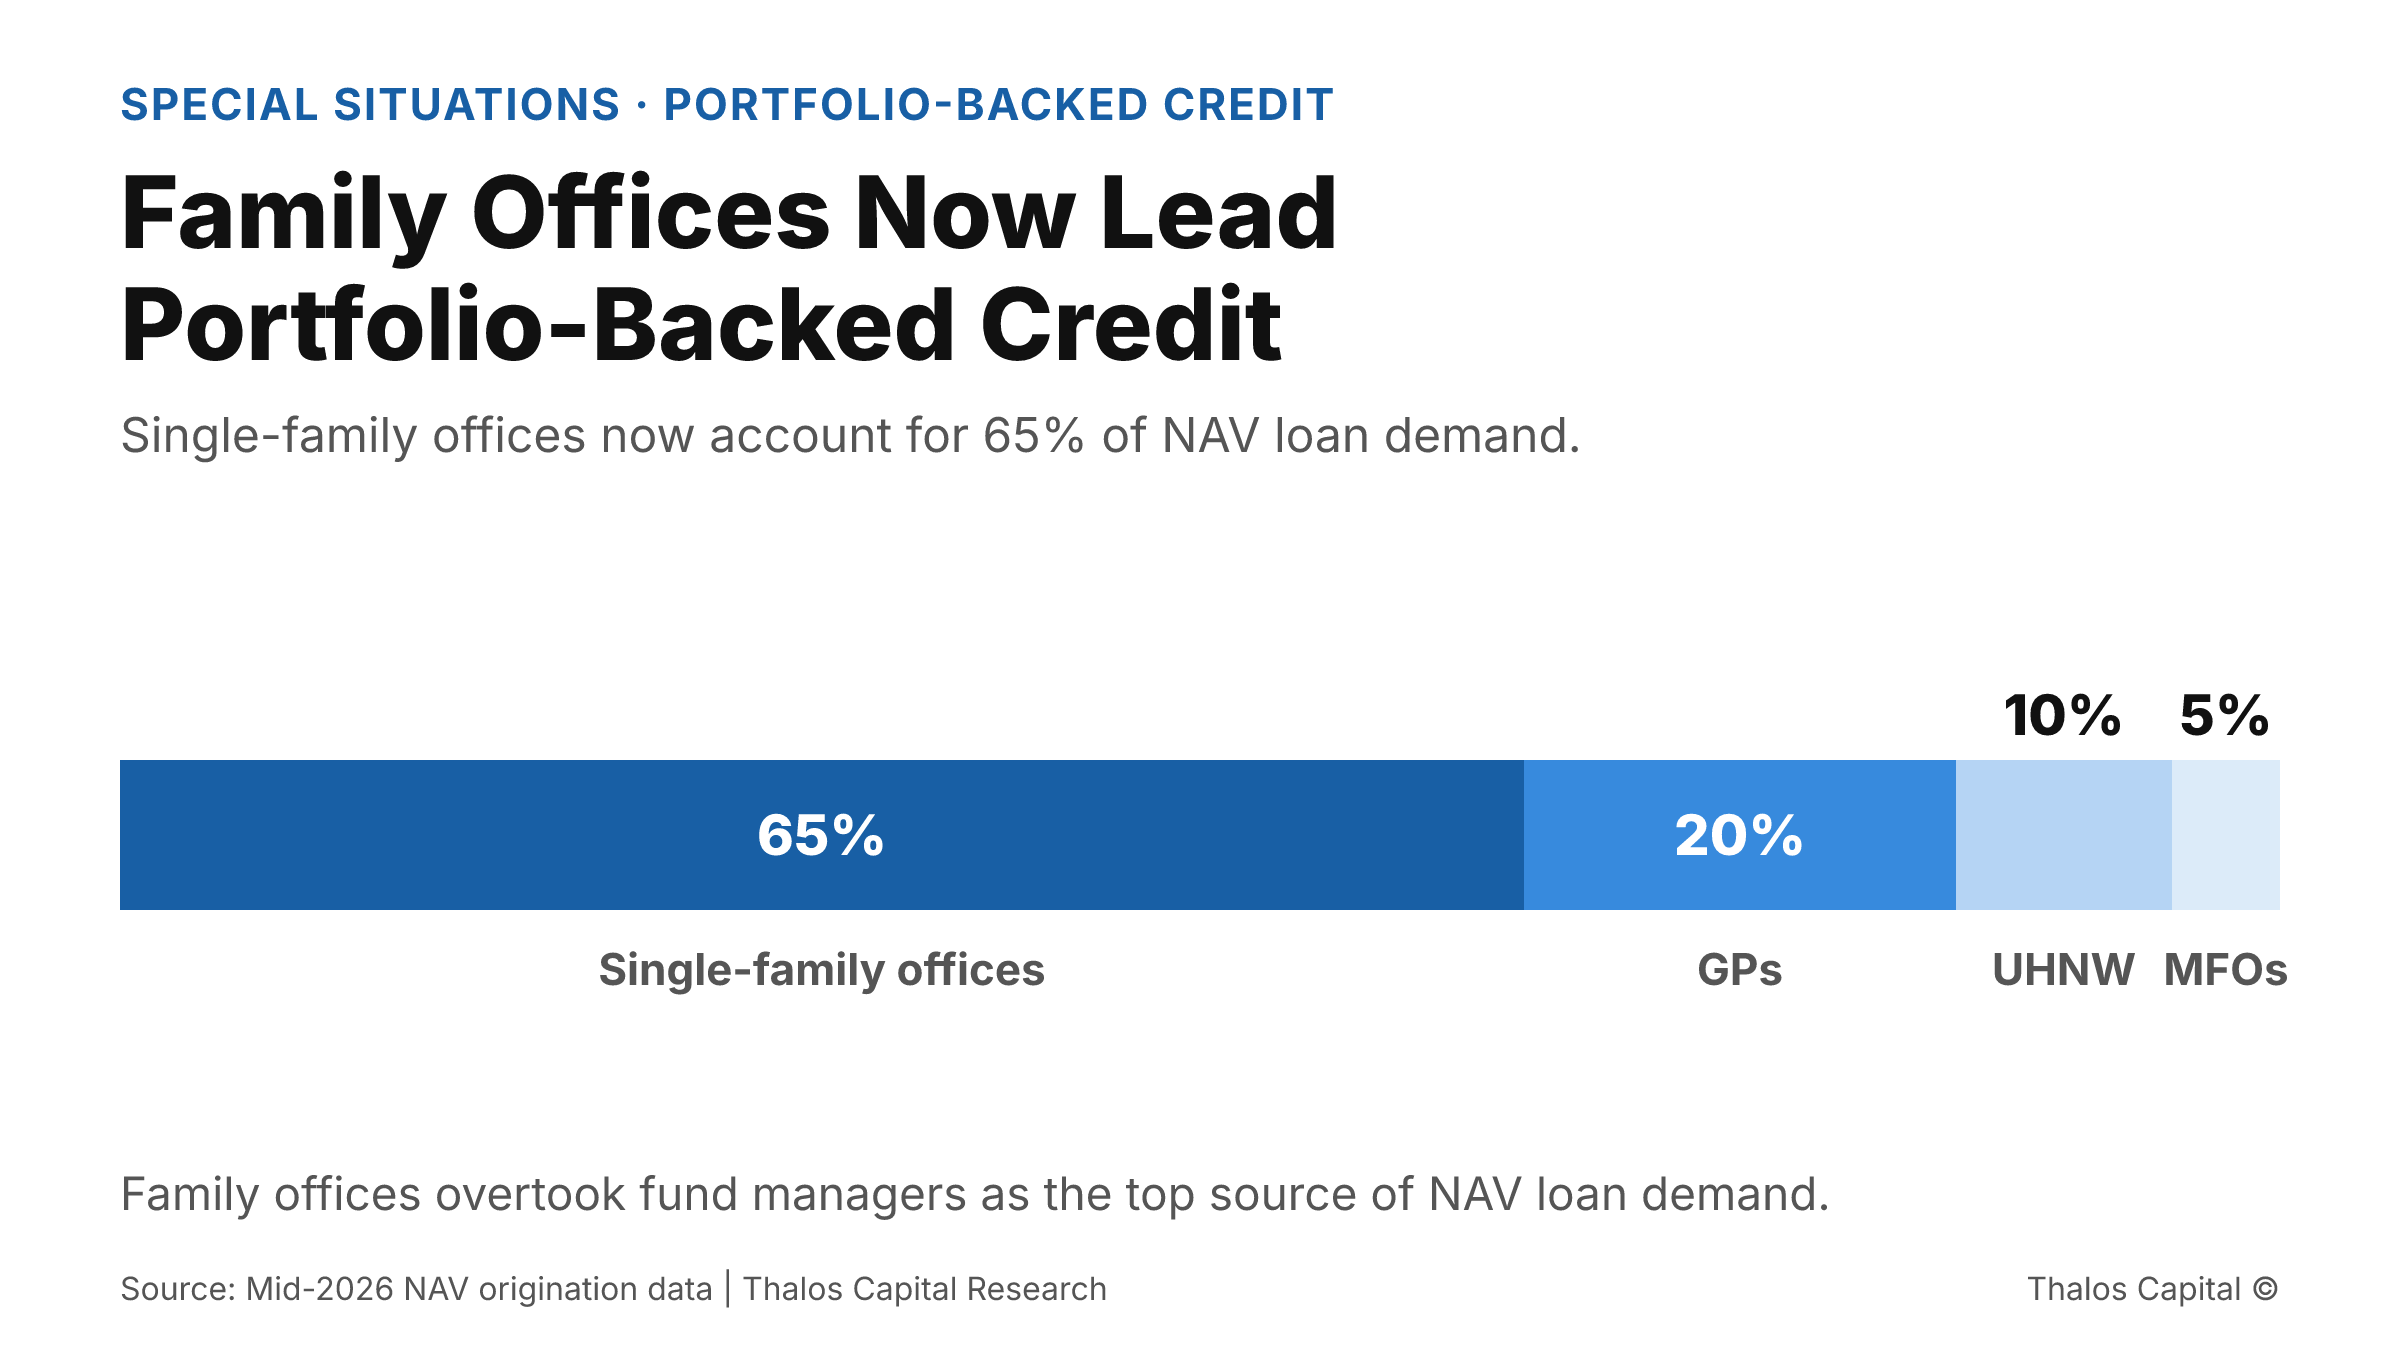
Stacked bar showing single-family offices at 65 percent of NAV loan demand, ahead of general partners, UHNW individuals, and multi-family offices.

Family Offices Now Lead Demand for Portfolio-Backed Credit, and They Are Borrowing to Acquire

Single-family offices now drive 65% of NAV loan demand, and 85% of that borrowing funds acquisitions, not distributions. What the shift means for owners financing against a portfolio.
Read More
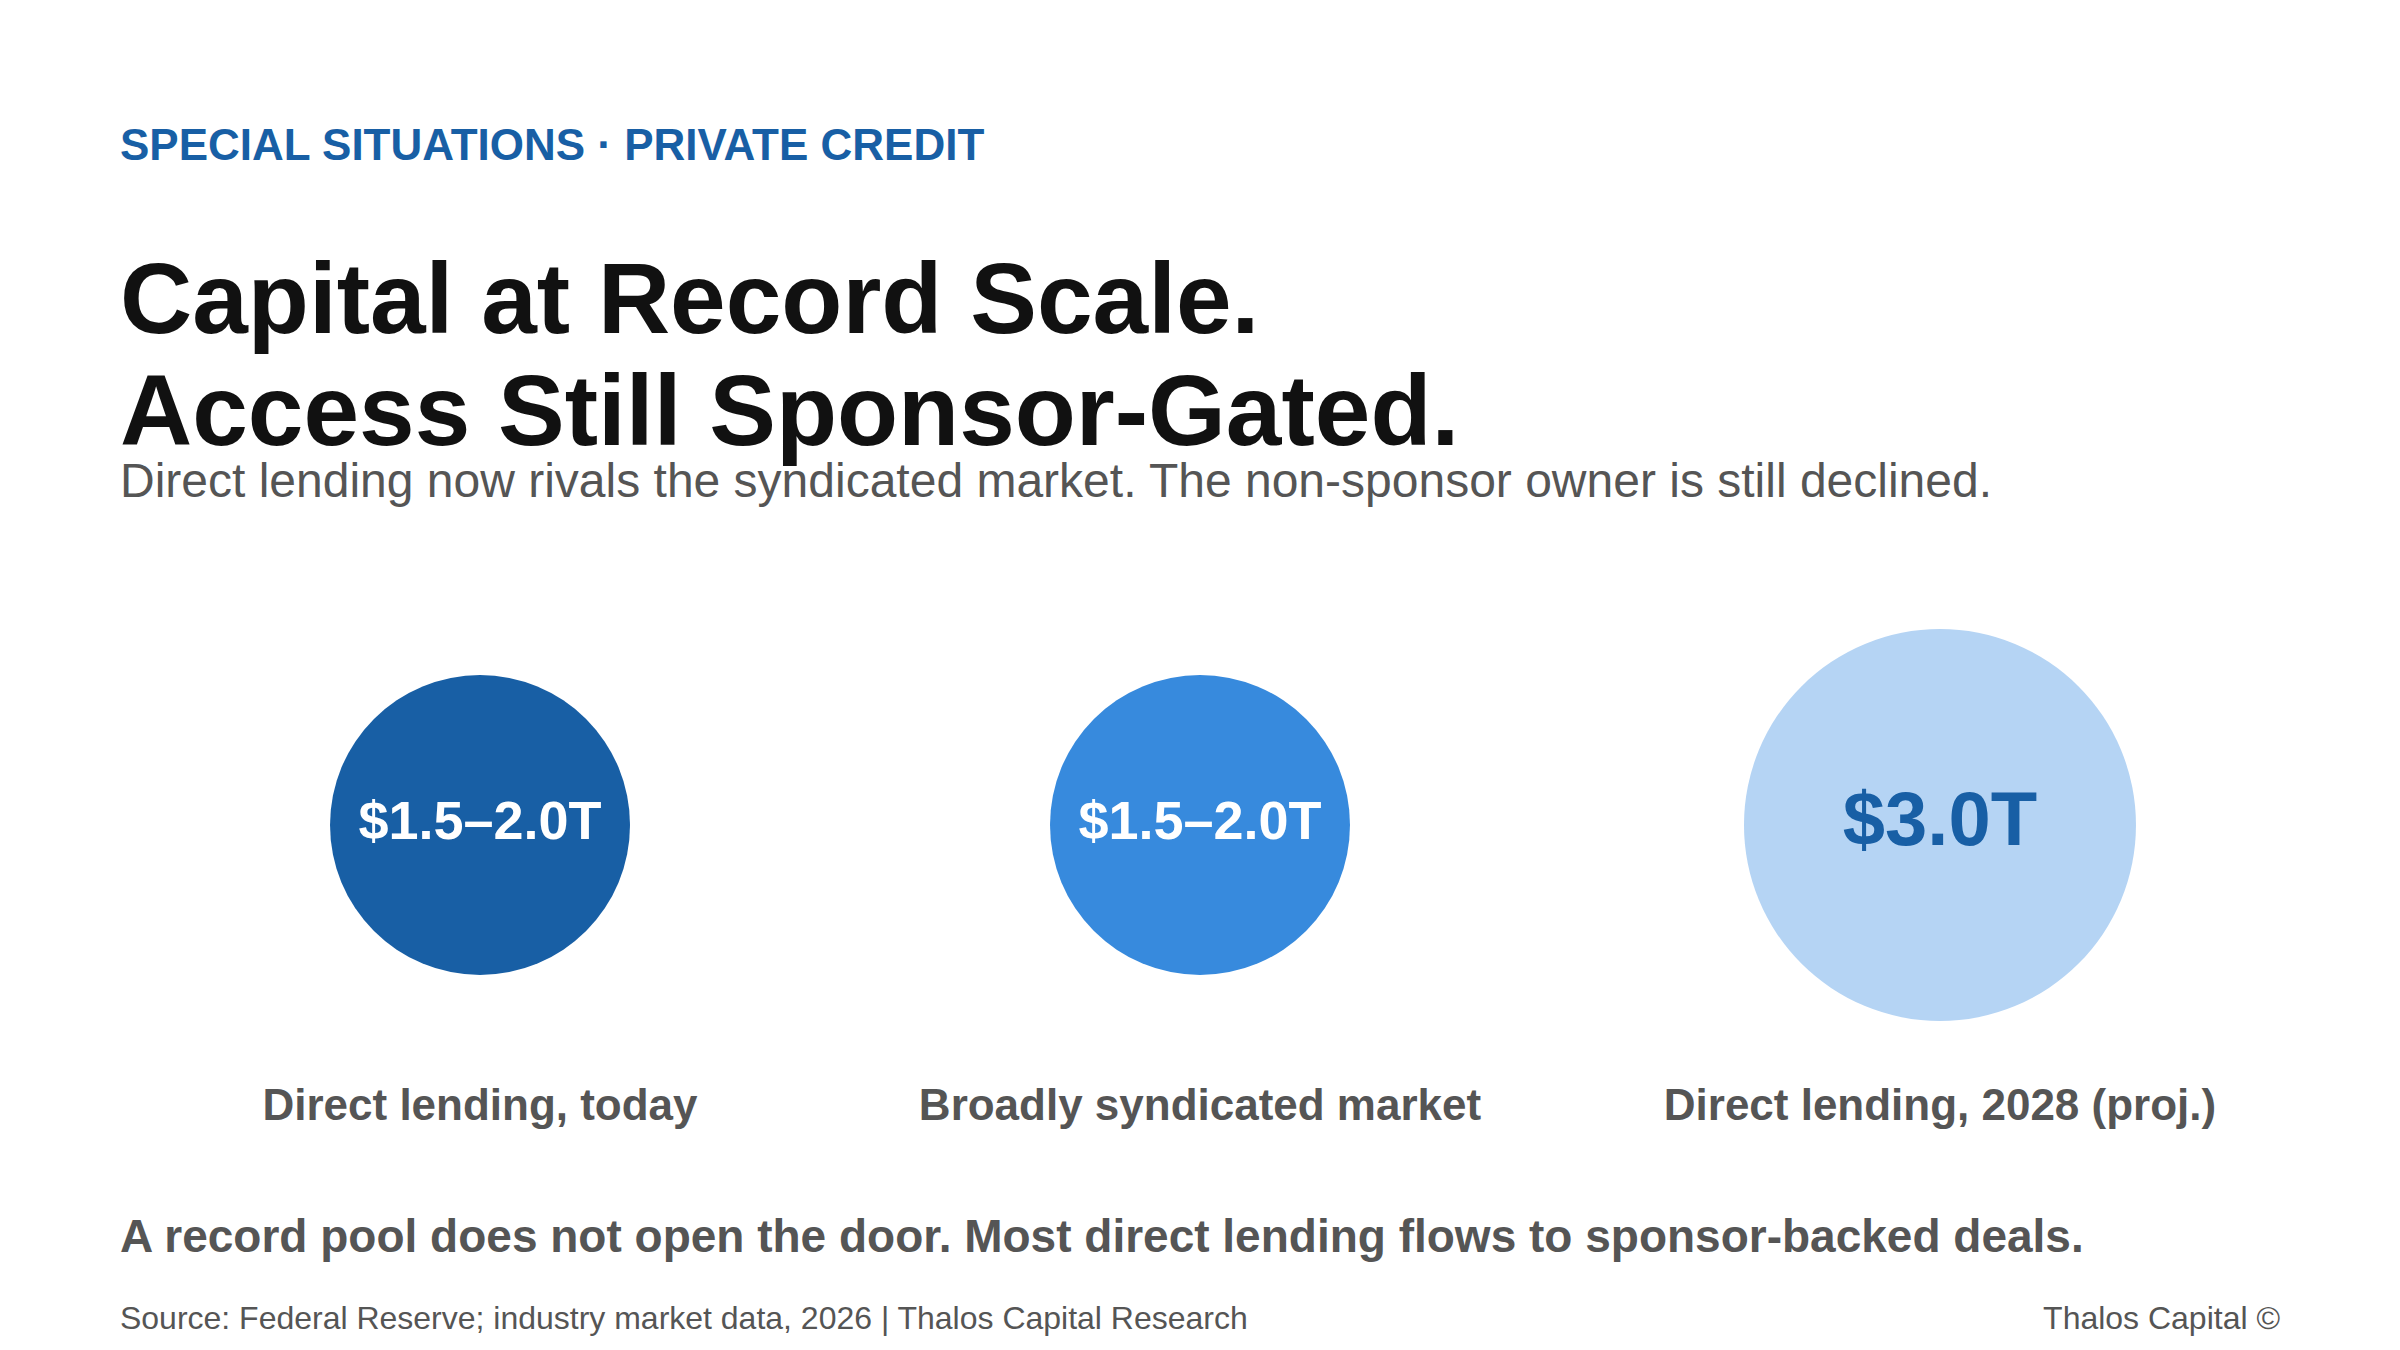
Proportional circles comparing direct lending today at $1.5 to $2 trillion, the broadly syndicated market at a comparable size, and a projected $3 trillion direct lending market by 2028.

Private Credit Has Never Had More Money. The Independent Owner Still Hears No.

Direct lending now rivals the syndicated market at $1.5 to $2 trillion, but the majority flows to sponsor-backed deals. Why non-sponsor owners get declined, and what closes the gap.
Read More
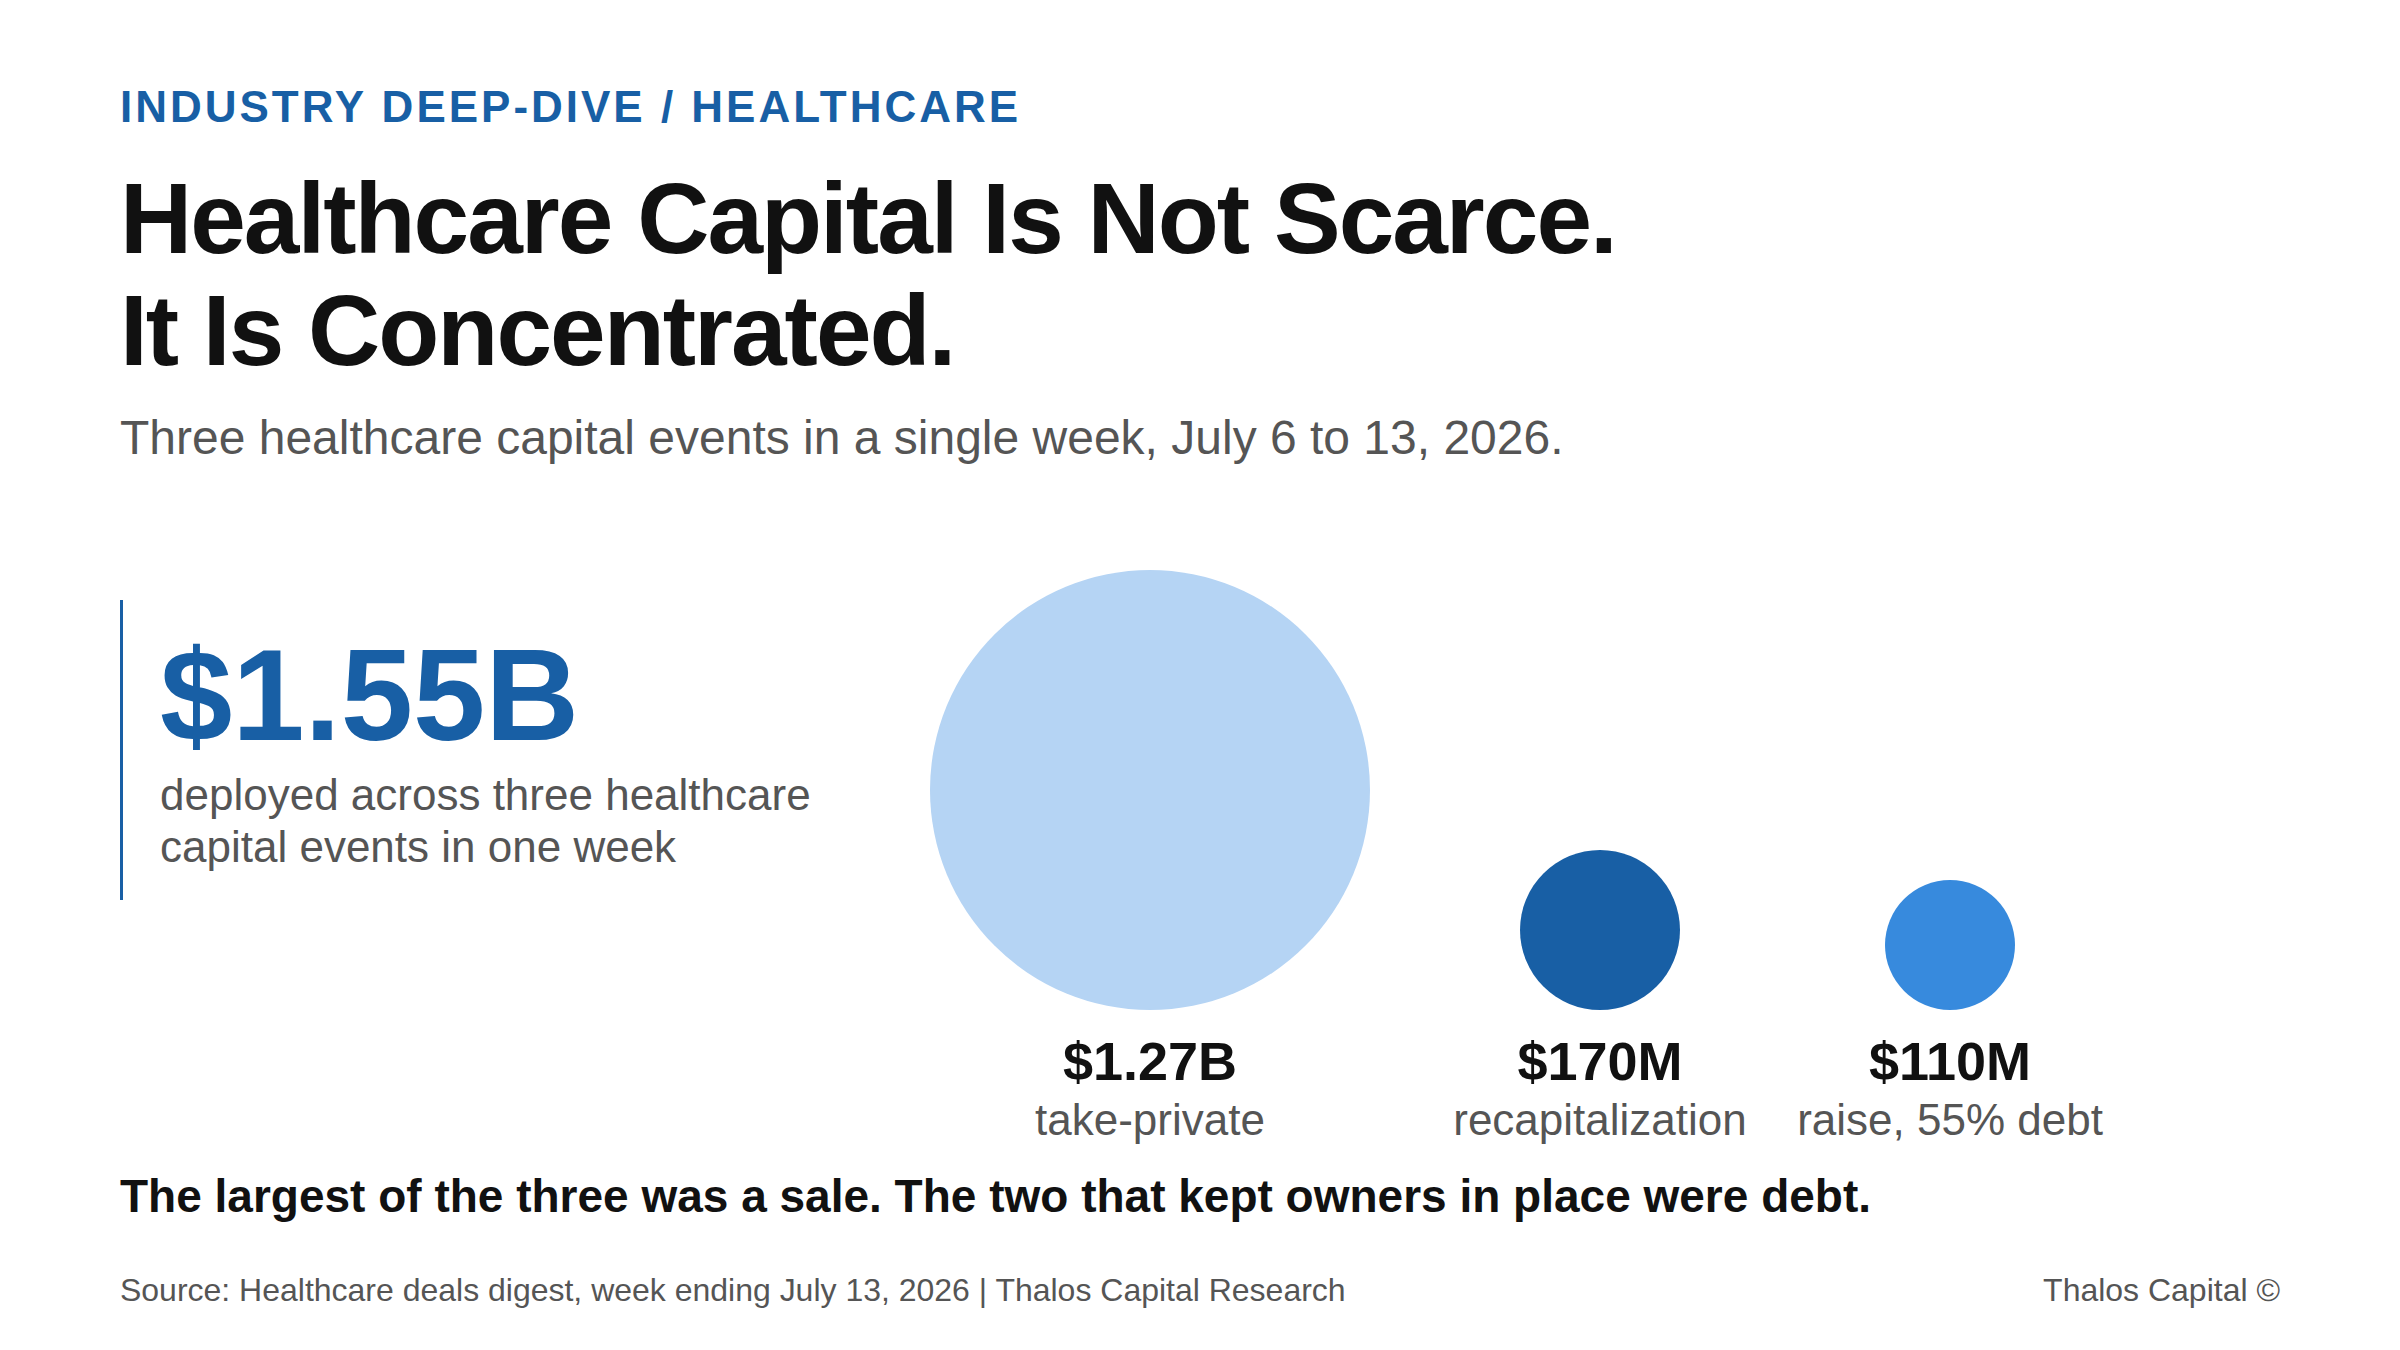
Proportional circle chart comparing three healthcare capital events in the week ending July 13, 2026, sized by value: a $1.27B medical technology take-private, a $170M dental group recapitalization, and a $110M platform raise that was 55 percent debt, totaling roughly $1.55B.

Healthcare Capital Is Not Scarce. It Is Concentrated.

Roughly $1.55B moved into healthcare businesses in one week. The largest deal ended in a sale. The other two used debt and kept ownership intact. Why the same structures rarely reach an independent practice.
Read More
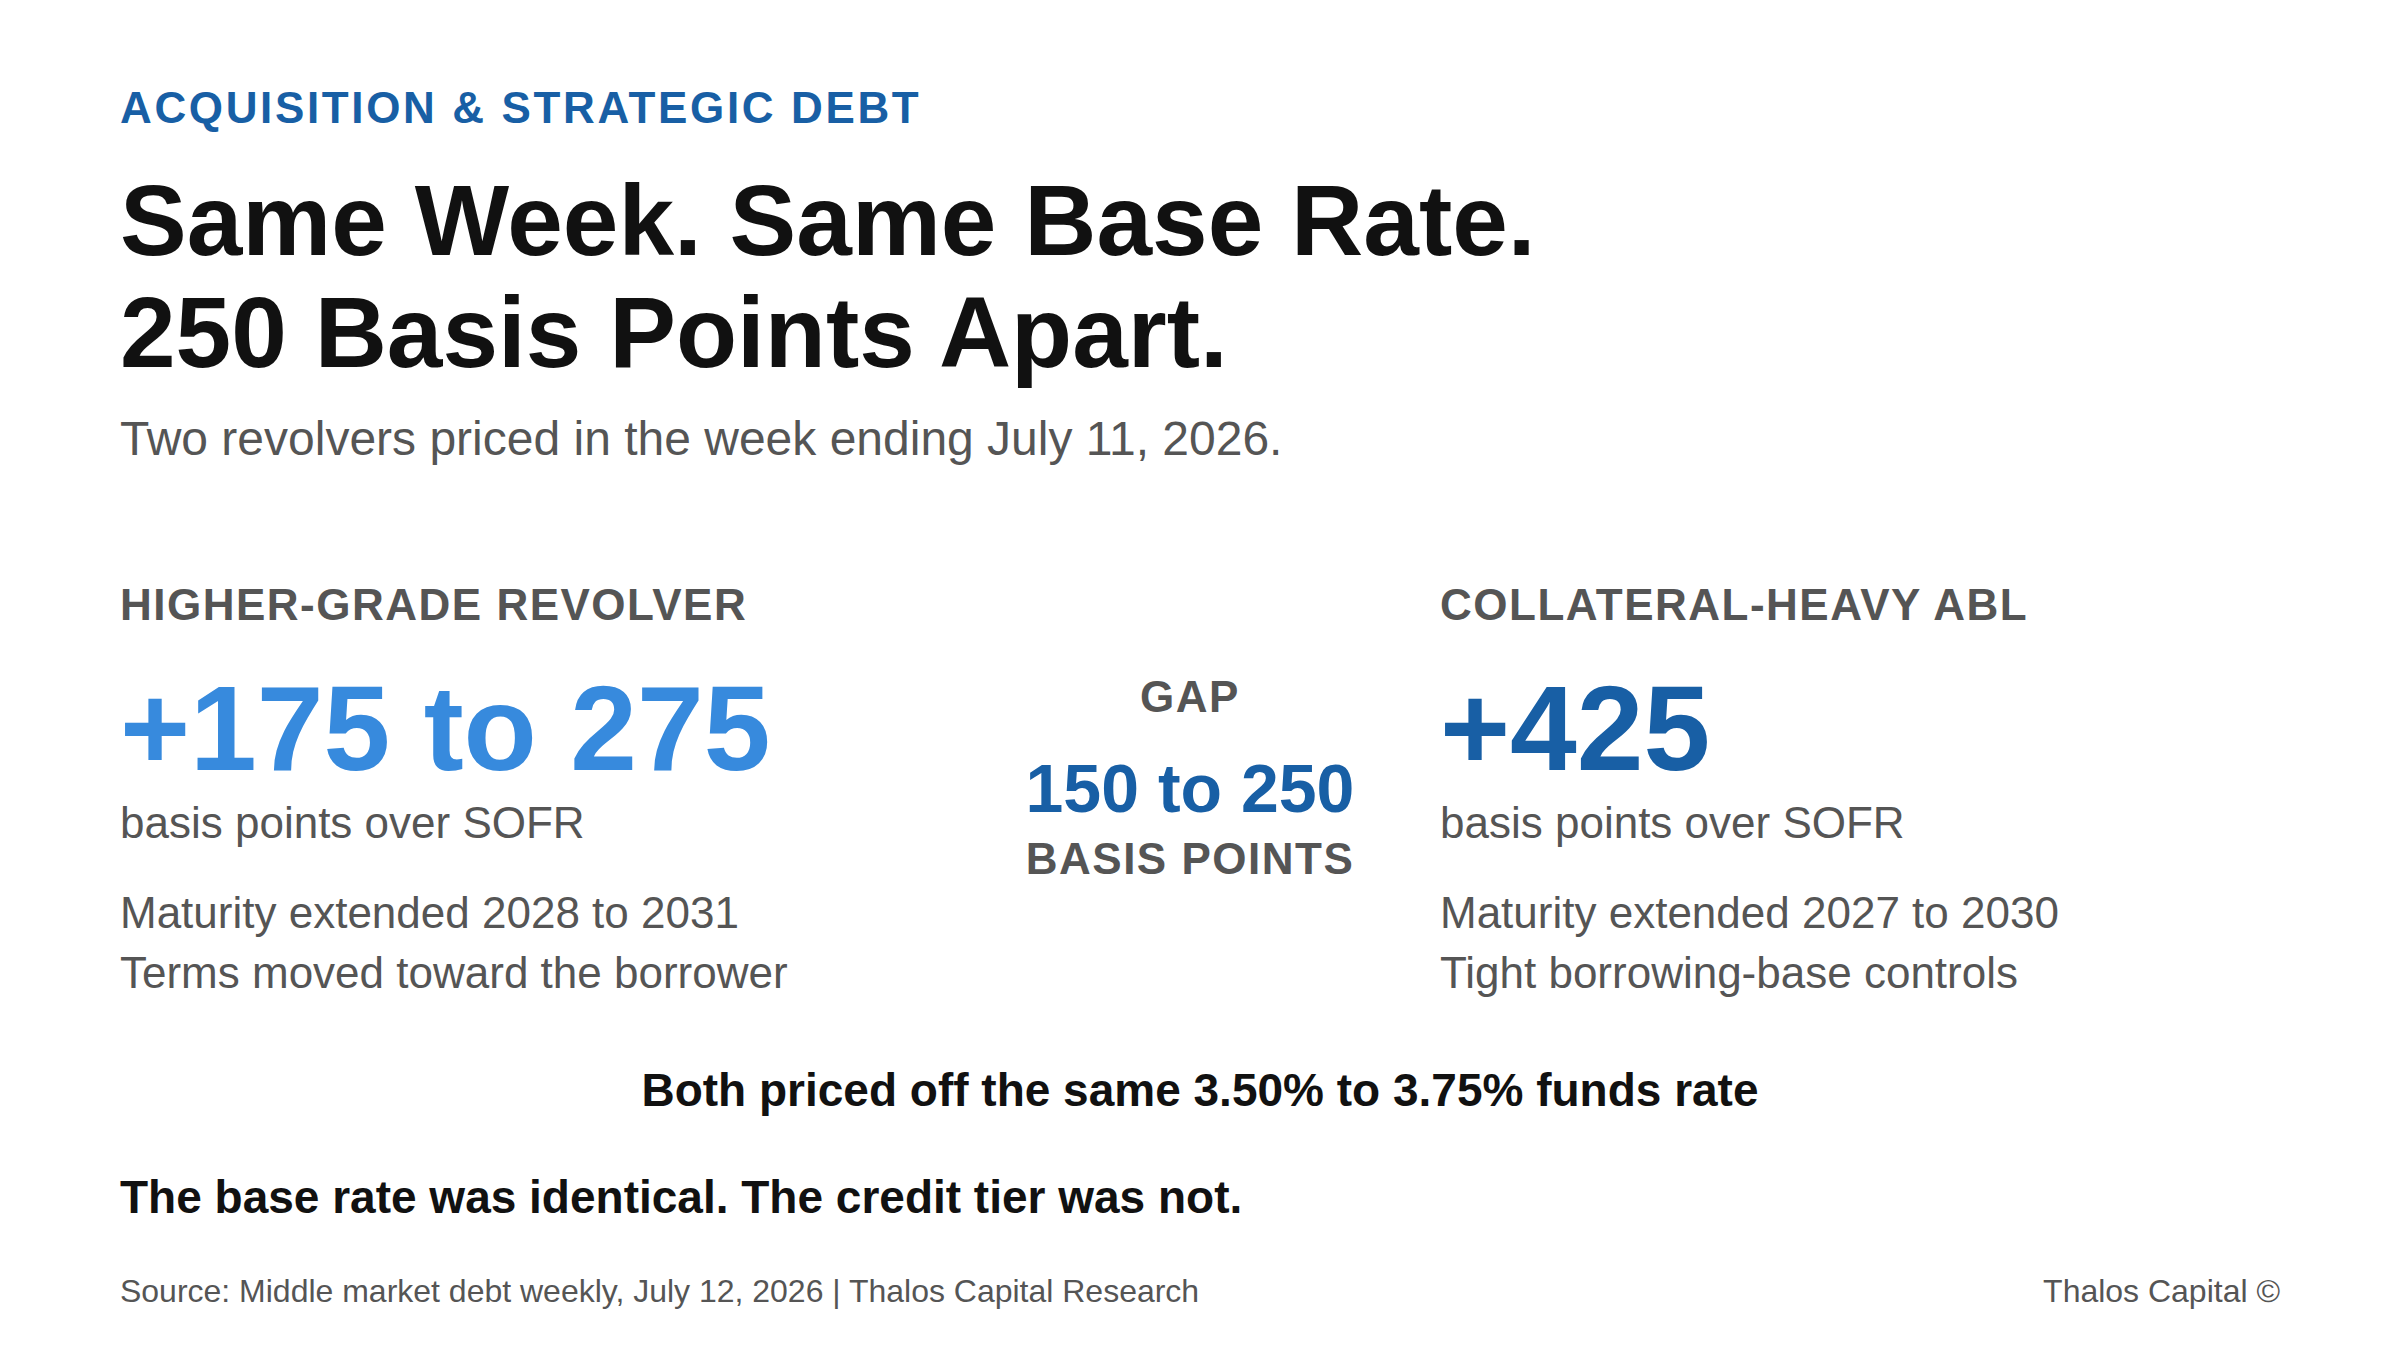
Contrast chart showing a higher-grade revolver priced at 175 to 275 basis points over SOFR against a collateral-heavy asset-based revolver at 425 basis points, both priced off the same 3.50% to 3.75% funds rate.

Same Week, Same Base Rate, 250 Basis Points Apart

Two revolvers priced in the same week of July 2026 carried spreads 150 to 250 basis points apart on an identical base rate. The difference was credit tier, and tier is something a borrower can change.
Read More
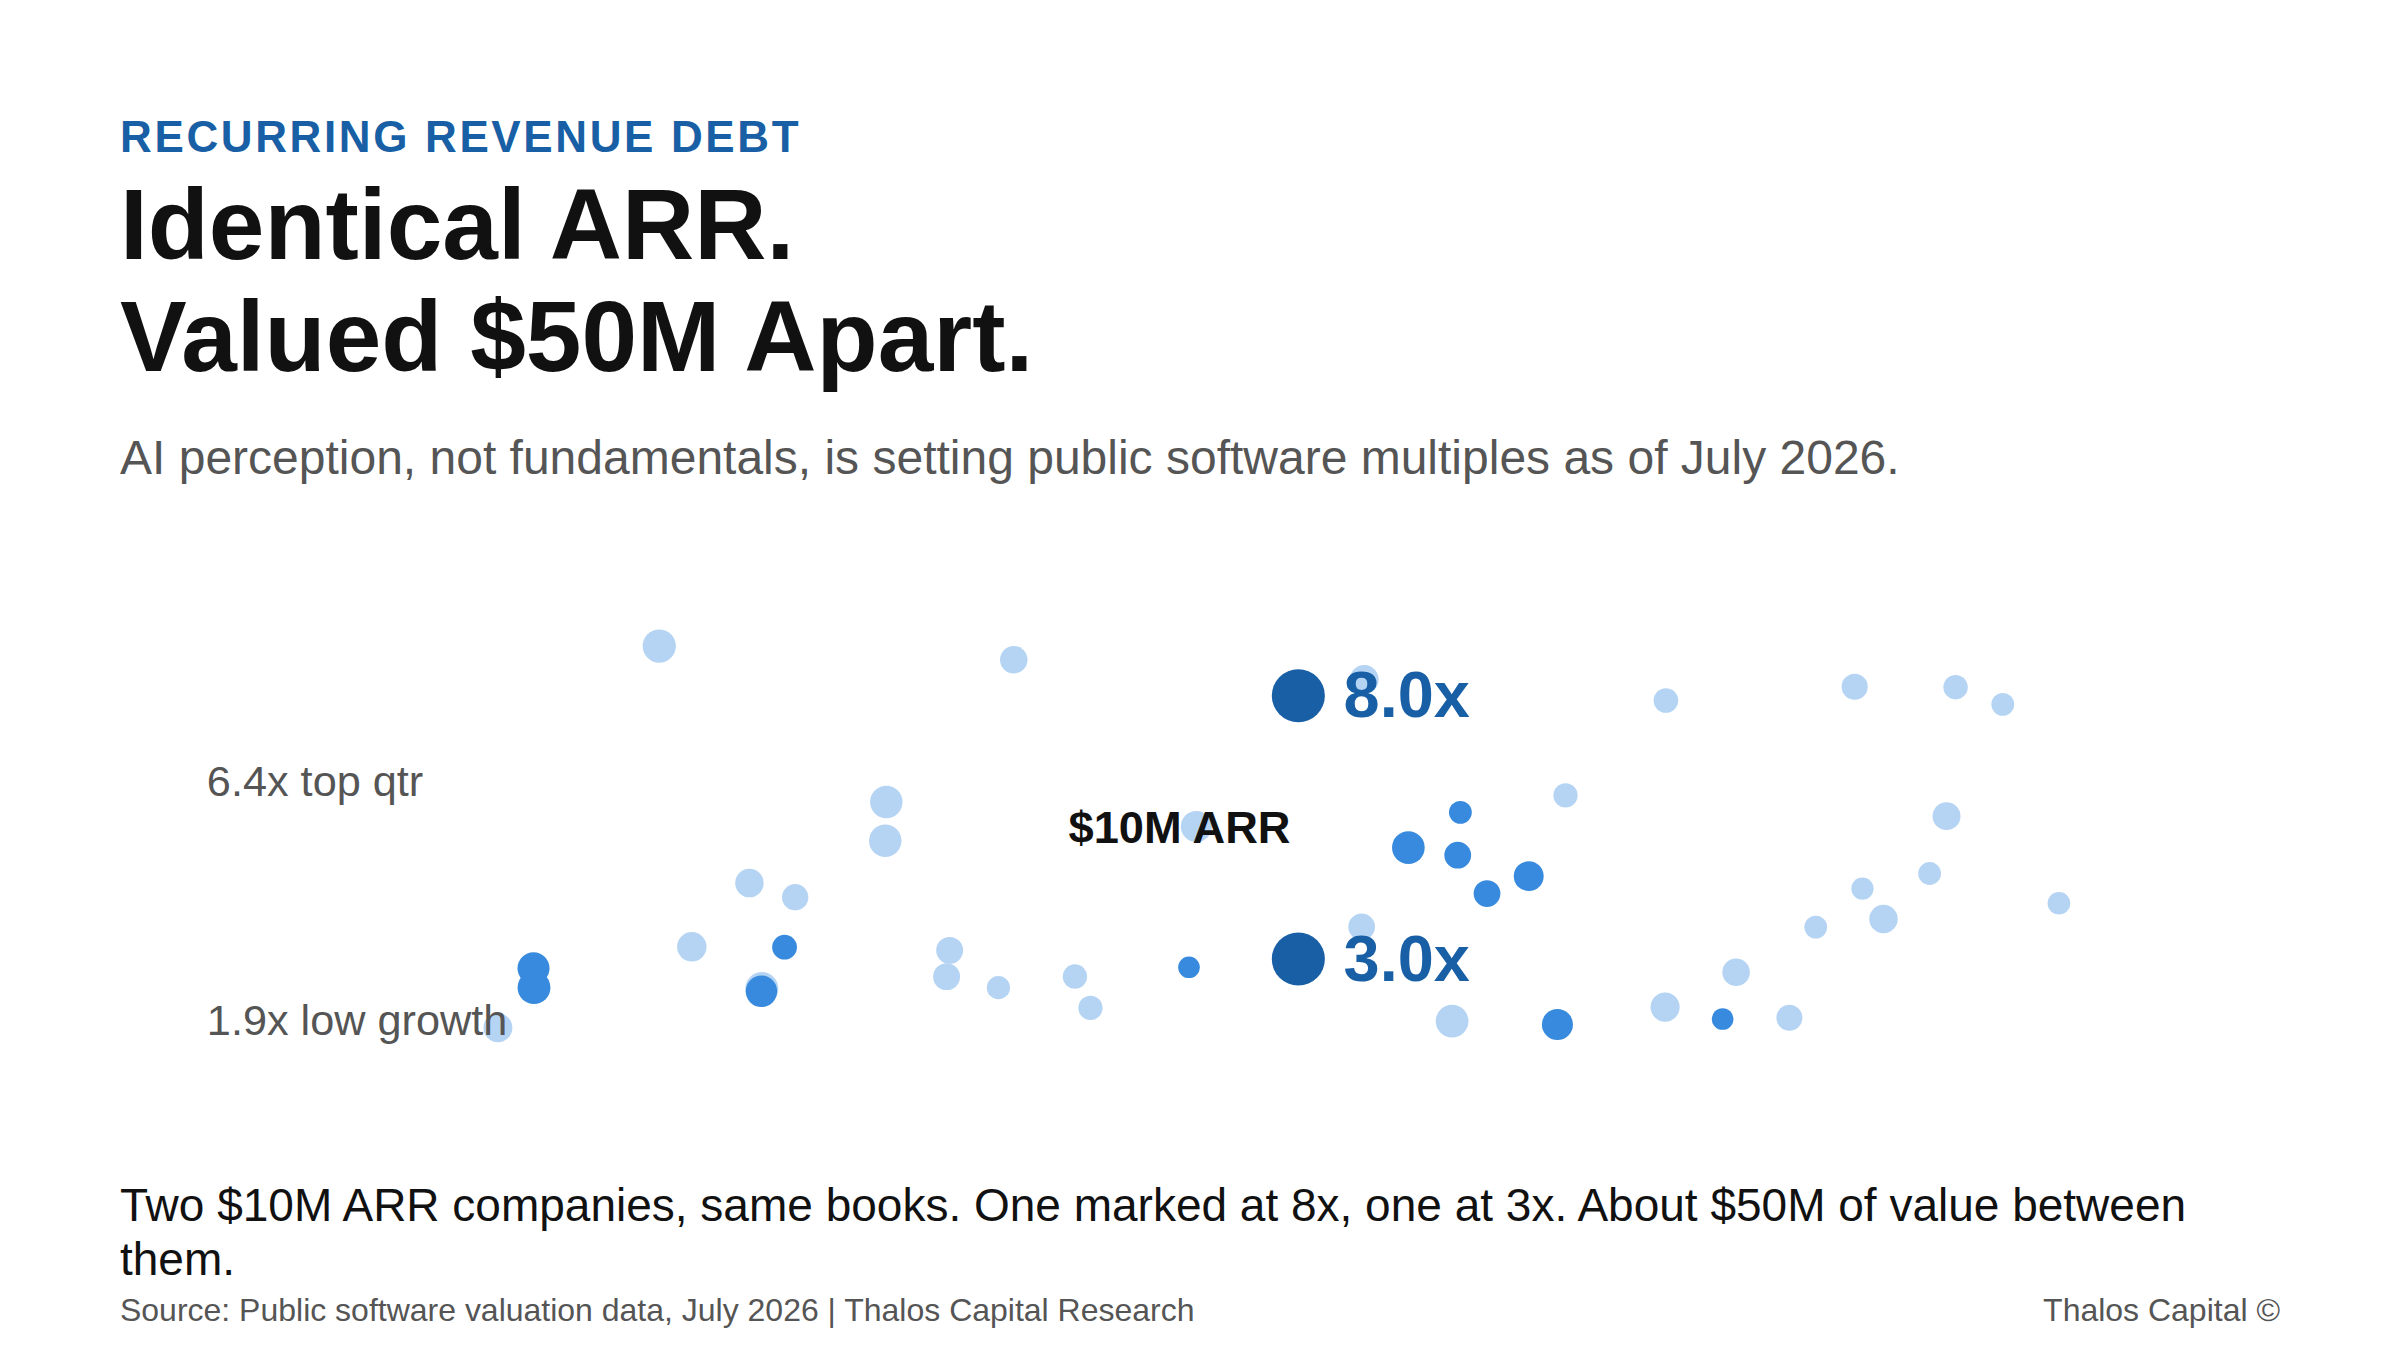
Scatter plot of public SaaS revenue multiples as of July 2026, highlighting two companies with identical $10M ARR marked at 8x and 3x revenue.

AI Perception Is Setting Software Valuations. It Is Not Setting Your Credit.

As of July 2026, AI perception sets software valuations more than fundamentals do. Two identical-ARR companies can be marked $50M apart. A lender reads your contracts, not your narrative.
Read More
Working through a financing decision?
Insights are a starting point. A conversation maps your actual options.
Tell us what you are financing and we will map the structures and sources that fit.
Submit your financing request →
Explore our financing solutions
Equipment FinancingWorking CapitalAsset-Based LendingStrategic Debt