Category

Borrower Advisory

66 insights · page 7 of 9

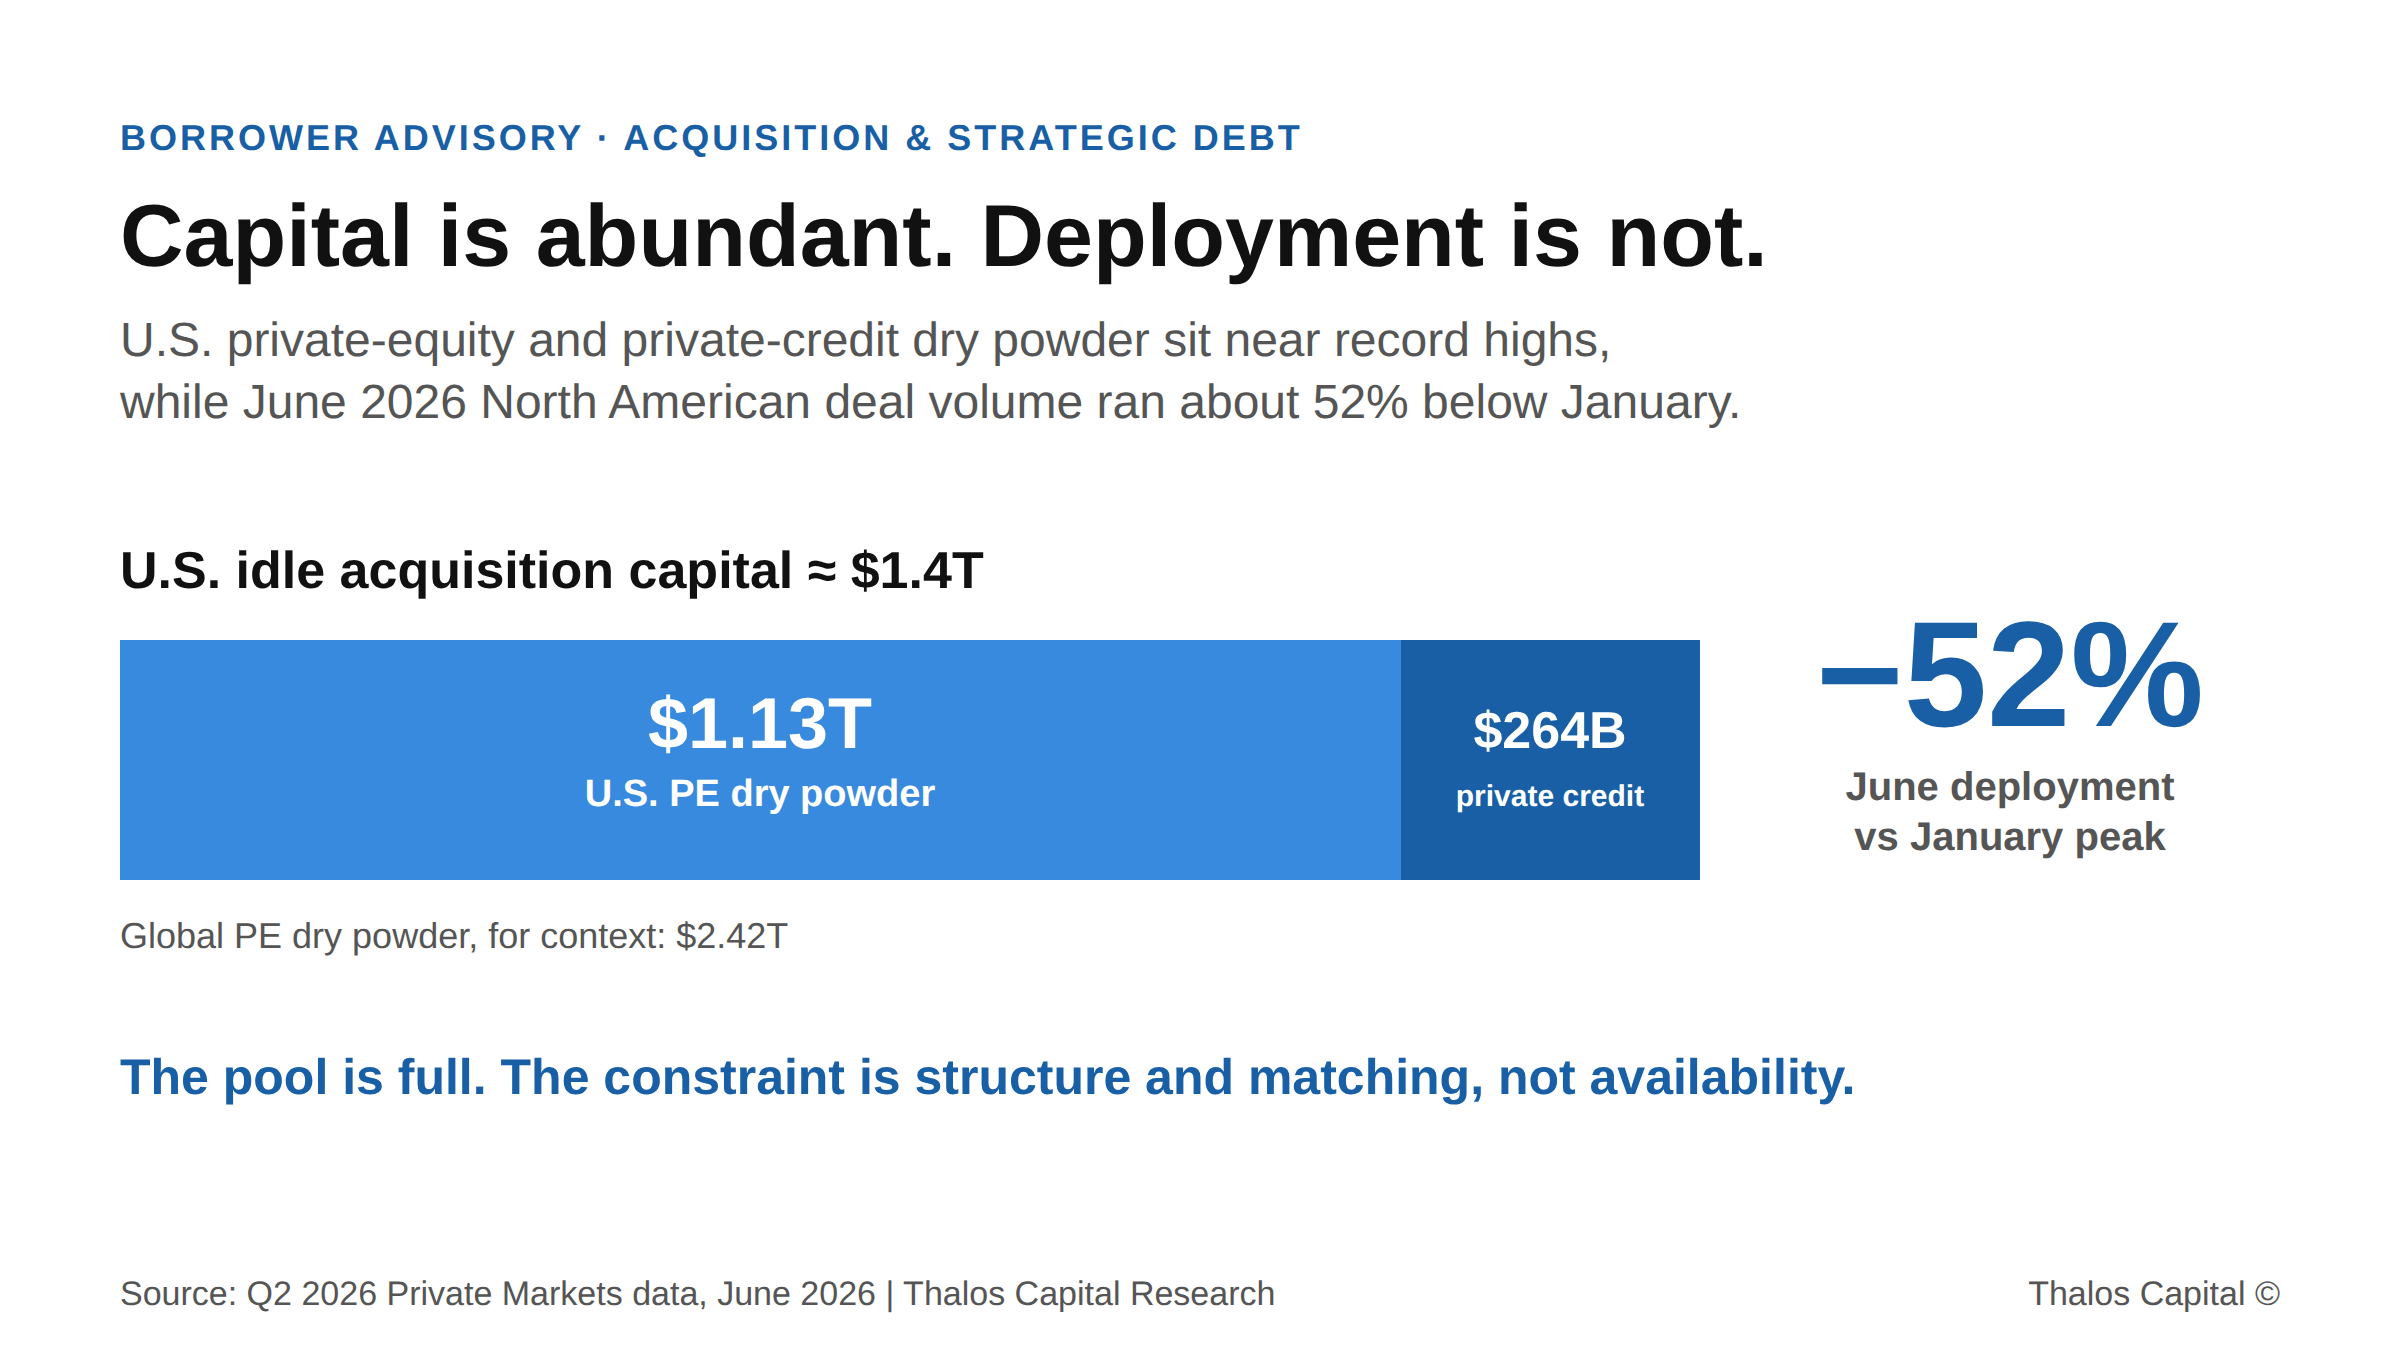
Horizontal stacked bar showing about $1.4T of idle U.S. acquisition capital, split into $1.13T PE dry powder and $264B private-credit dry powder, against a −52% drop in June 2026 deal deployment versus January.

Capital Is Not Scarce. It Is Just Not Moving.

U.S. acquisition capital sits near record levels while deal volume has fallen by half. The binding constraint for buyers now is structure and matching, not availability.
Read More
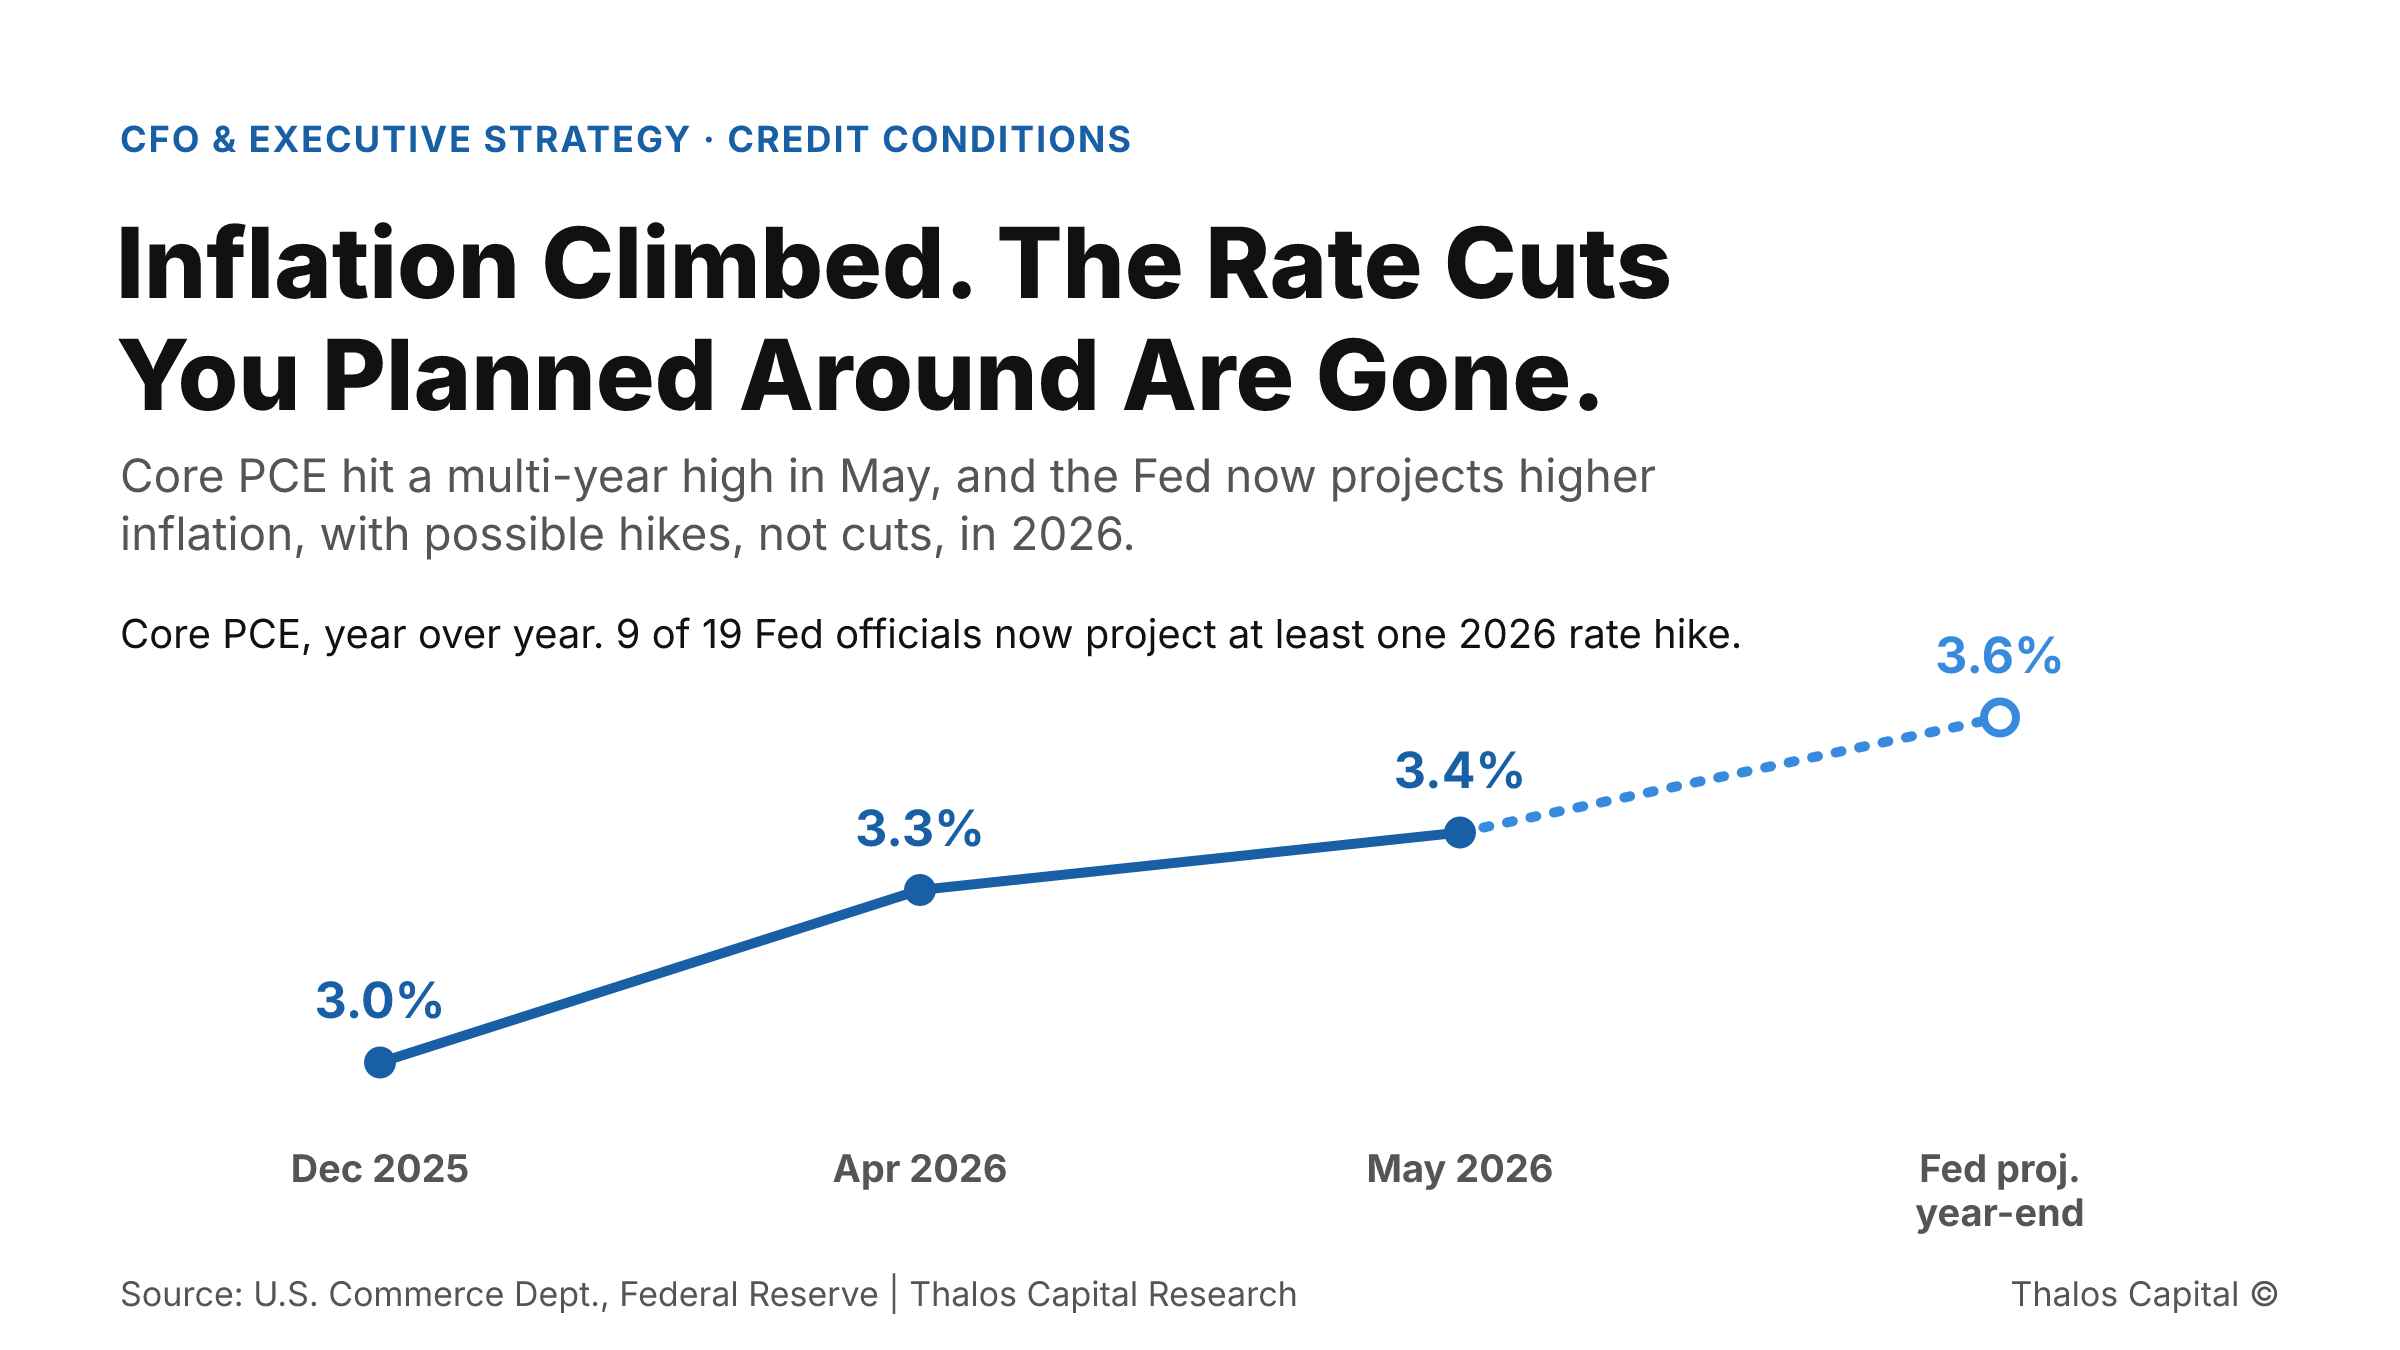
Line chart showing core PCE inflation rising from 3.0% in December 2025 to 3.4% in May 2026, with the Federal Reserve projecting 3.6% at year-end 2026.

Your Borrowing Capacity Is Shrinking While You Wait

The rate outlook flipped and commercial bankruptcy filings are climbing. Why the debt capacity you modeled last year is shrinking, and how to bring current assumptions to the lender call.
Read More
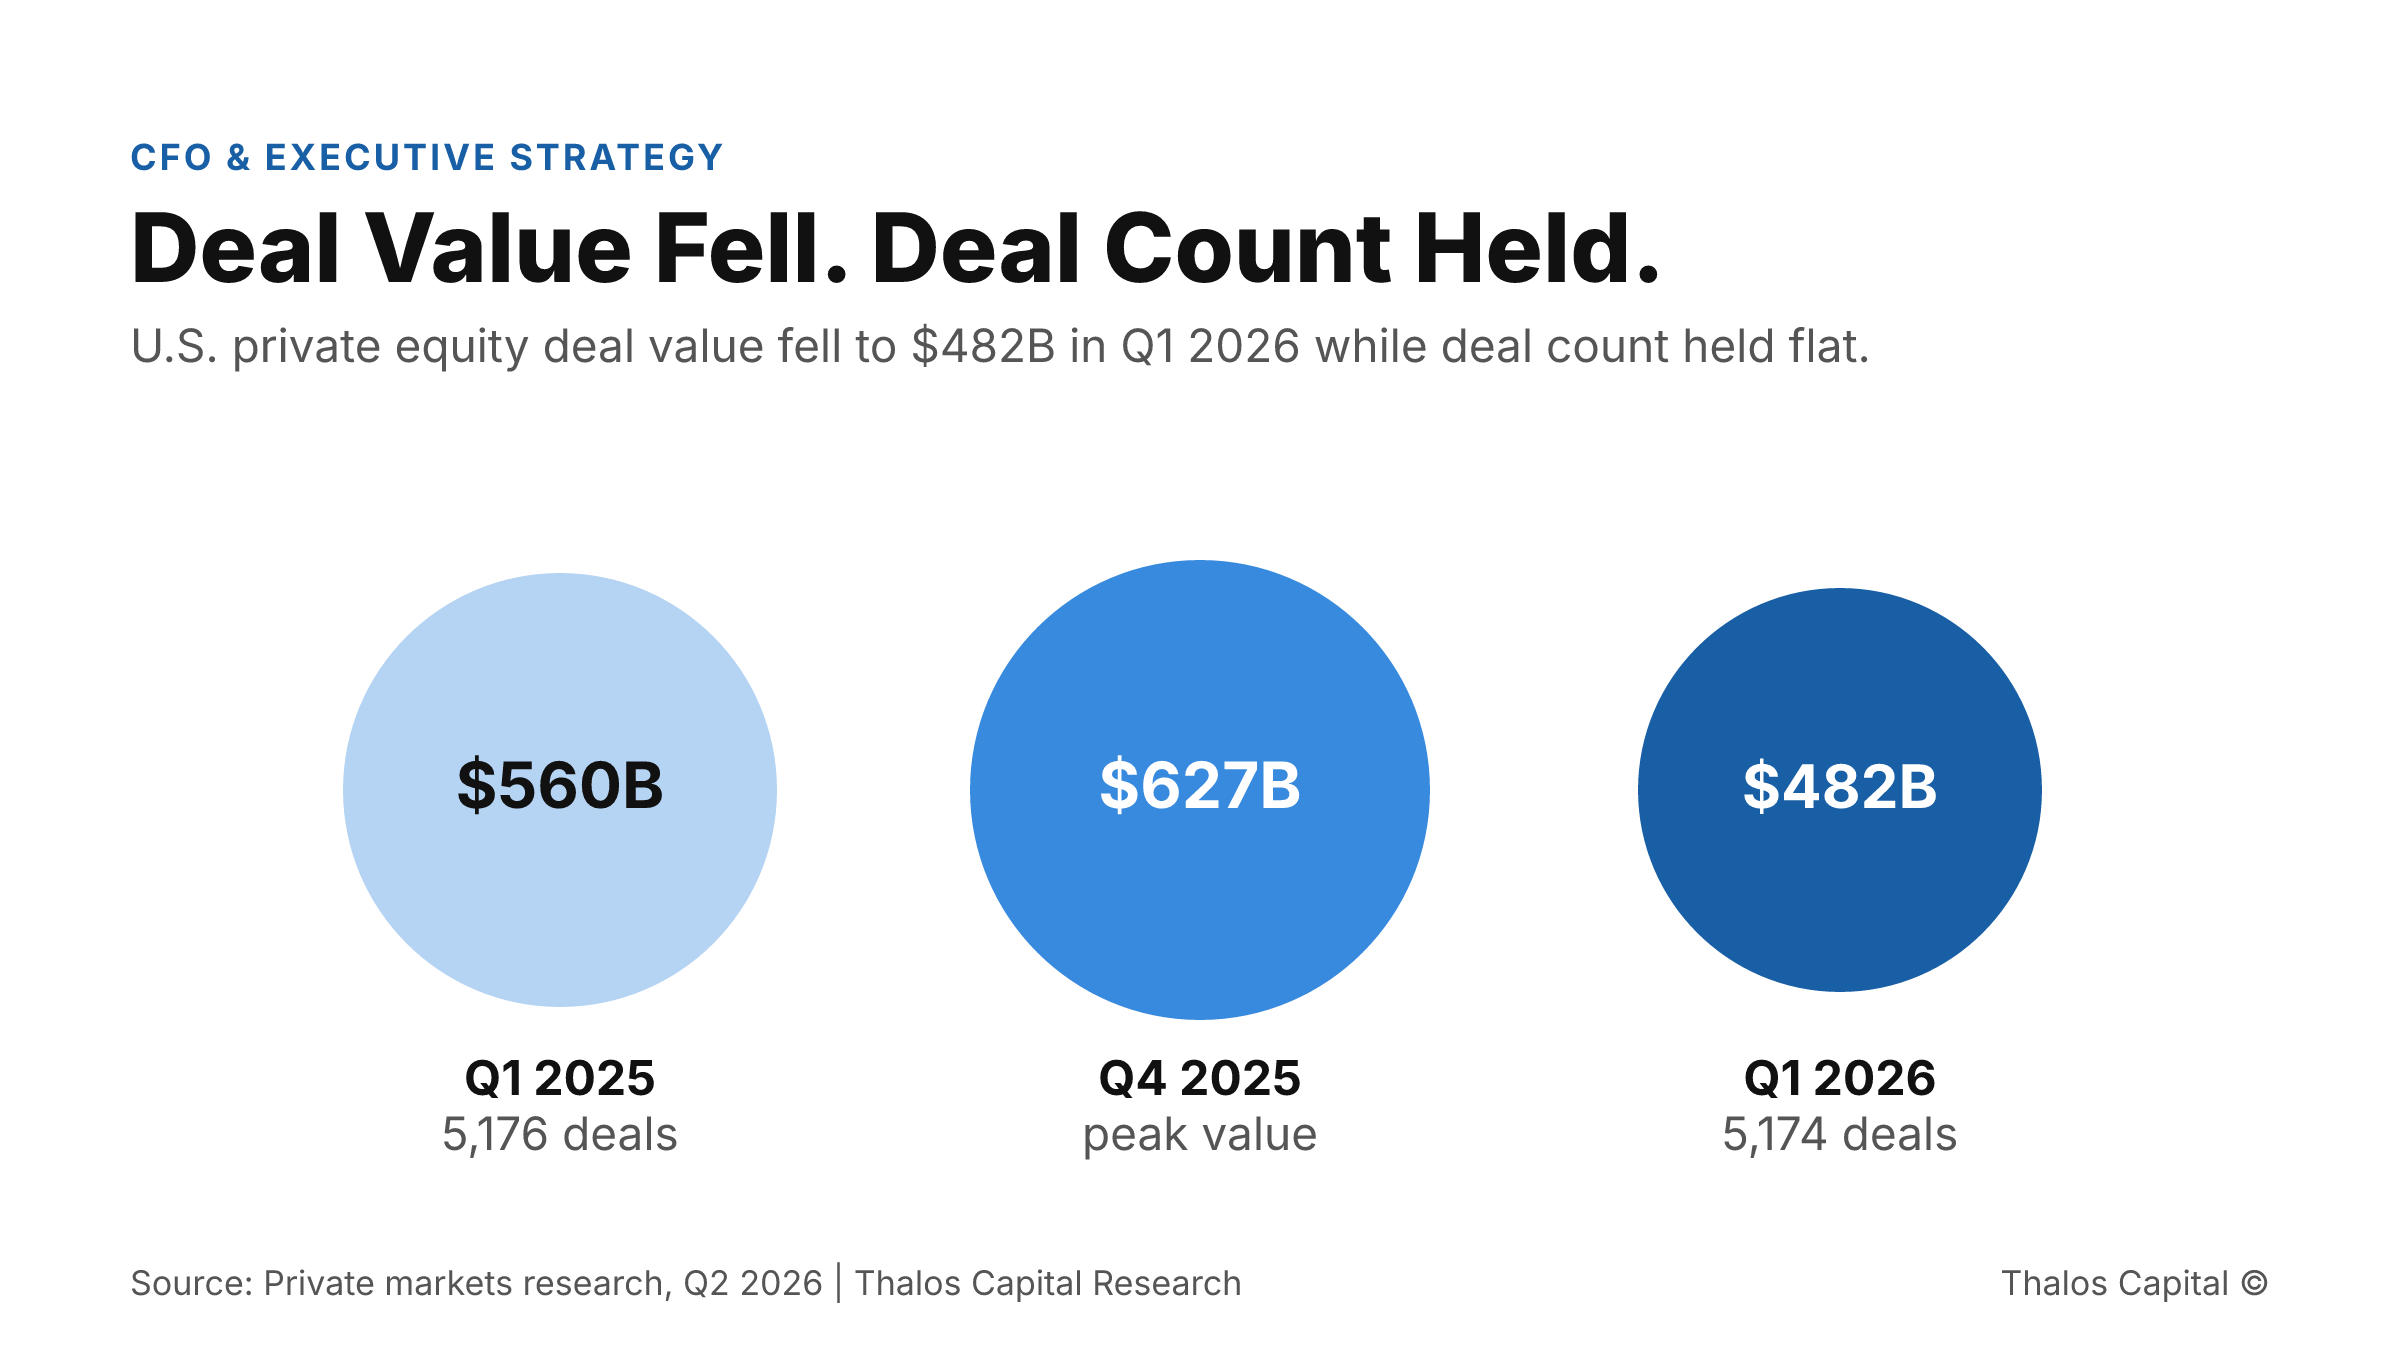
Proportional circle chart showing U.S. private equity deal value falling to $482B in Q1 2026 from $627B in Q4 2025 while deal count held flat near 5,175.

Capital Is Available. That Does Not Mean Your Deal Gets Funded.

Private equity deal value fell 14% year over year while deal count stayed flat. In a selective market, readiness, not access, decides which borrowers actually get funded.
Read More
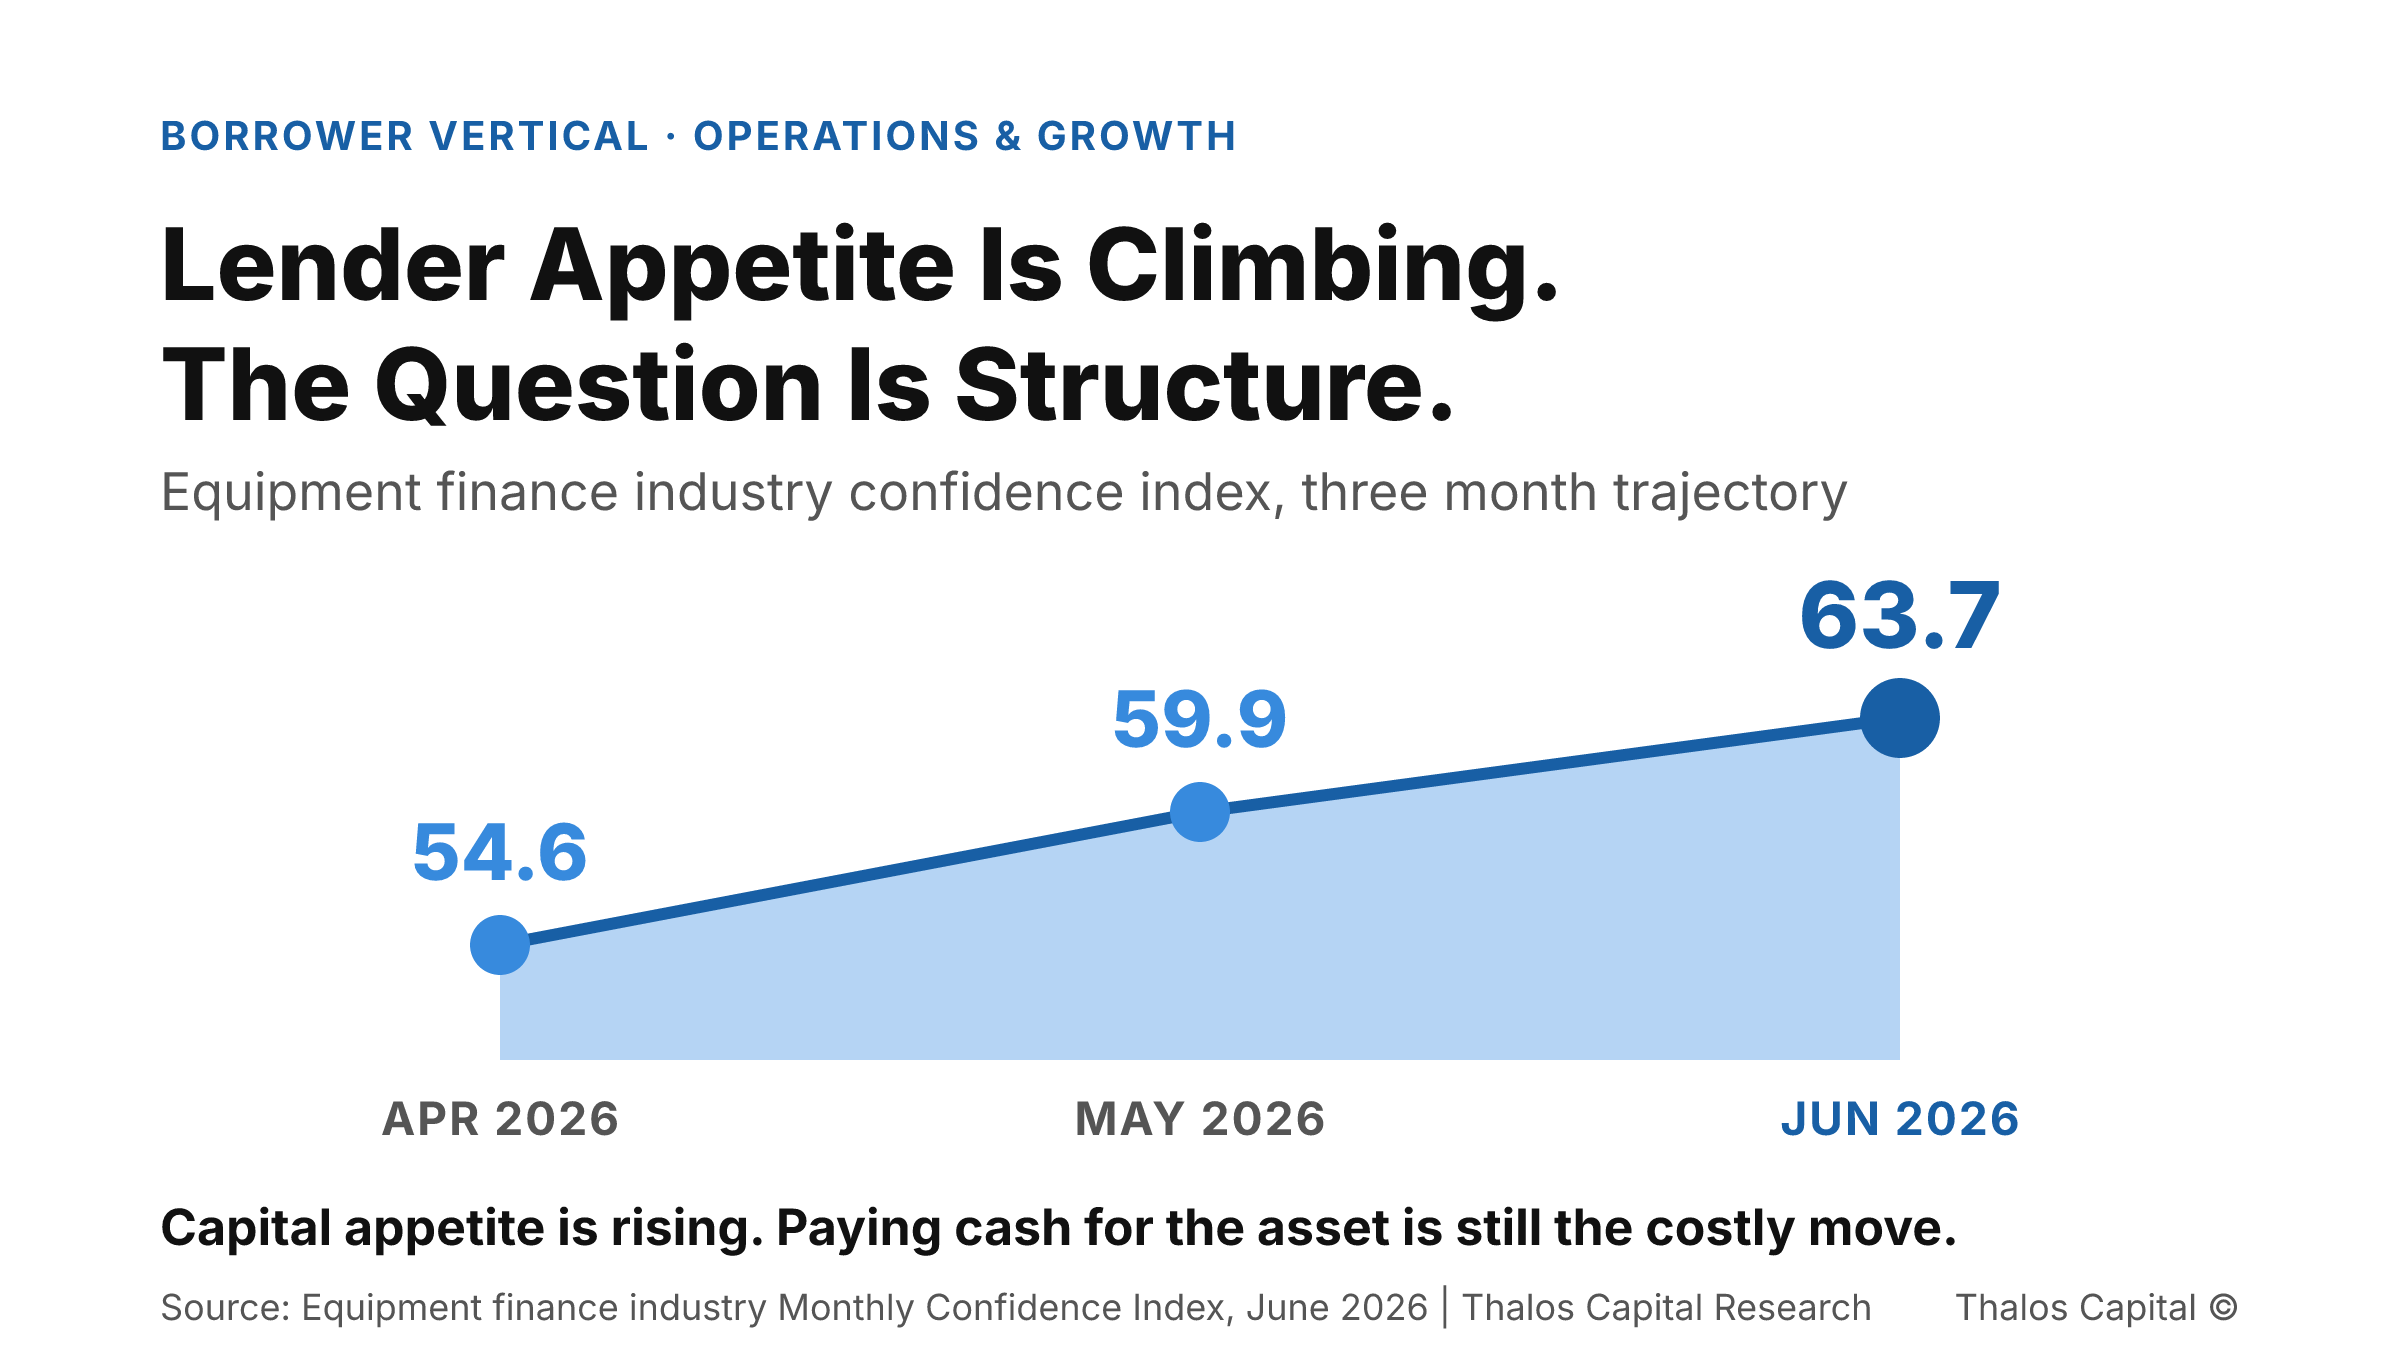
Filled area trend chart showing the equipment finance industry monthly confidence index climbing from 54.6 in April 2026 to 59.9 in May to 63.7 in June.

Paying Cash for Equipment Is Not the Conservative Move. It Is the Expensive One.

Capex demand is rising into a working capital squeeze. Why paying cash for equipment is the expensive move, and how layering the structure preserves the liquidity growth consumes.
Read More
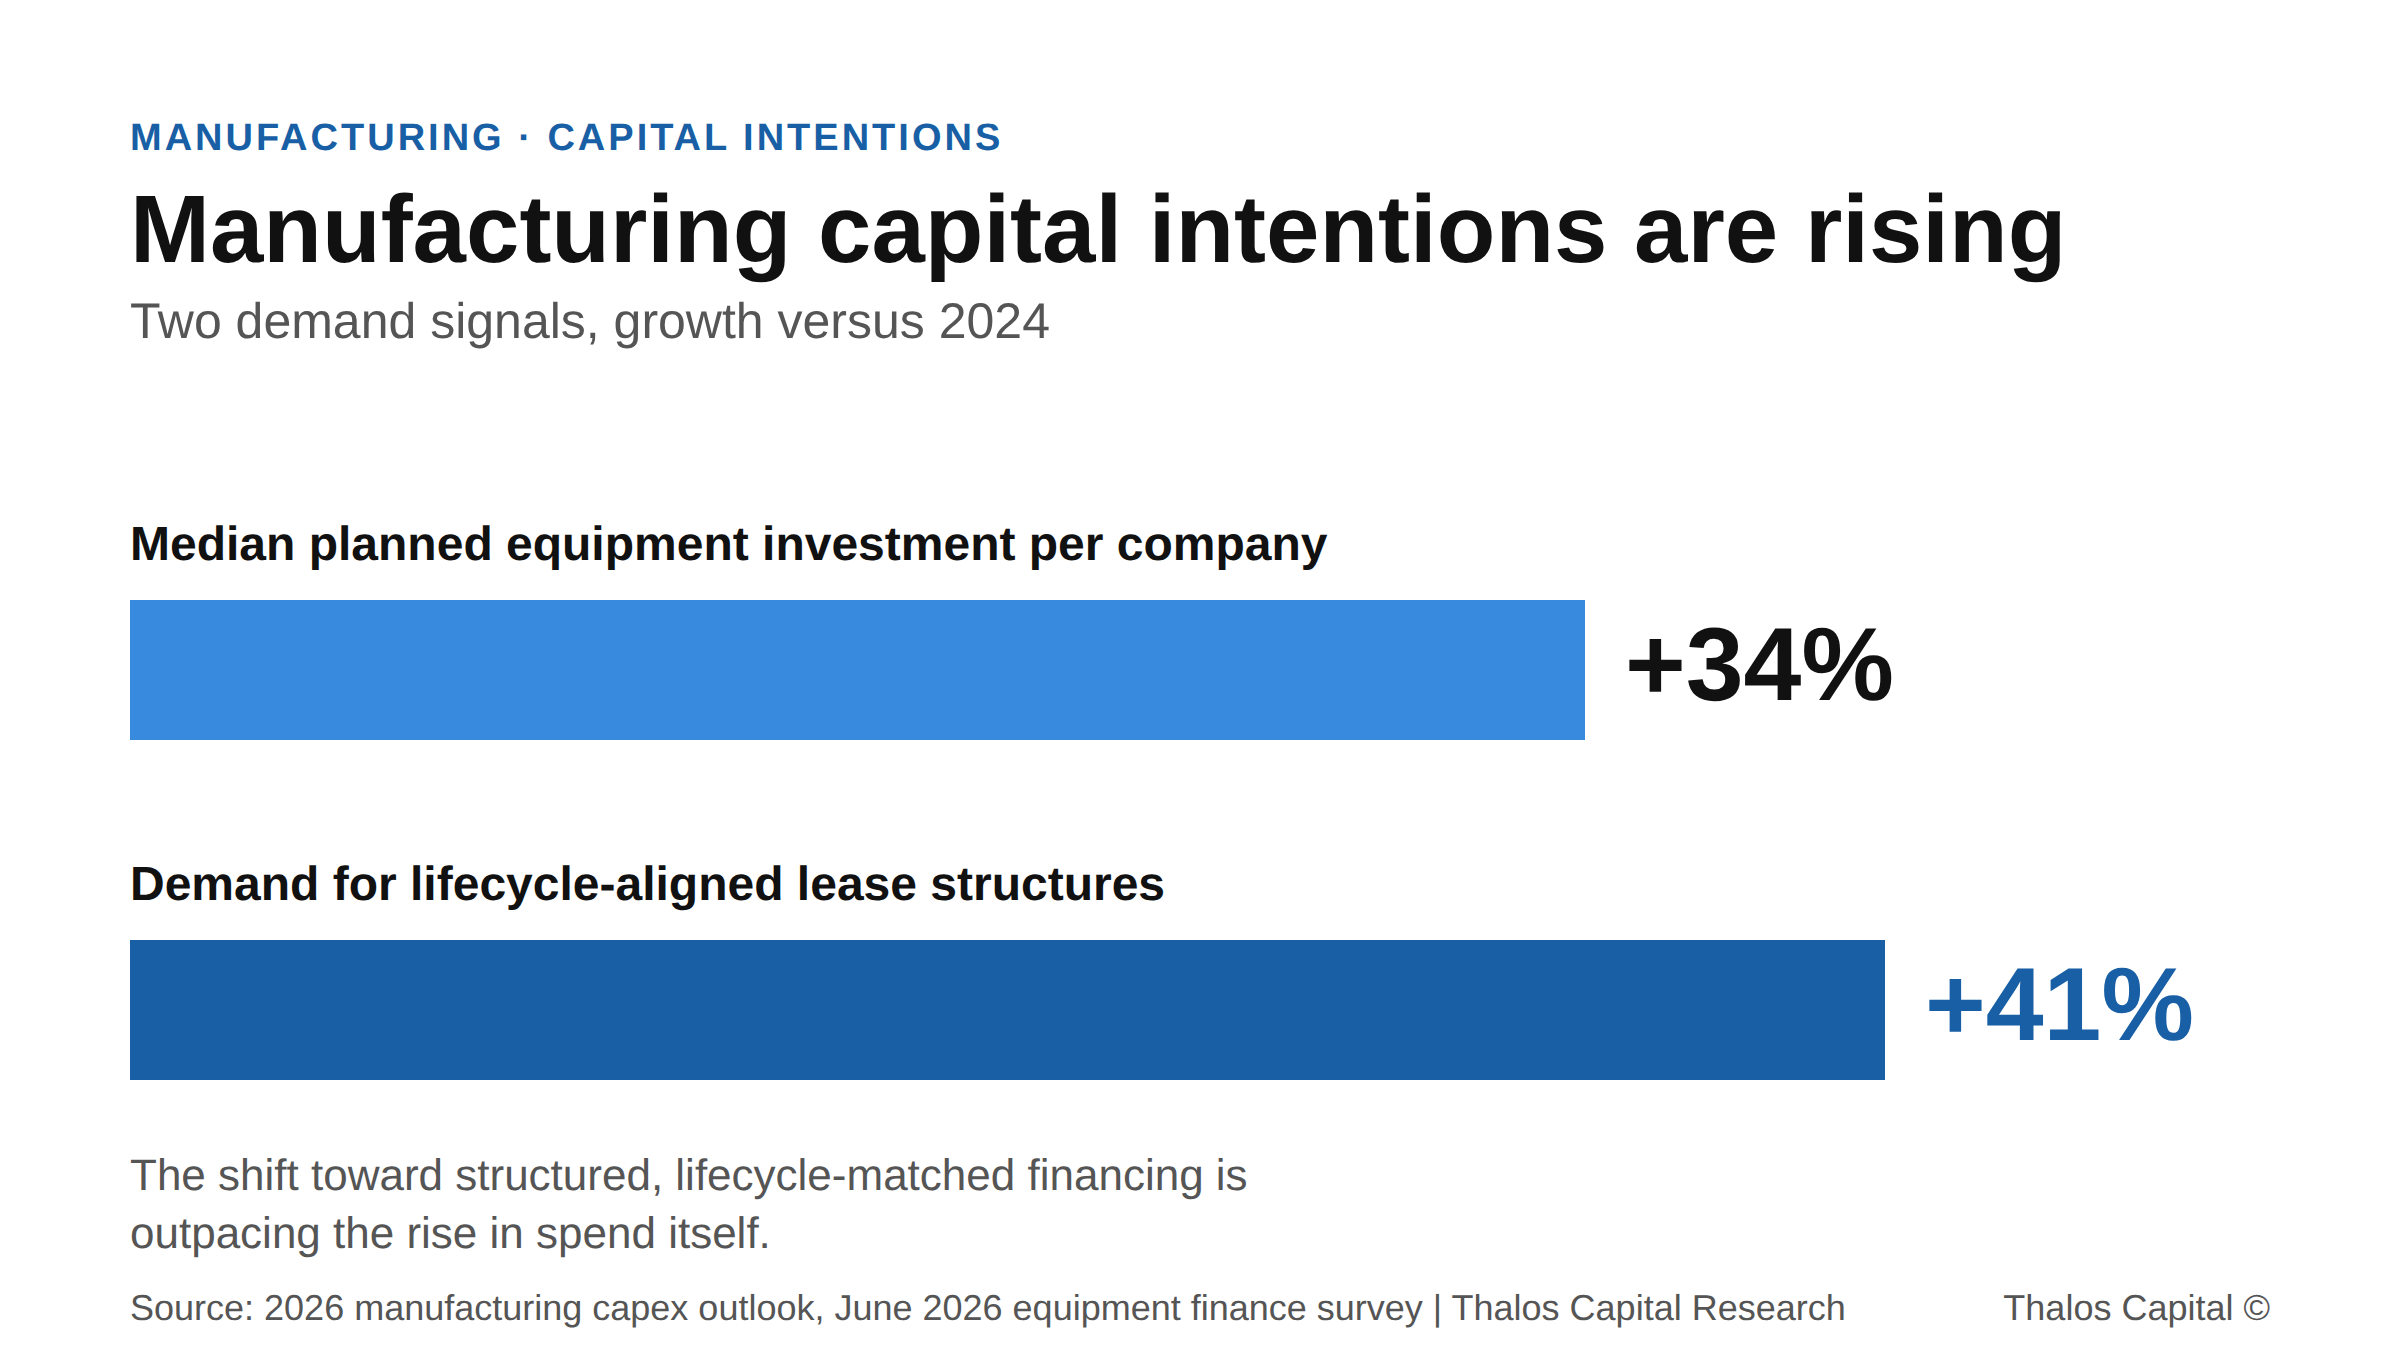
Horizontal bar chart showing manufacturing median planned equipment investment up 34 percent and demand for lifecycle-aligned lease structures up 41 percent versus 2024.

Manufacturers Know What They Need to Buy. The Funding Channel Is the Bottleneck.

Manufacturing capex intentions are at multi-year highs, but conventional bank underwriting is thinning. The bottleneck has shifted from the investment decision to how it gets funded.
Read More
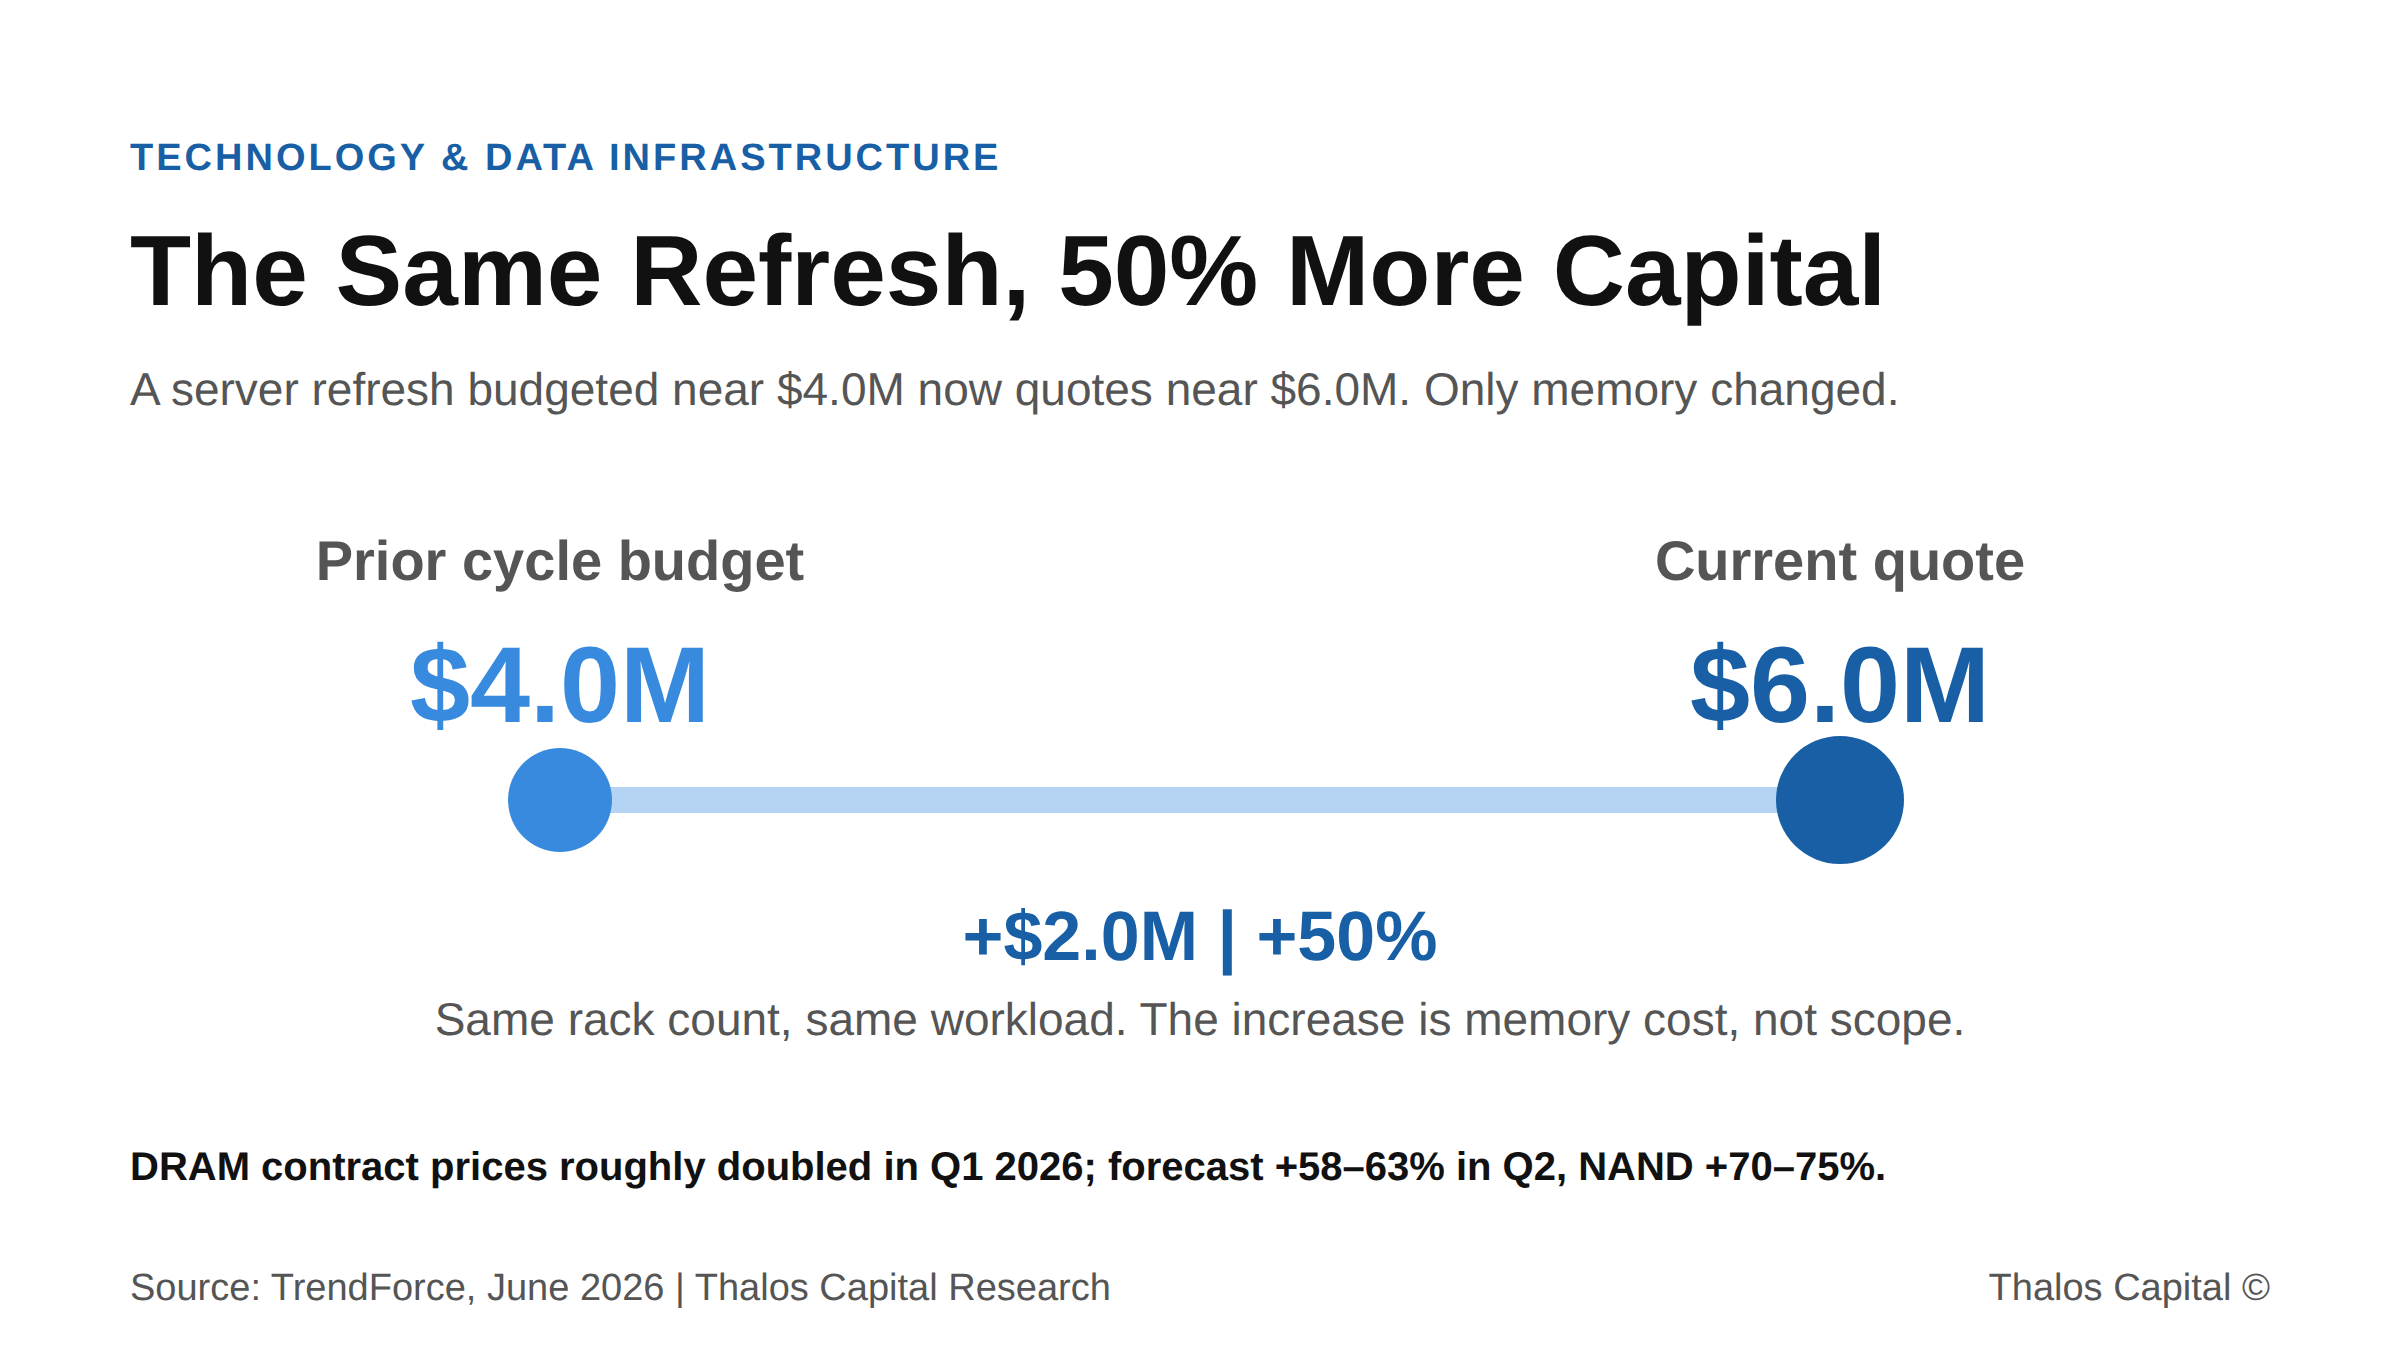
Two-point range chart showing a data-infrastructure refresh rising from a $4.0M prior-cycle budget to a $6.0M current quote, a 50 percent increase driven by 2026 memory price inflation.

The Same Server Refresh Now Costs 50% More: How One Operator Funded It Without Draining the Business

Memory prices doubled in 2026, pushing a $4M server refresh to $6M. How structuring the financing, not paying cash, preserves the liquidity that runs the business.
Read More
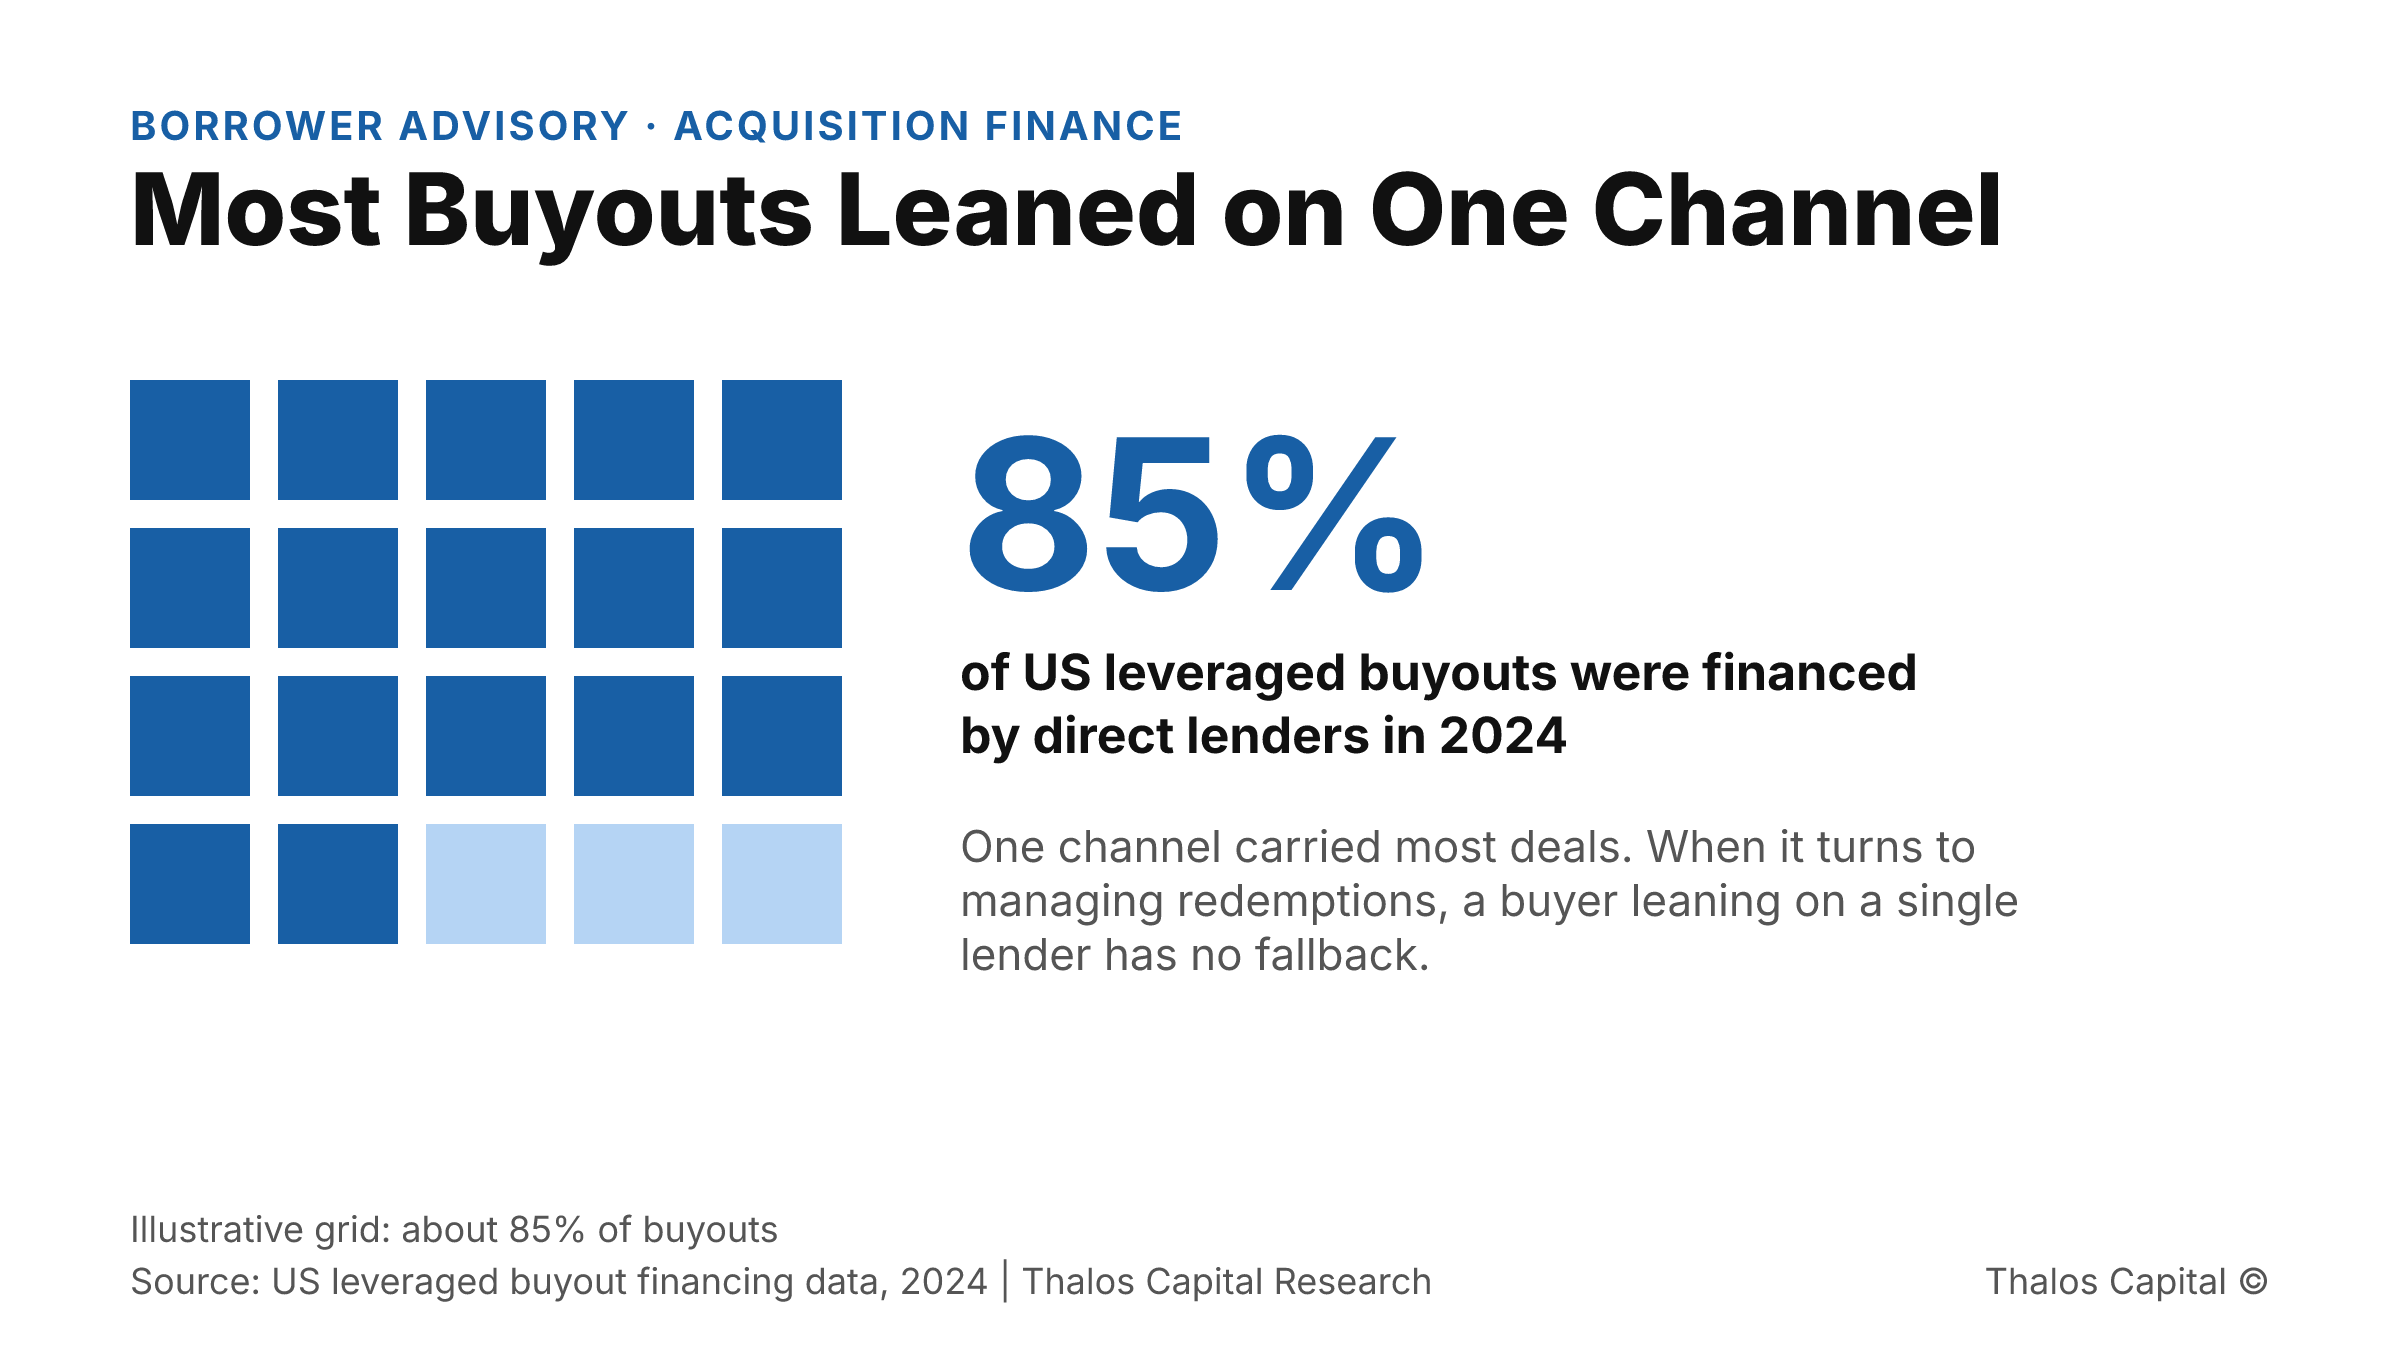
Grid of 20 squares with 17 filled in Thalos navy, illustrating that direct lenders financed about 85% of US leveraged buyouts in 2024.

The Single-Lender Acquisition Is Narrowing Just as Deal Flow Returns

Private credit redemptions jumped 217% in a quarter. For acquirers leaning on one lender, the risk is no longer deal supply, it is certainty of close. Here is the defense.
Read More
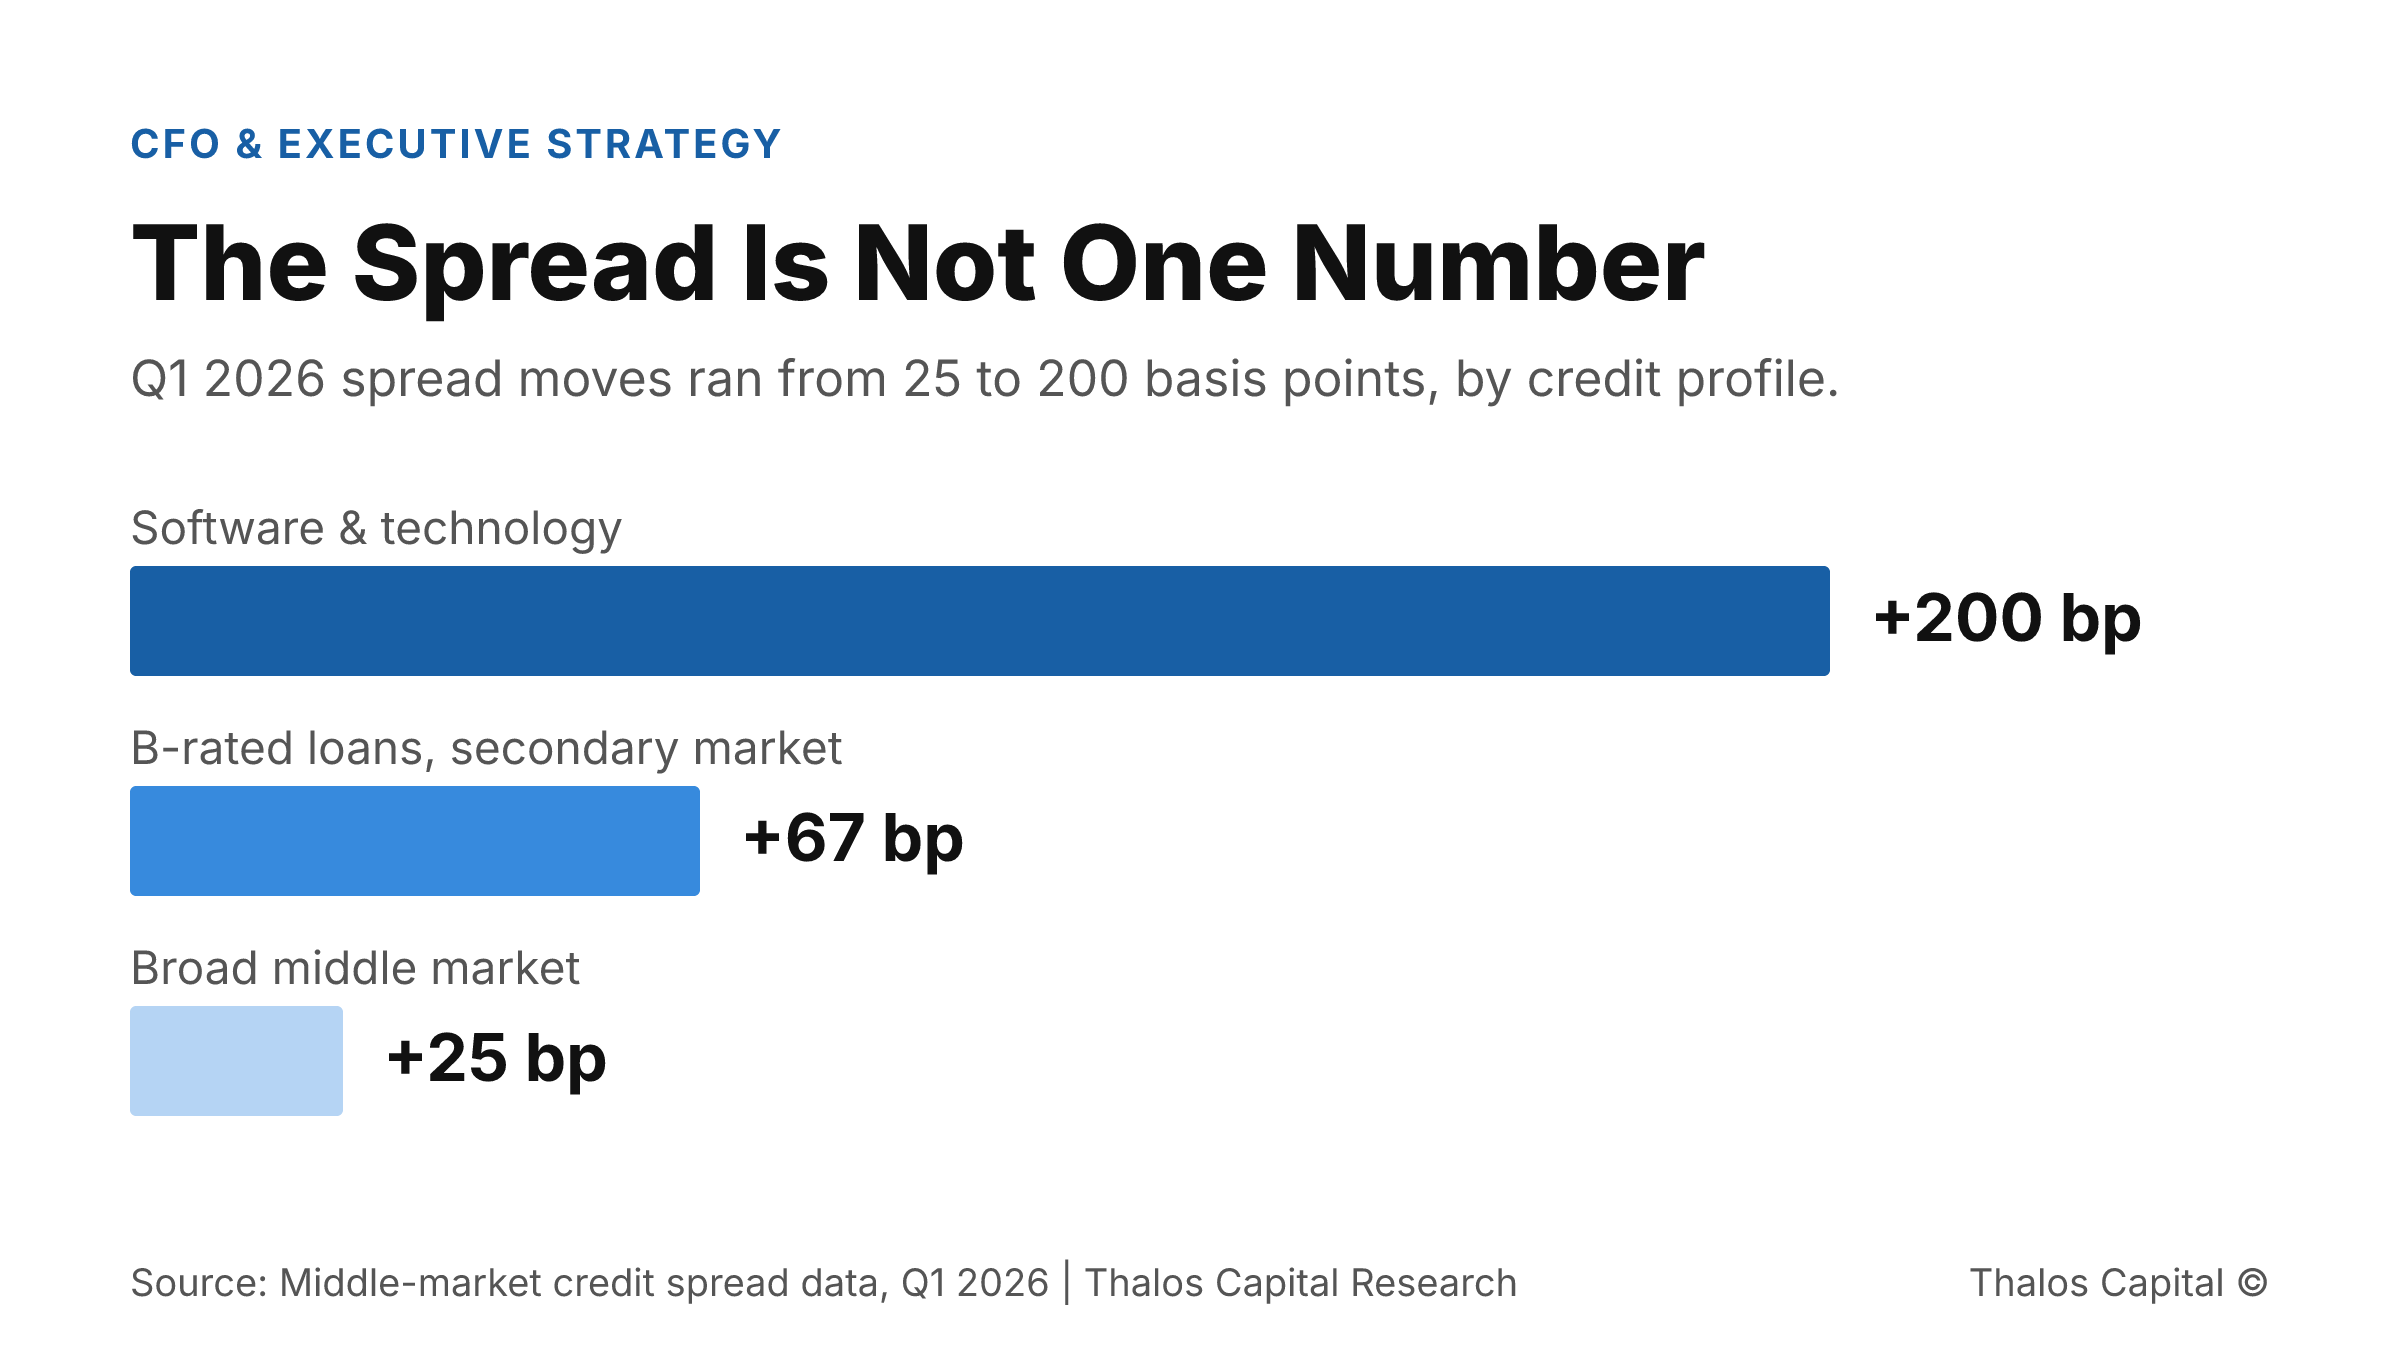
Horizontal bar chart of Q1 2026 middle-market spread moves of 25, 67, and 200 basis points by credit profile.

Lowest Rate, Worst Deal: Why Structure Beats Spread in This Credit Market

The cheapest quoted rate is rarely the lowest cost of capital. With Q1 2026 spreads ranging 25 to 200 bp, structure, not headline spread, decides what a facility actually costs.
Read More
Working through a financing decision?
Insights are a starting point. A conversation maps your actual options.
Tell us what you are financing and we will map the structures and sources that fit.
Submit your financing request →
Explore our financing solutions
Equipment FinancingWorking CapitalAsset-Based LendingStrategic Debt