Category

Borrower Advisory

66 insights · page 6 of 9

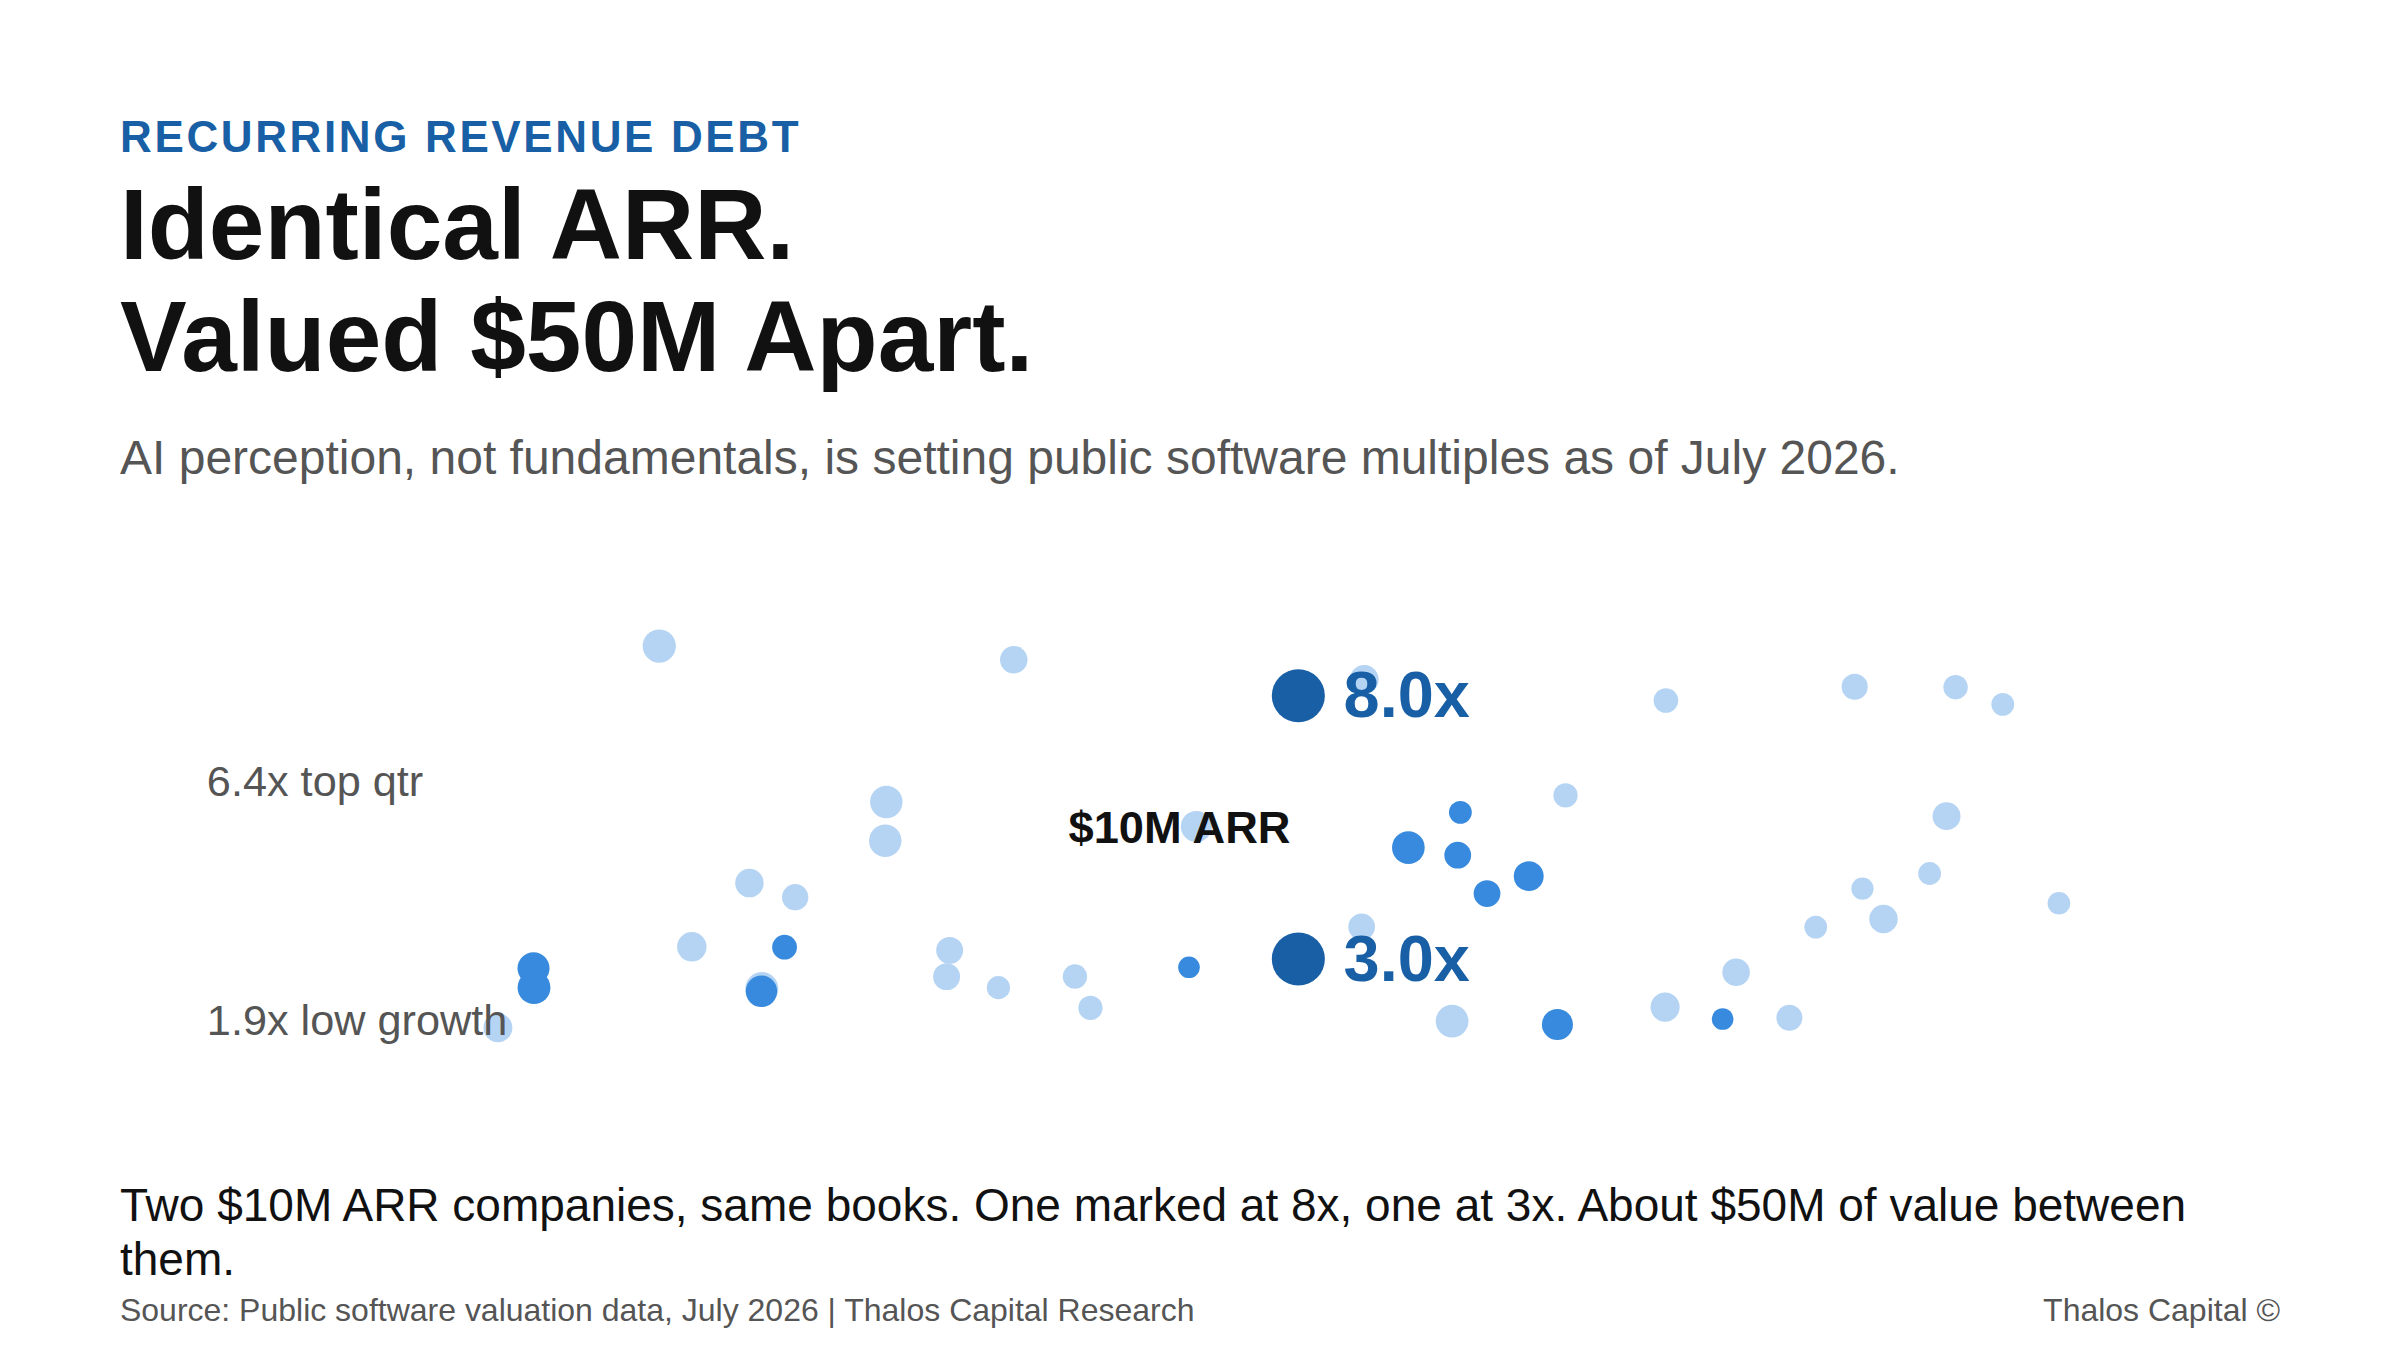
Scatter plot of public SaaS revenue multiples as of July 2026, highlighting two companies with identical $10M ARR marked at 8x and 3x revenue.

AI Perception Is Setting Software Valuations. It Is Not Setting Your Credit.

As of July 2026, AI perception sets software valuations more than fundamentals do. Two identical-ARR companies can be marked $50M apart. A lender reads your contracts, not your narrative.
Read More
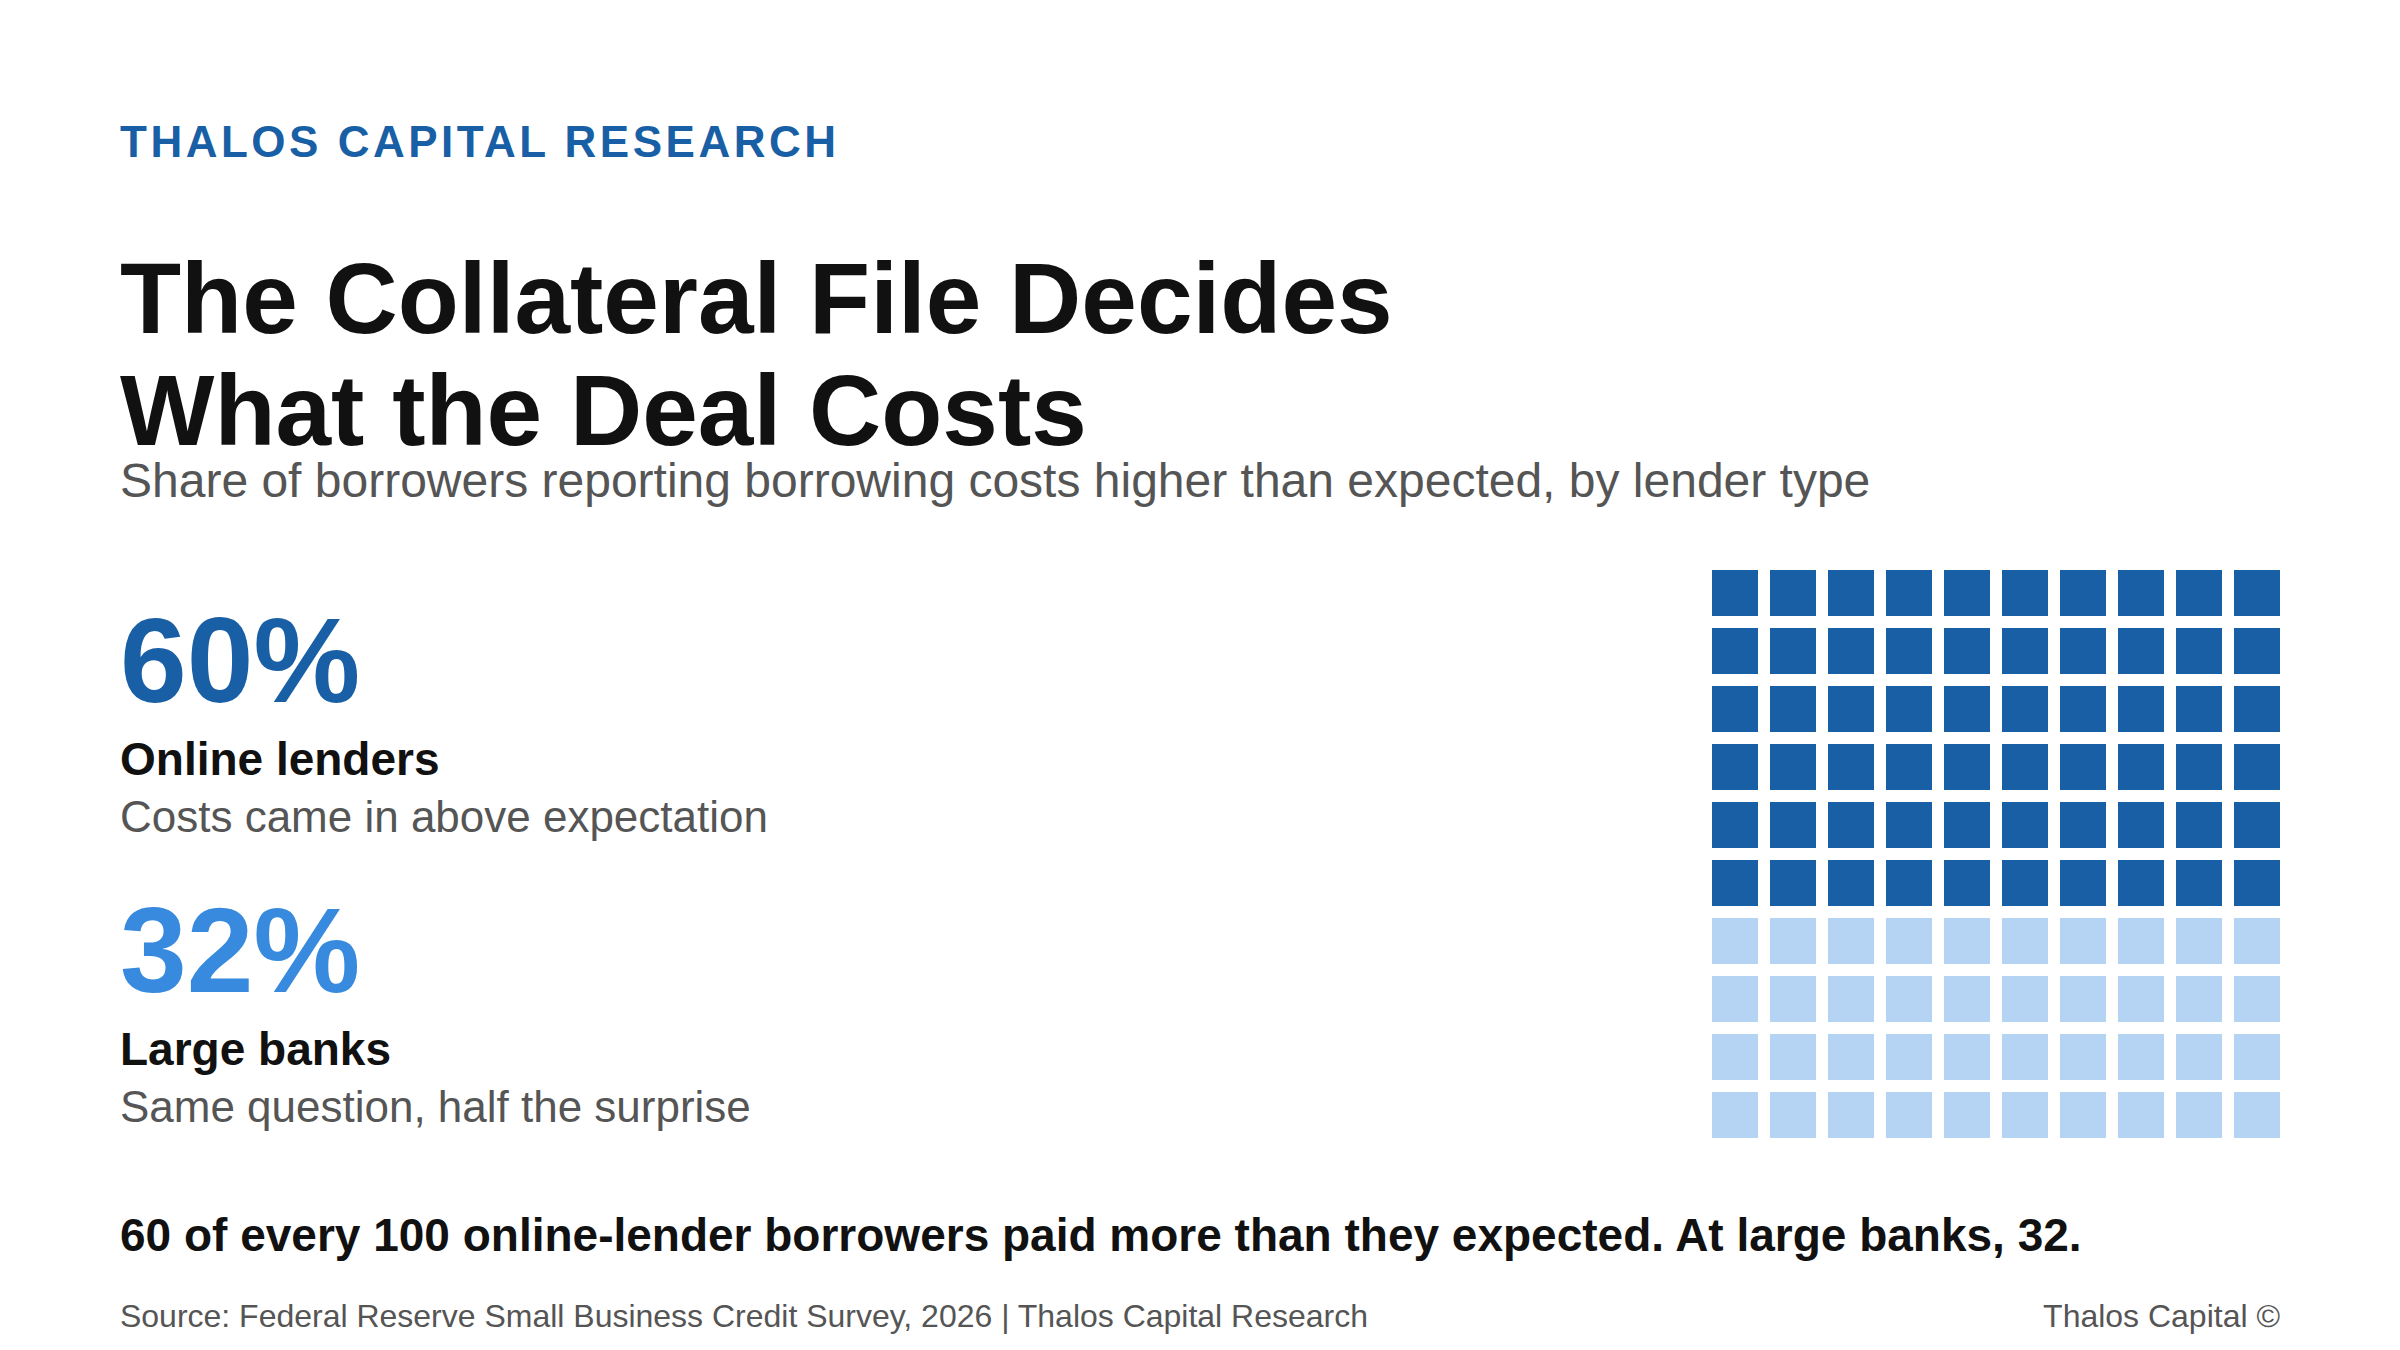
Waffle chart showing 60 of 100 squares in dark navy, representing the 60 percent of online-lender borrowers who reported borrowing costs higher than expected, compared with 32 percent at large banks.

Collateral Verification Is Now the First Diligence Question, Not the Last

Sixty percent of online-lender borrowers paid more than they expected. The gap is not about lender type. It is about what the borrower verified before the process started.
Read More
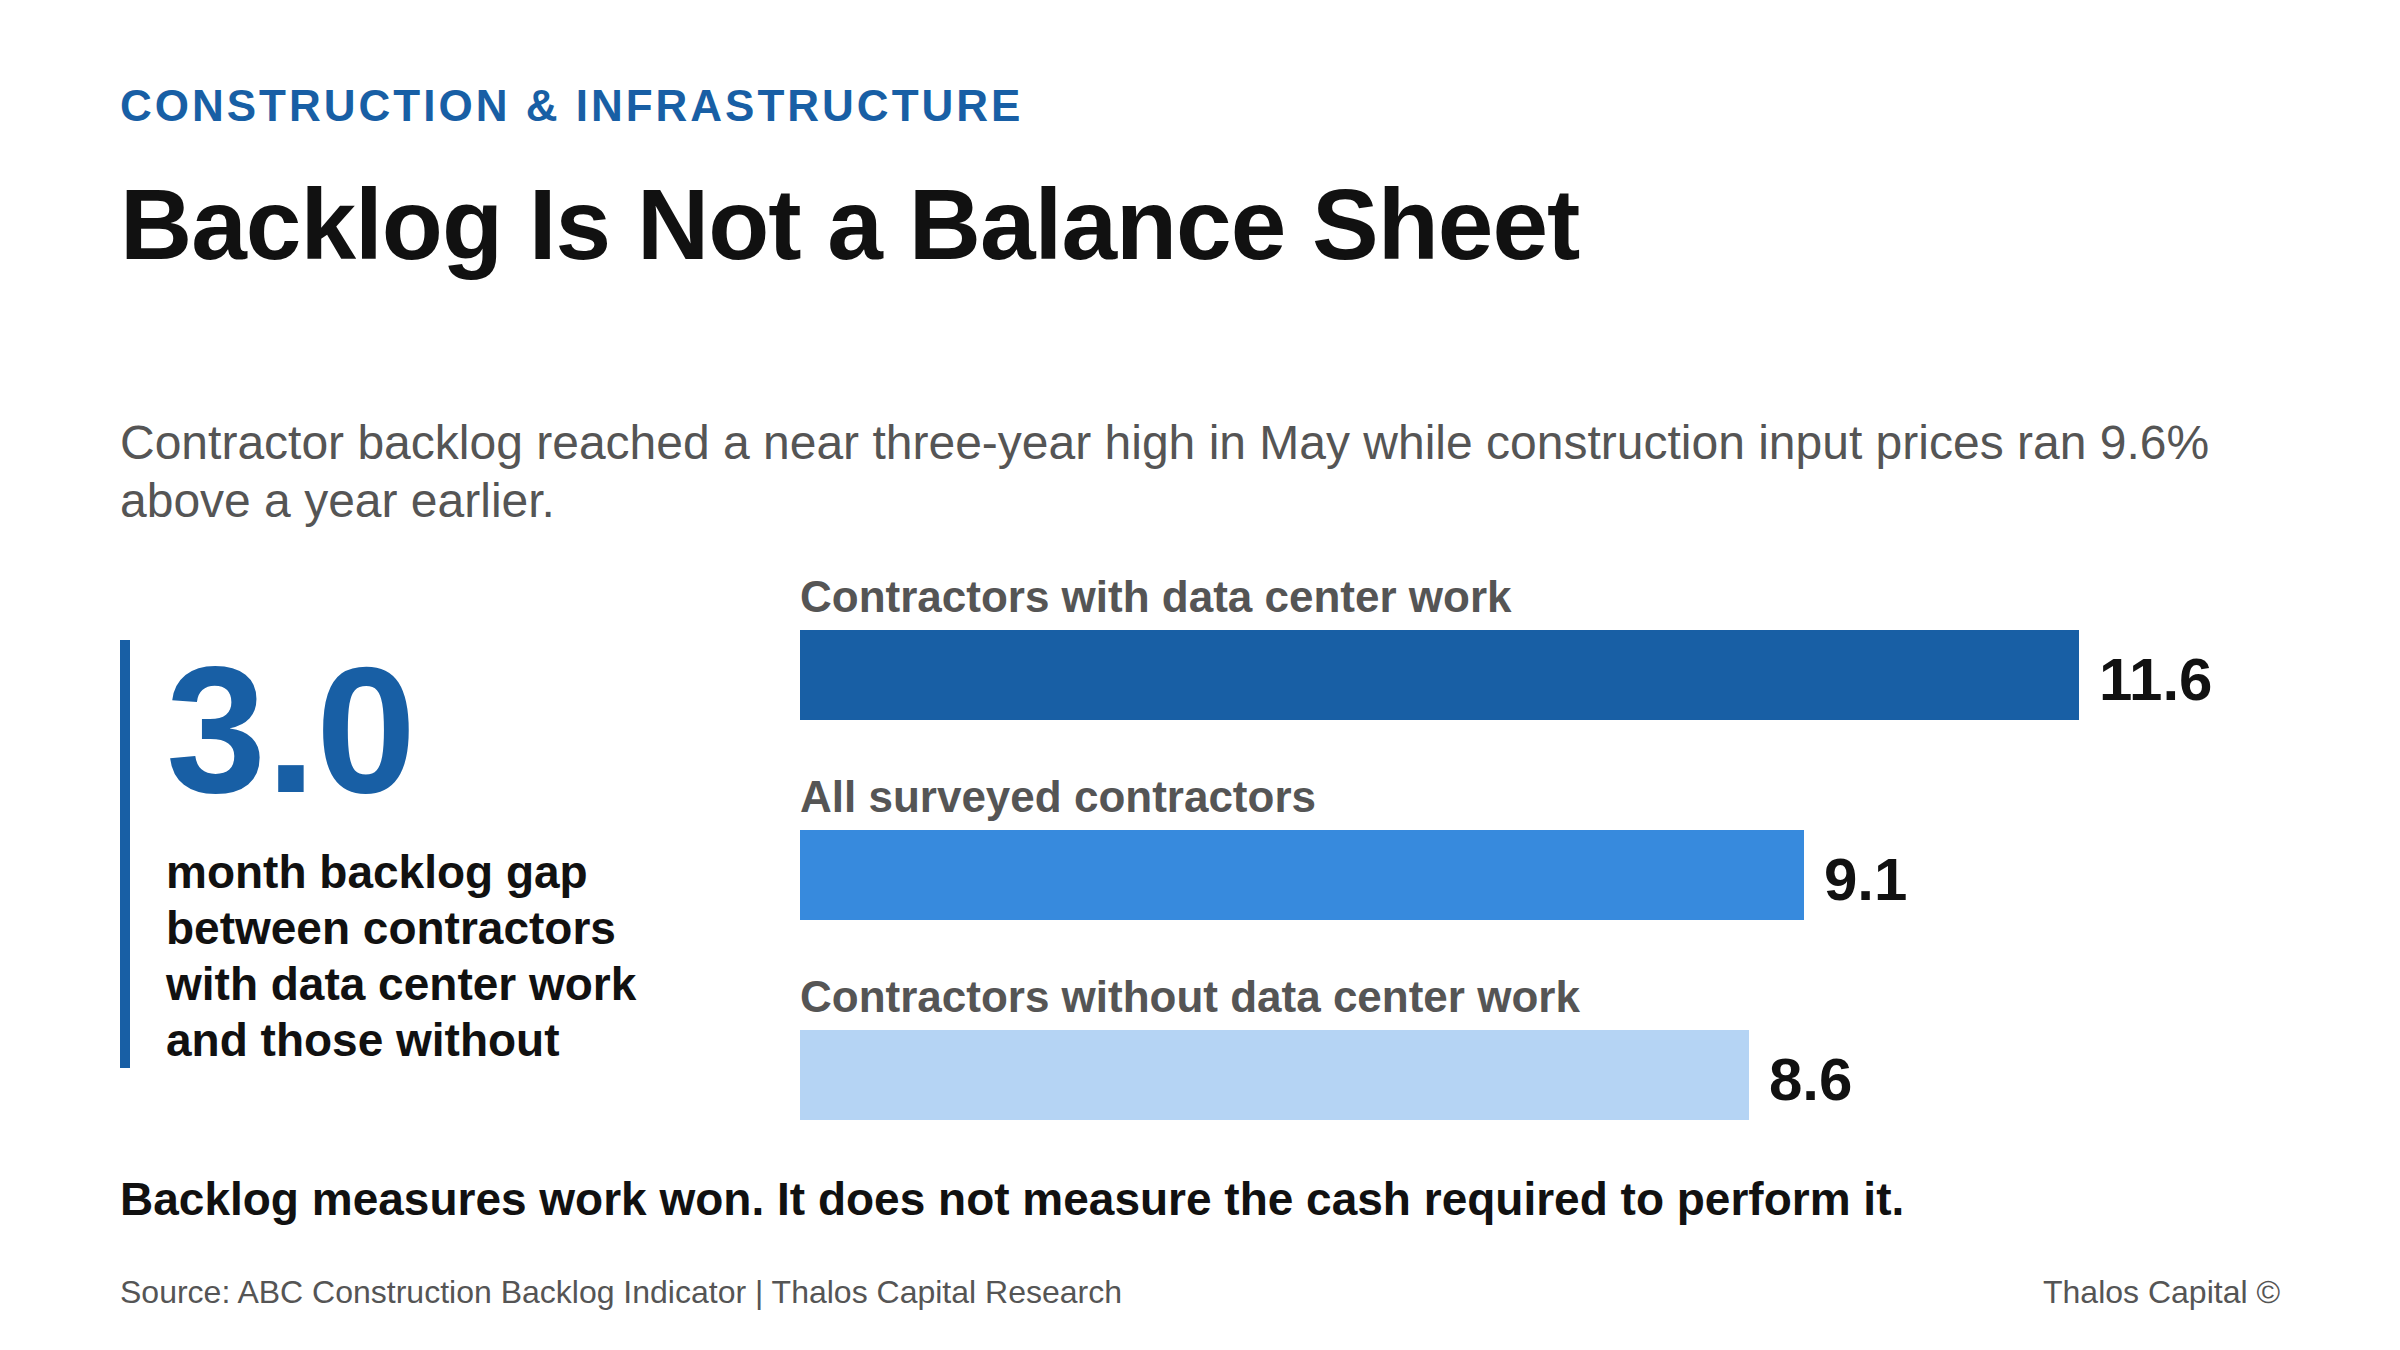
Horizontal bar chart of May 2026 construction backlog in months, showing 11.6 months for contractors with data center work, 9.1 months across all surveyed contractors, and 8.6 months for contractors without data center work, a three-month gap.

Construction Backlog Is Not a Balance Sheet

Contractor backlog hit a near three-year high while input prices ran 9.6% above a year earlier. Why a full order book is a financing liability before it is an asset, and how to structure against it.
Read More
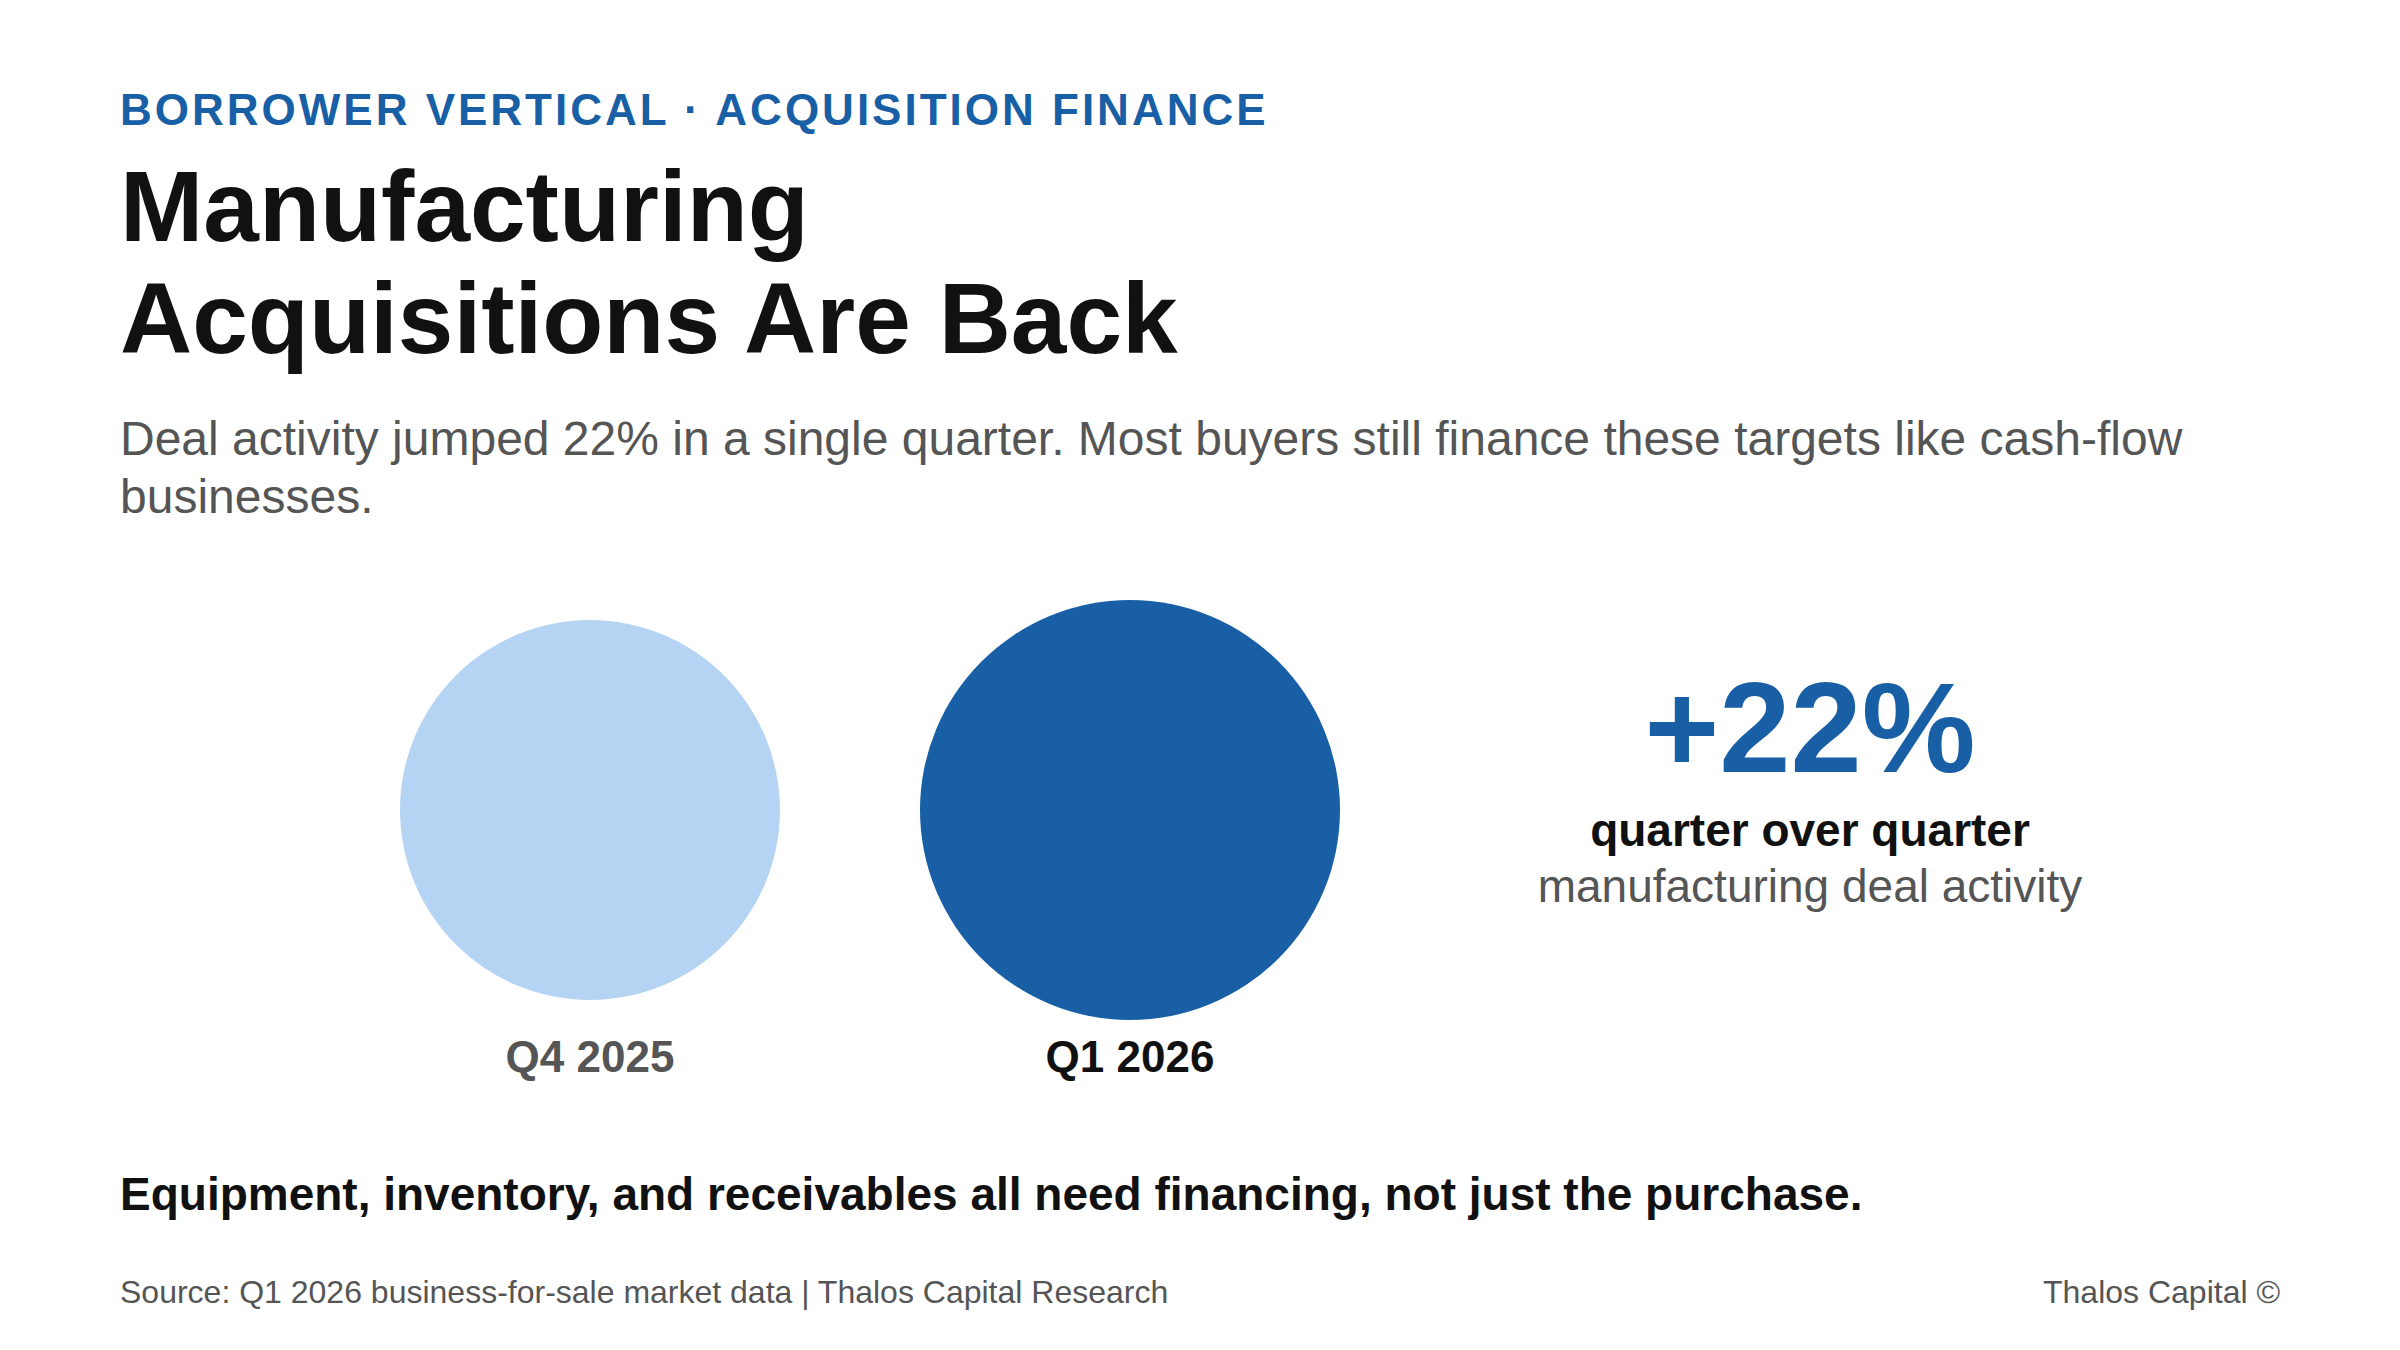
Two proportional circles showing small manufacturing acquisition activity rising 22 percent from Q4 2025 to Q1 2026, with a caption that equipment, inventory, and receivables all need financing, not just the purchase.

Manufacturing Acquisitions Are Back. Financing Them Like a Cash-Flow Buyout Isn't.

Manufacturing acquisitions jumped 22% in Q1 2026, but buyers financing them with a single acquisition loan leave equipment, inventory, and working capital unfunded. Why asset-heavy deals need a blended capital stack.
Read More
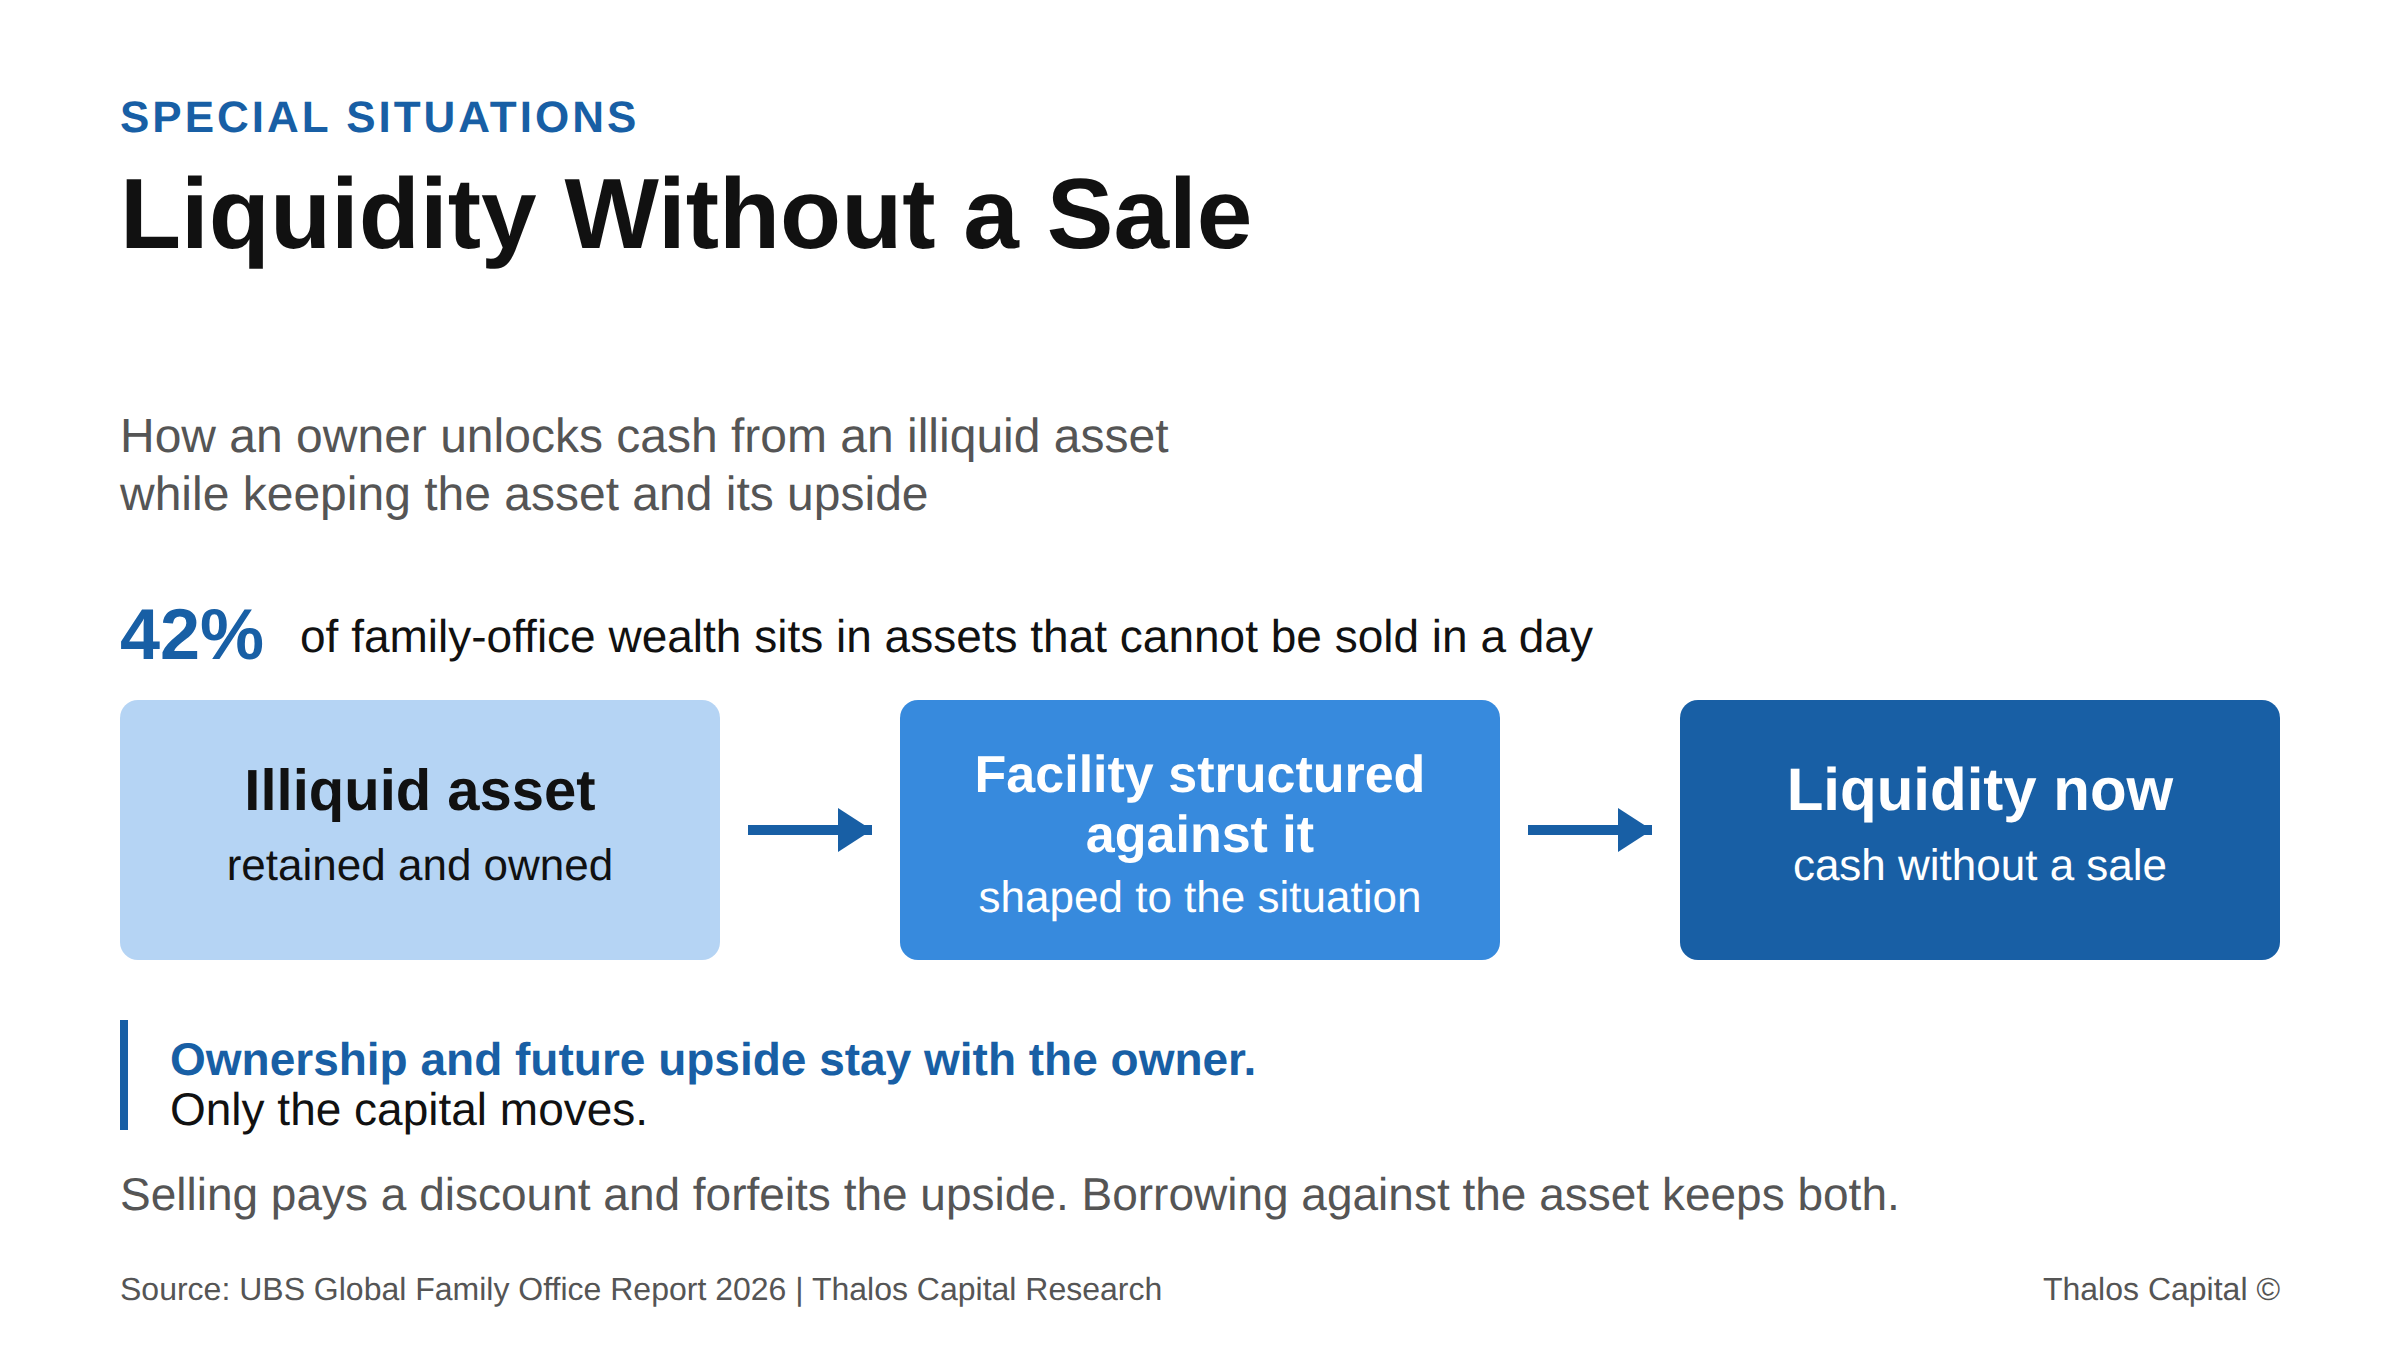
Anatomy diagram showing an illiquid asset retained by its owner, a facility structured against it, and liquidity released while ownership and future upside are kept.

Selling the Asset Is the Most Expensive Way to Raise Cash

Selling an illiquid asset to raise cash costs twice, in discount and in forfeited upside. How owners unlock liquidity by borrowing against the asset instead of selling it.
Read More
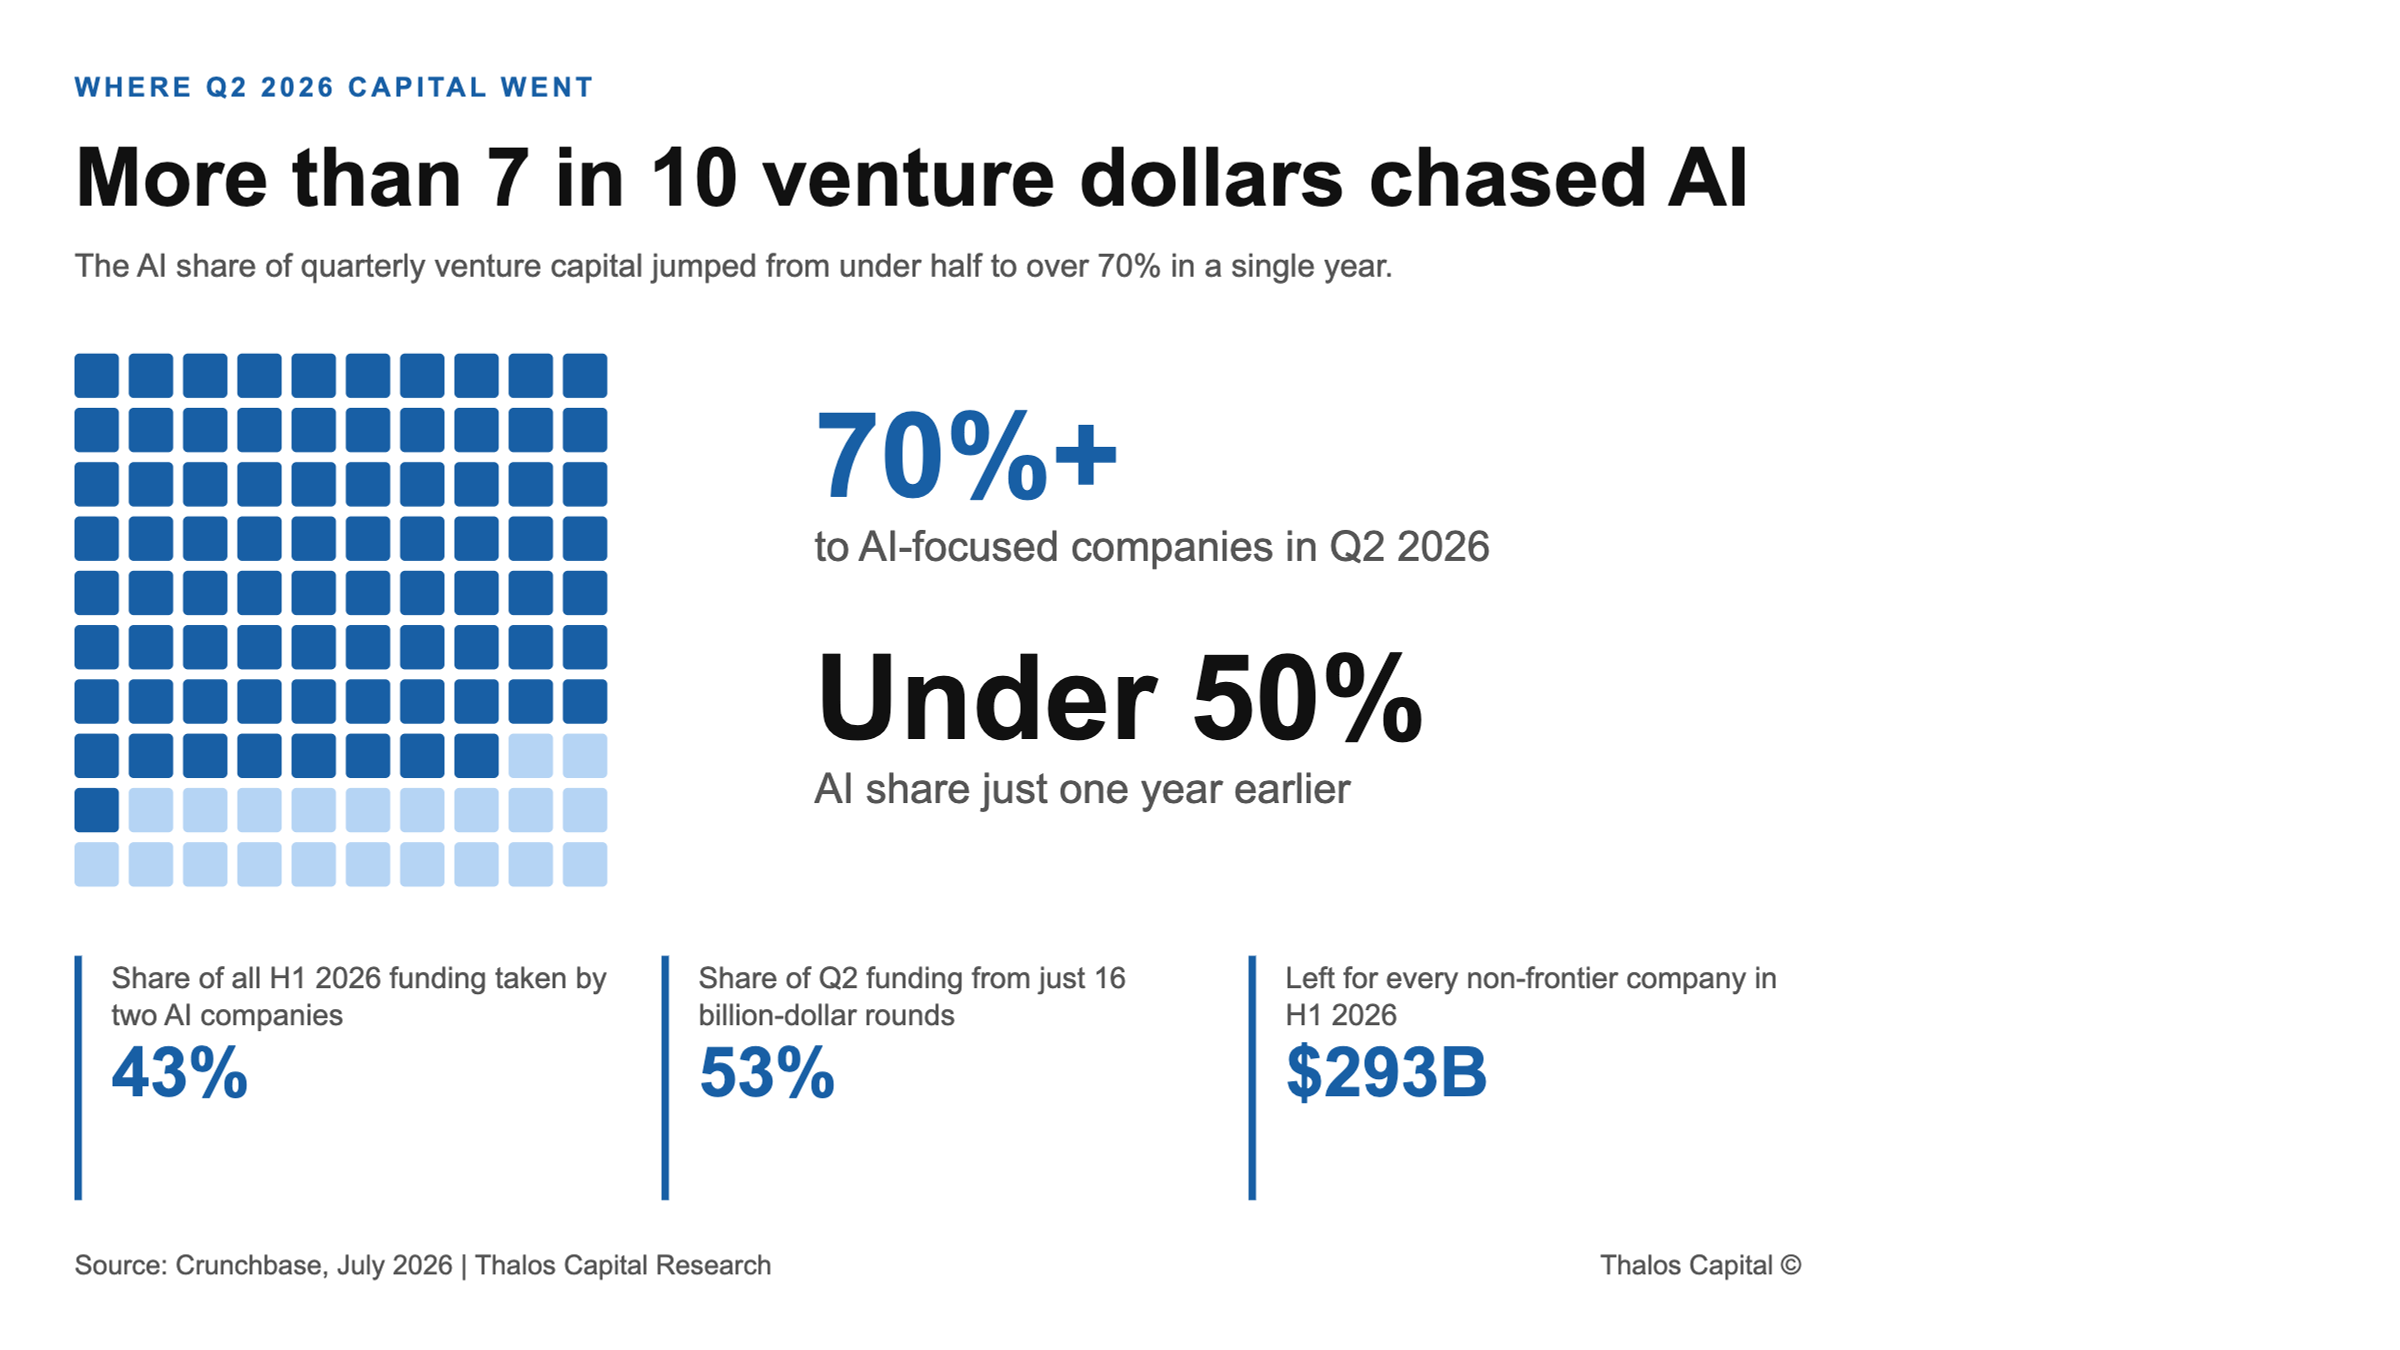
Waffle chart of 100 squares showing more than 70% of Q2 2026 venture capital going to AI-focused companies, up from under 50% a year earlier, with 43% of all H1 2026 funding taken by two AI companies and $293B left for every other company.

The Record Funding Year Is Not Funding You

Venture funding hit a record $510B in H1 2026, but 43% went to two AI companies. Why recurring-revenue tech founders are misreading the headline, and the non-dilutive alternative.
Read More
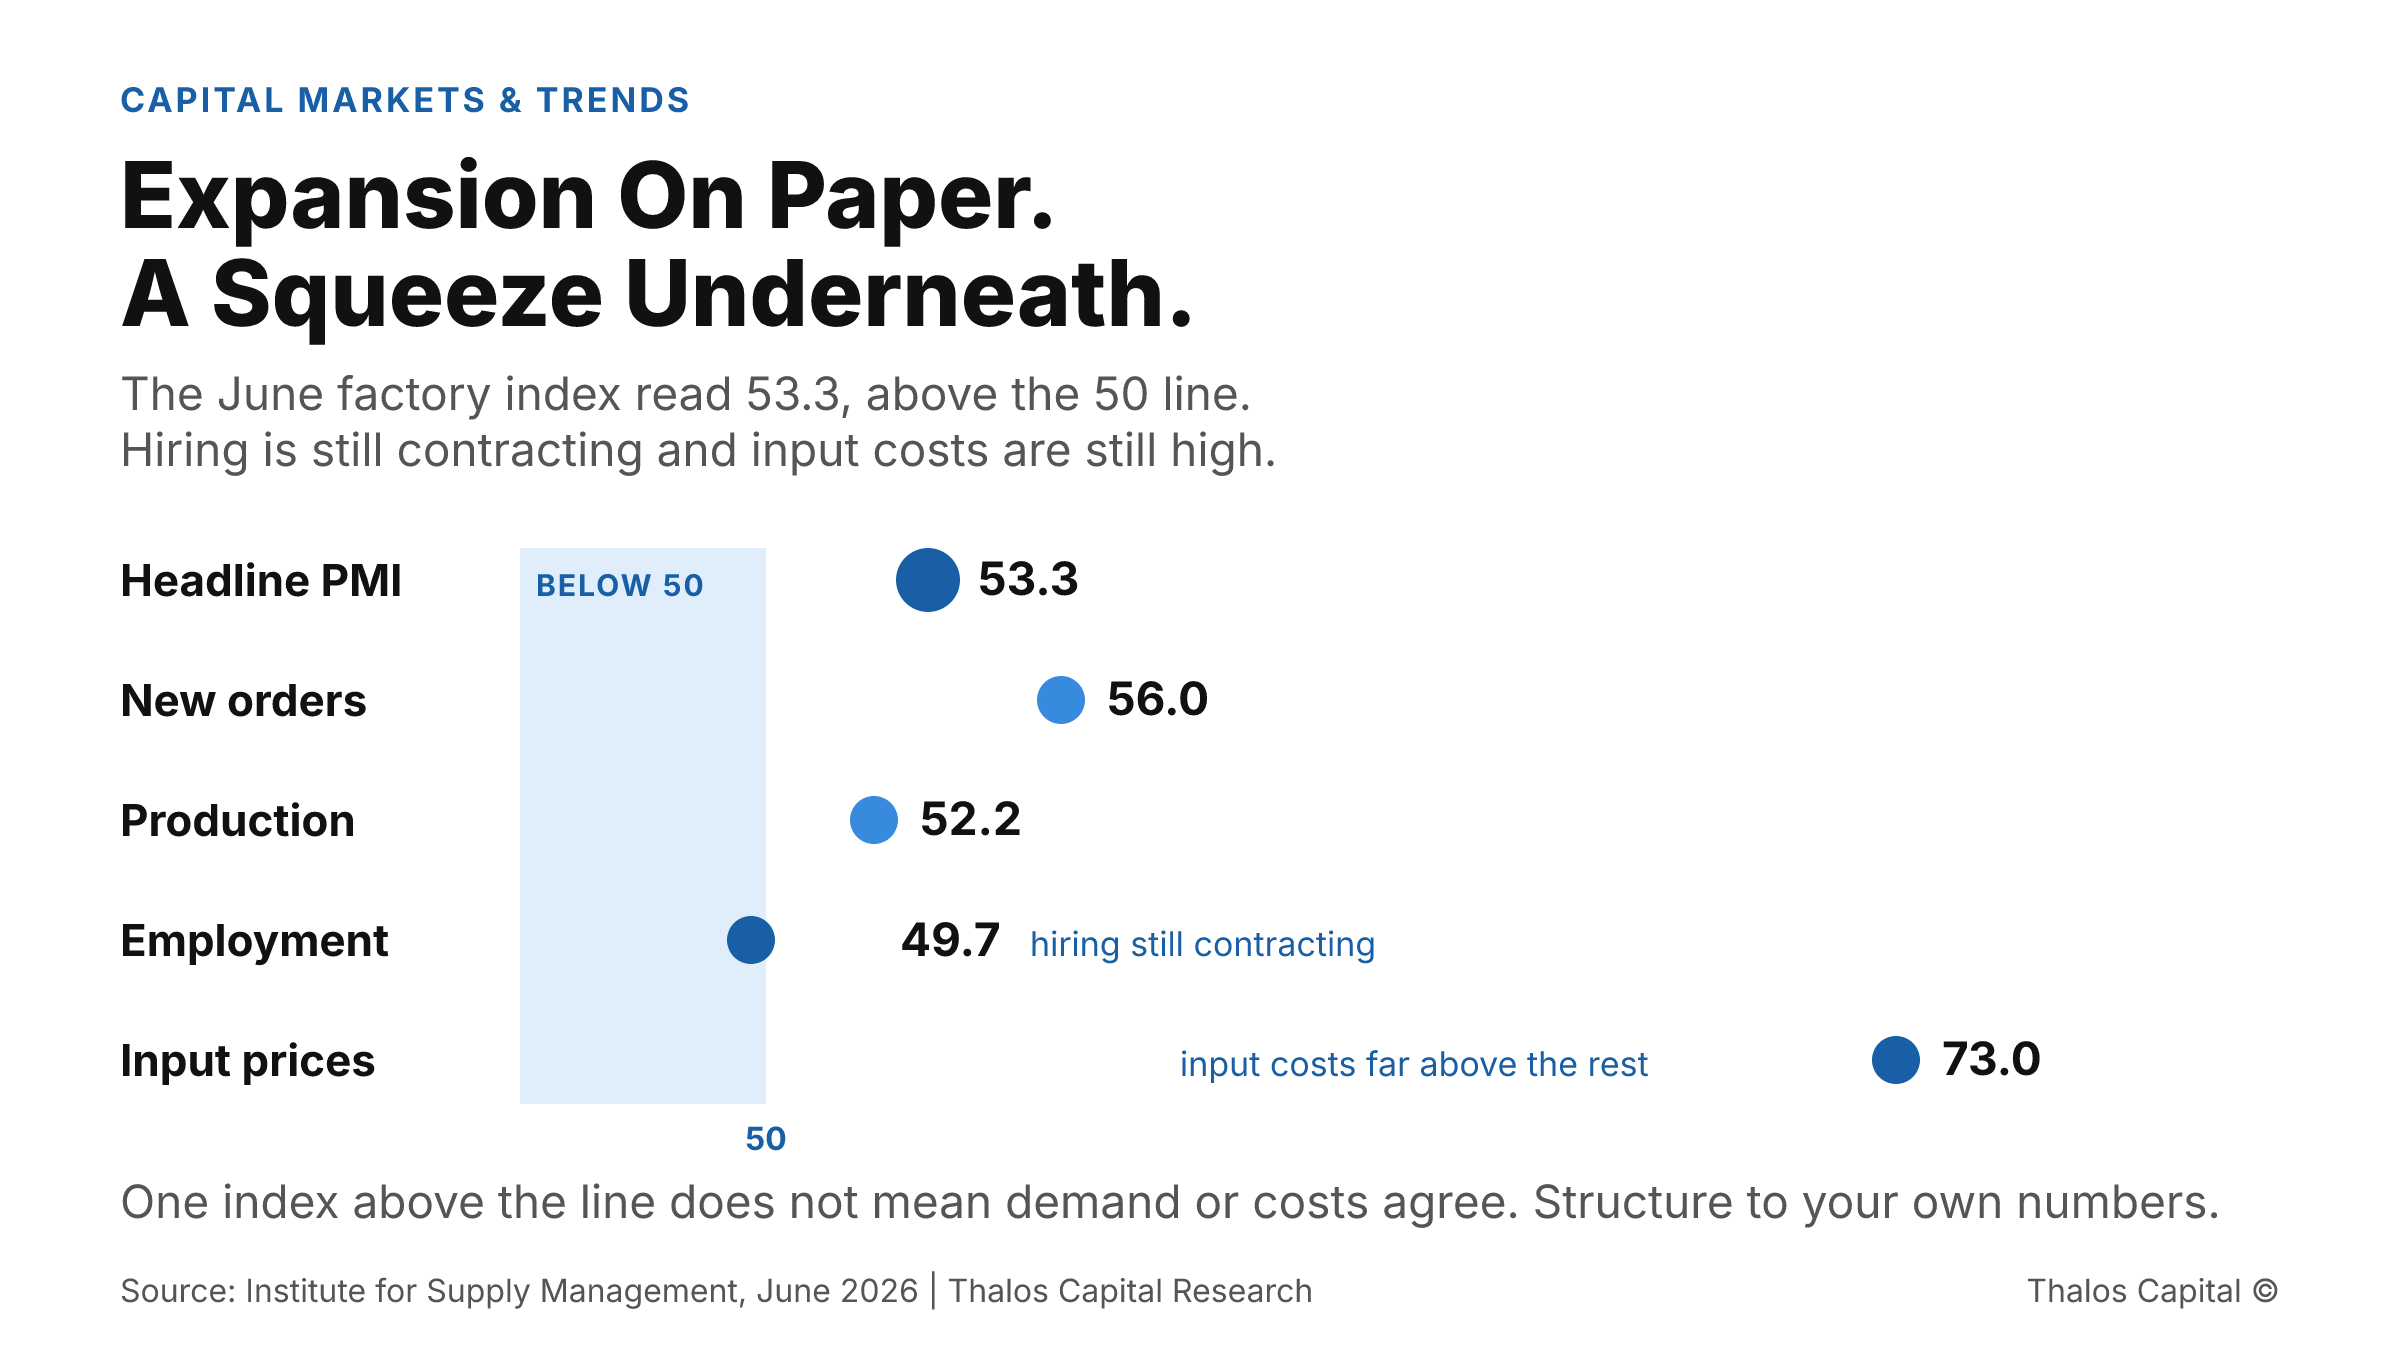
Dot plot of June 2026 factory index components showing headline PMI at 53.3 above the 50 line while employment sits at 49.7 in contraction and input prices at 73.0 remain elevated.

Expansion On Paper. A Squeeze Underneath.

A factory index above 50 reads as a growth signal, but hiring is still contracting and input costs are still high. Why financing sized to the headline misreads a margin story as a volume story.
Read More
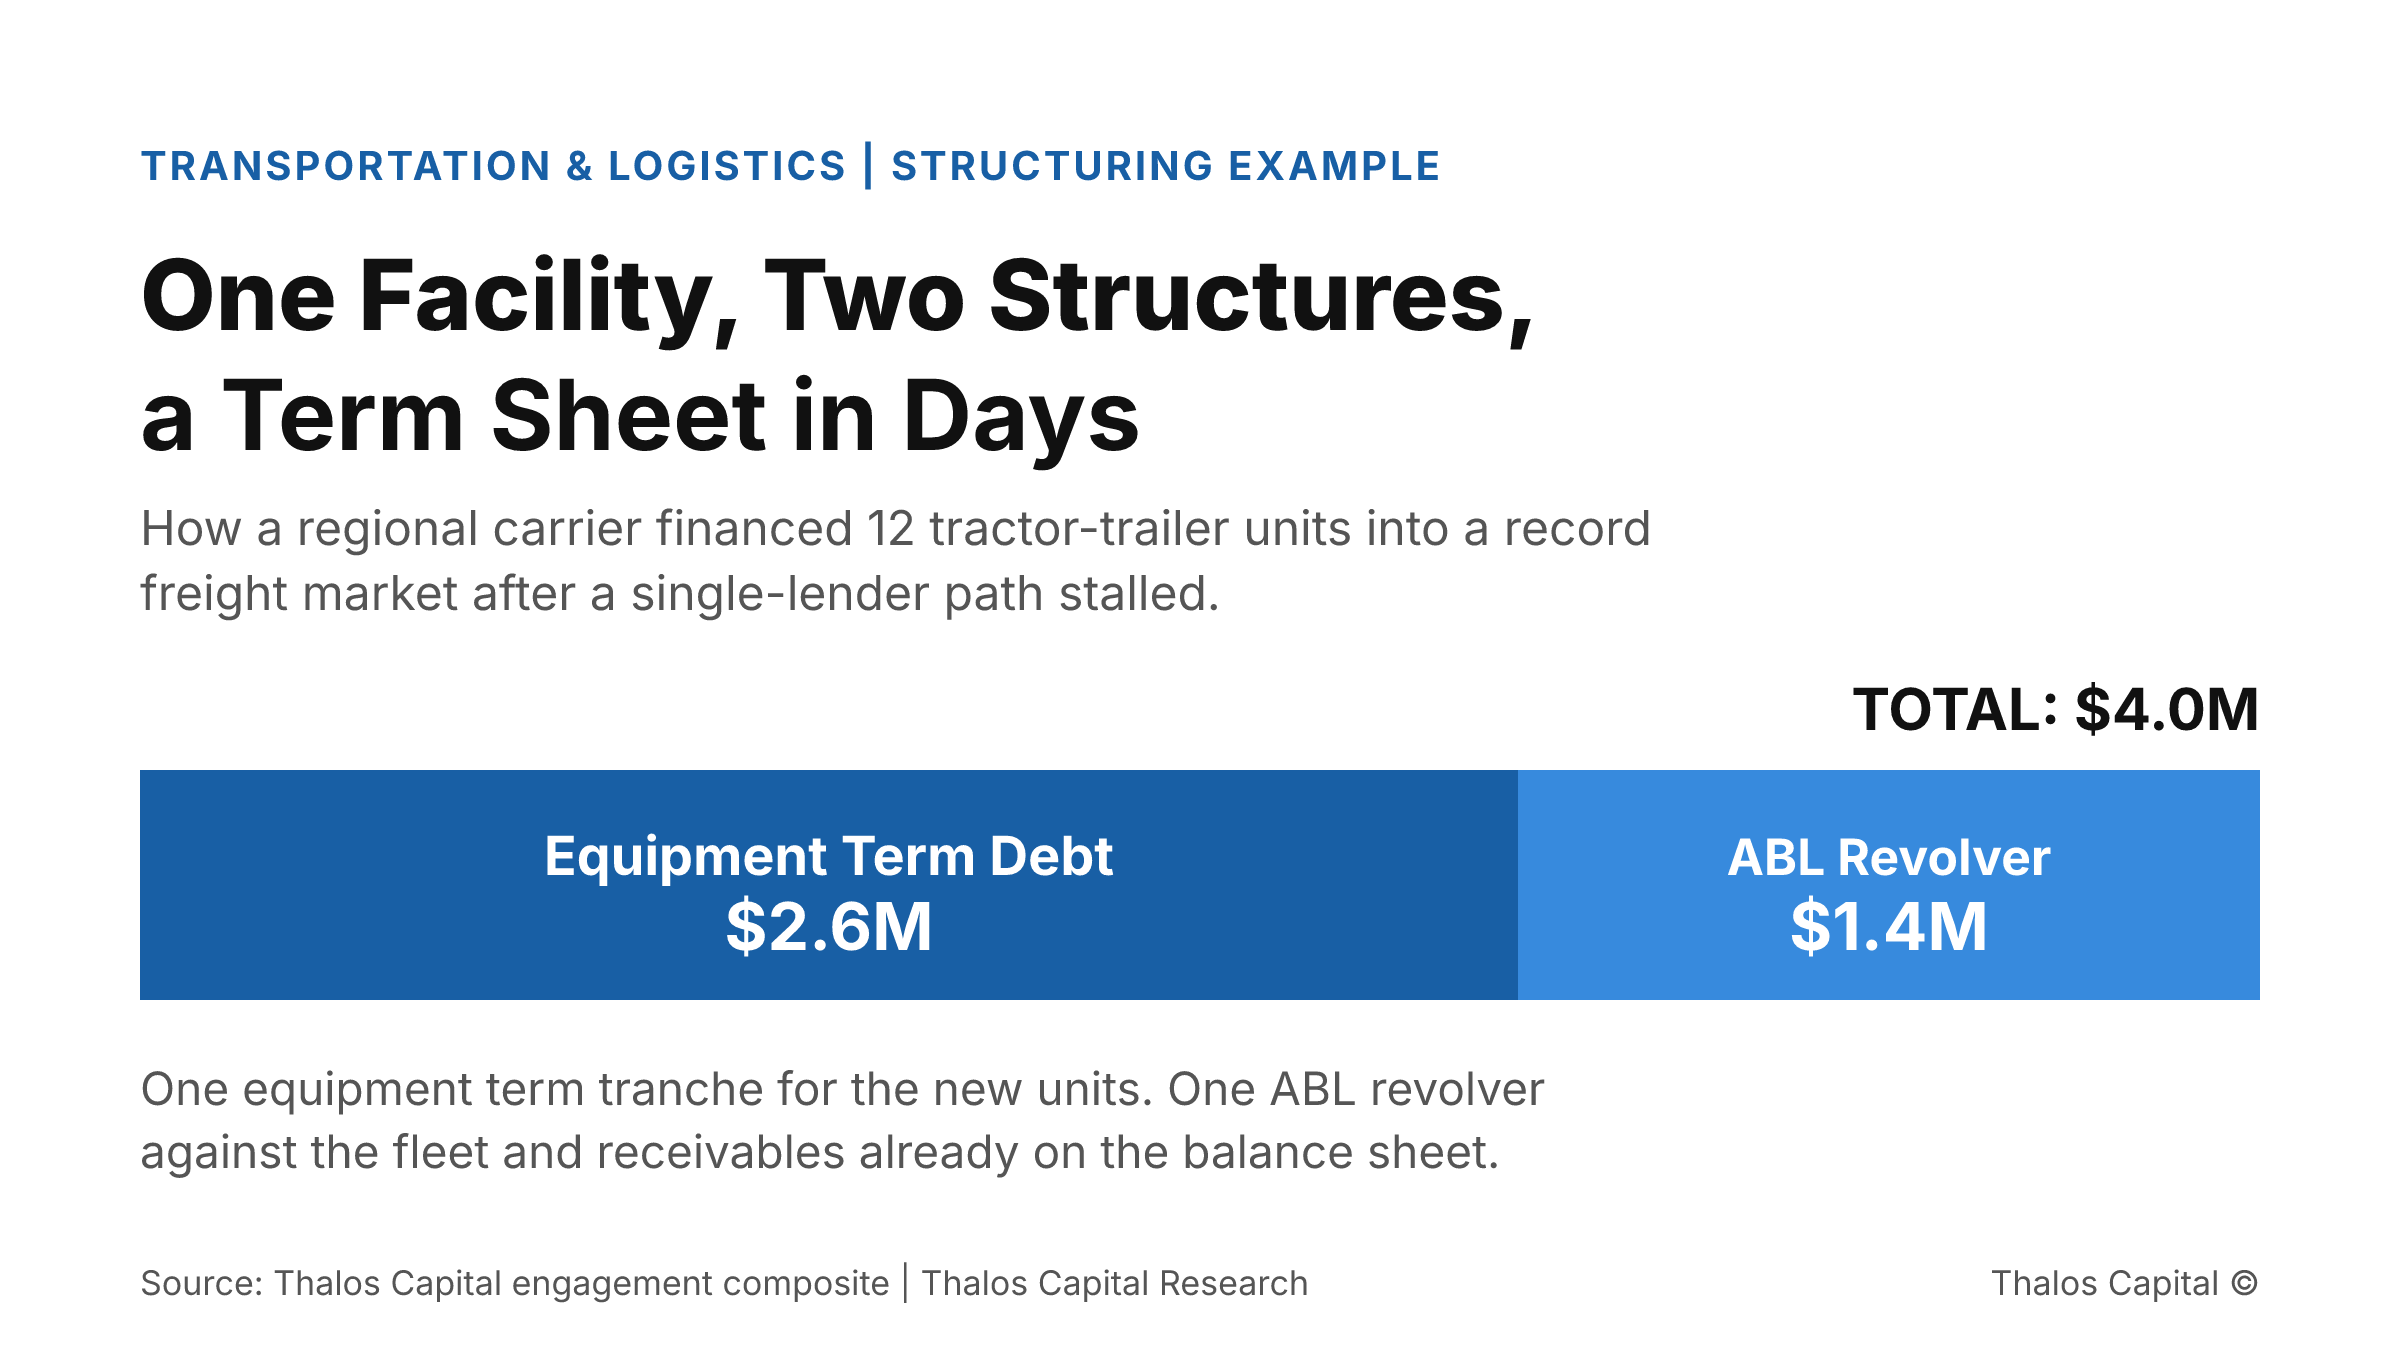
Single stacked bar showing a $4.0 million carrier facility split into a $2.6 million equipment term tranche for 12 tractor-trailer units and a $1.4 million ABL revolver.

How One Regional Carrier Financed Fleet Expansion Into a Record Market After the Bank Said No

US truckload spot rates hit a record $3.83 per mile, but recession-scarred balance sheets stall bank-only expansion. How one carrier structured $4.0M to add trucks in days.
Read More
Working through a financing decision?
Insights are a starting point. A conversation maps your actual options.
Tell us what you are financing and we will map the structures and sources that fit.
Submit your financing request →
Explore our financing solutions
Equipment FinancingWorking CapitalAsset-Based LendingStrategic Debt