Thalos Capital Research

Insights

Commercial finance analysis and practical guidance, equipment, working capital, asset-based lending, and strategic debt, for business owners, executives, and finance leaders across the United States and Canada.

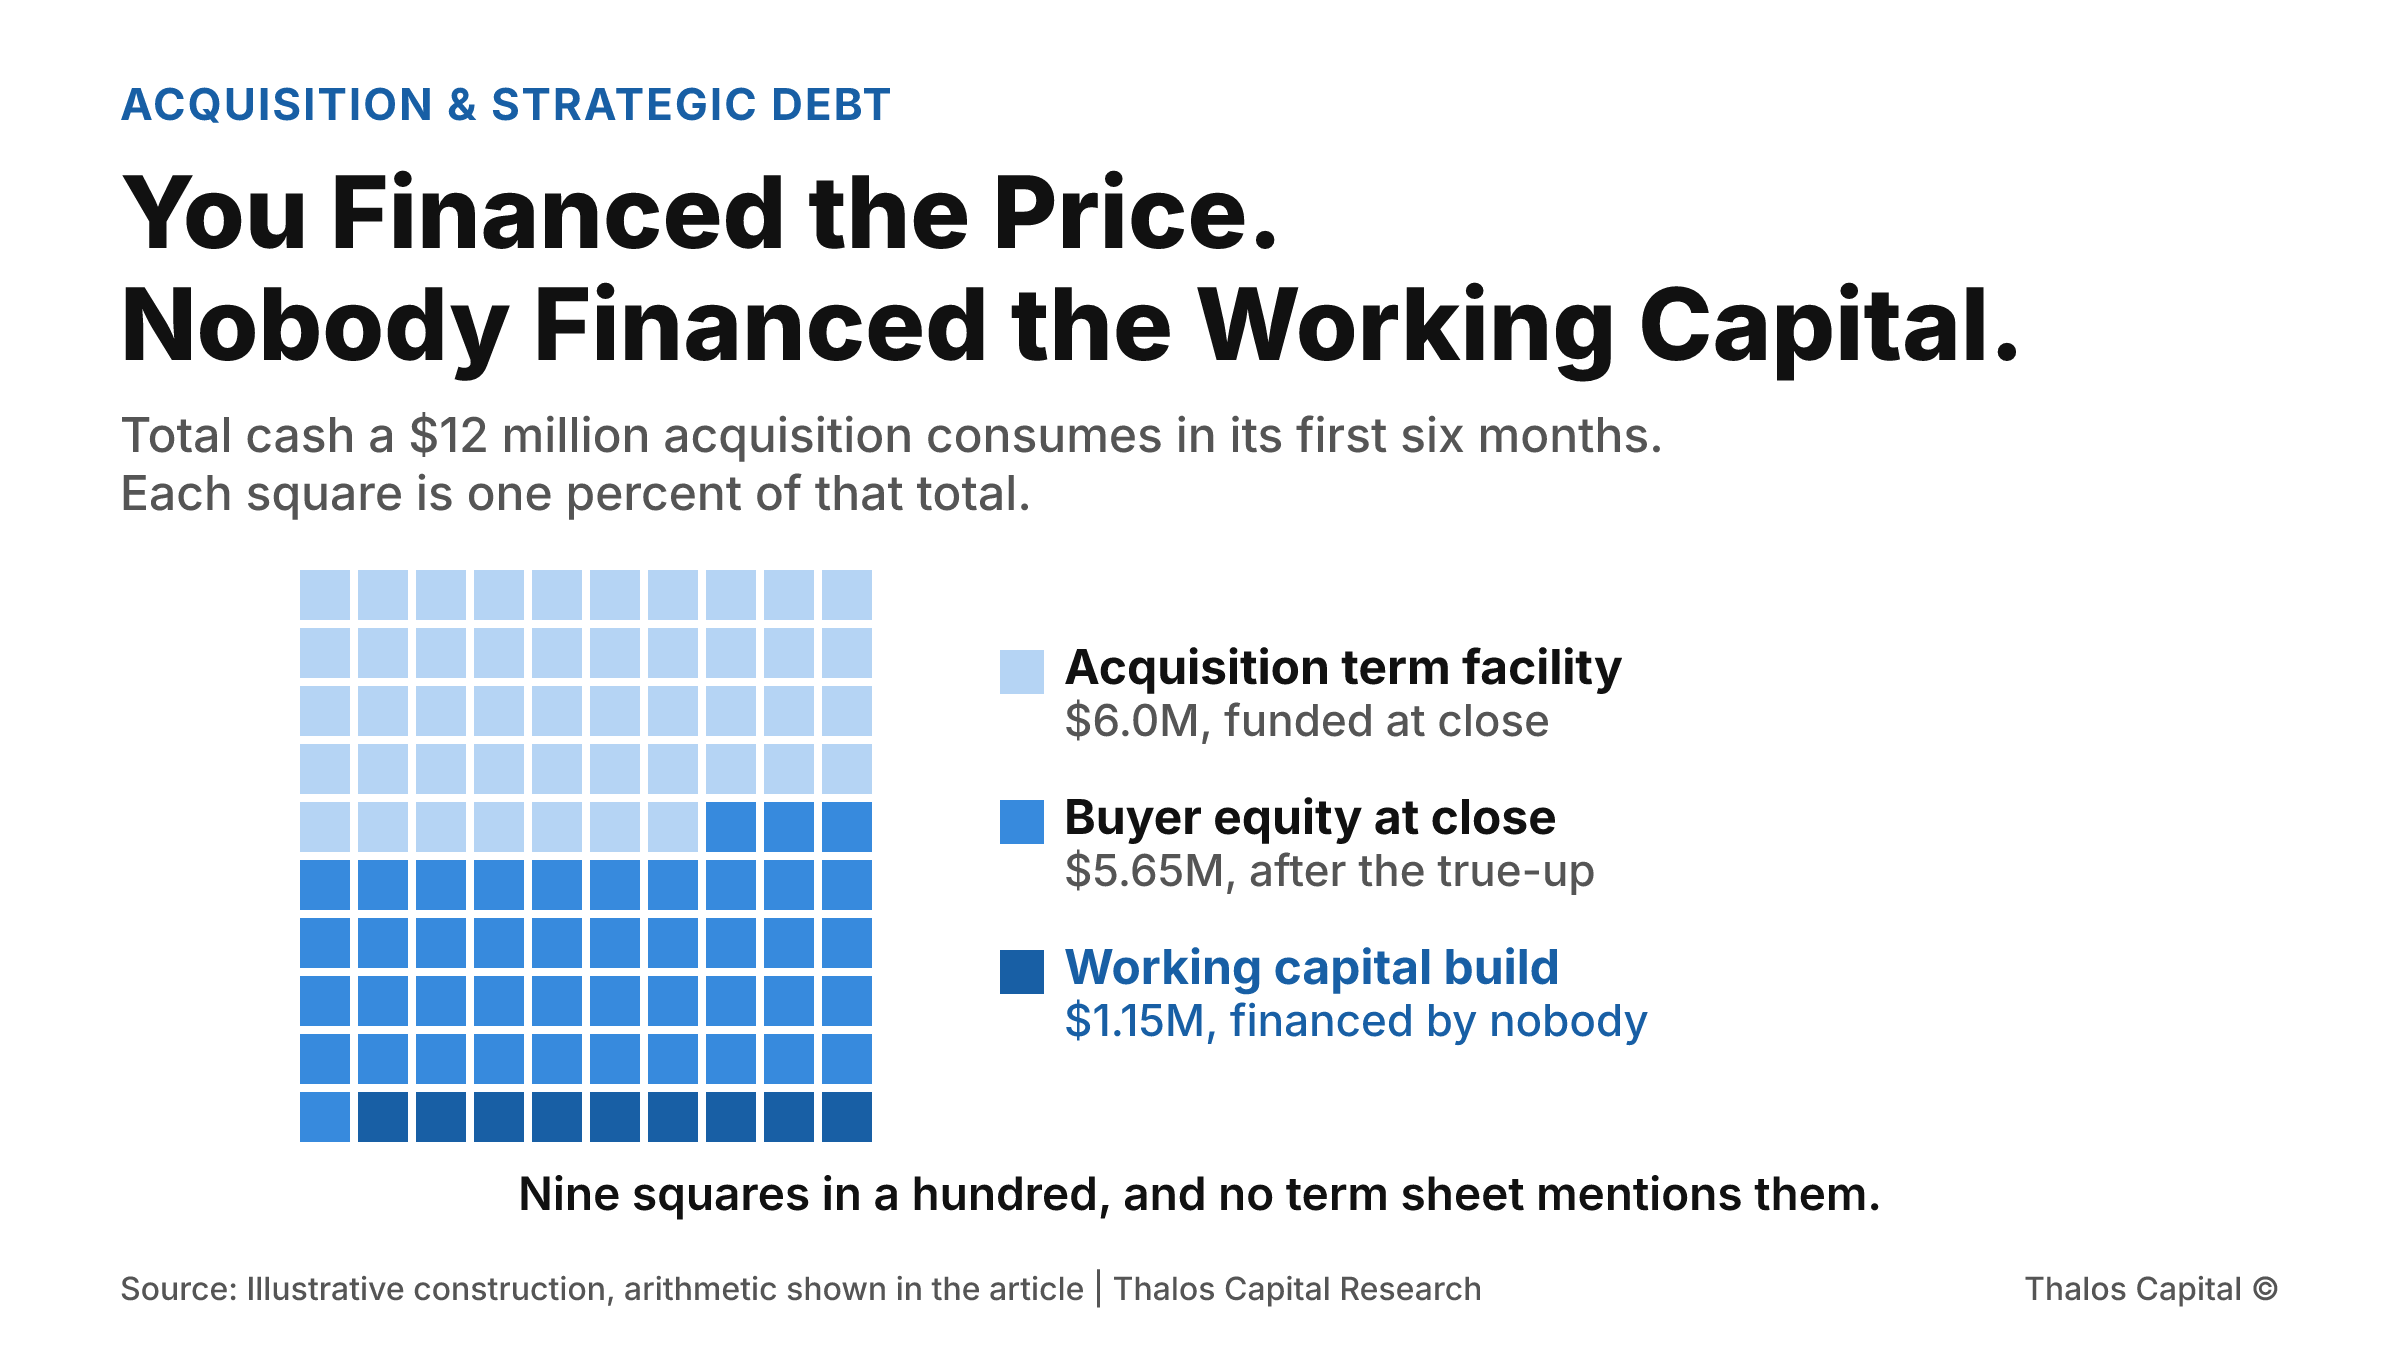
A hundred-square waffle showing the total cash a $12 million acquisition consumes in its first six months: 47 squares funded by the acquisition term facility, 44 by buyer equity at close, and 9 by a working capital build that sits outside the deal model.

You Financed the Price. Nobody Financed the Working Capital.

A buyer models an acquisition as price minus debt equals equity. Then the working capital true-up lands, and the seasonal build after it. The cash required is the same whichever month the deal closes, and the acquisition facility funds none of it.
Read More
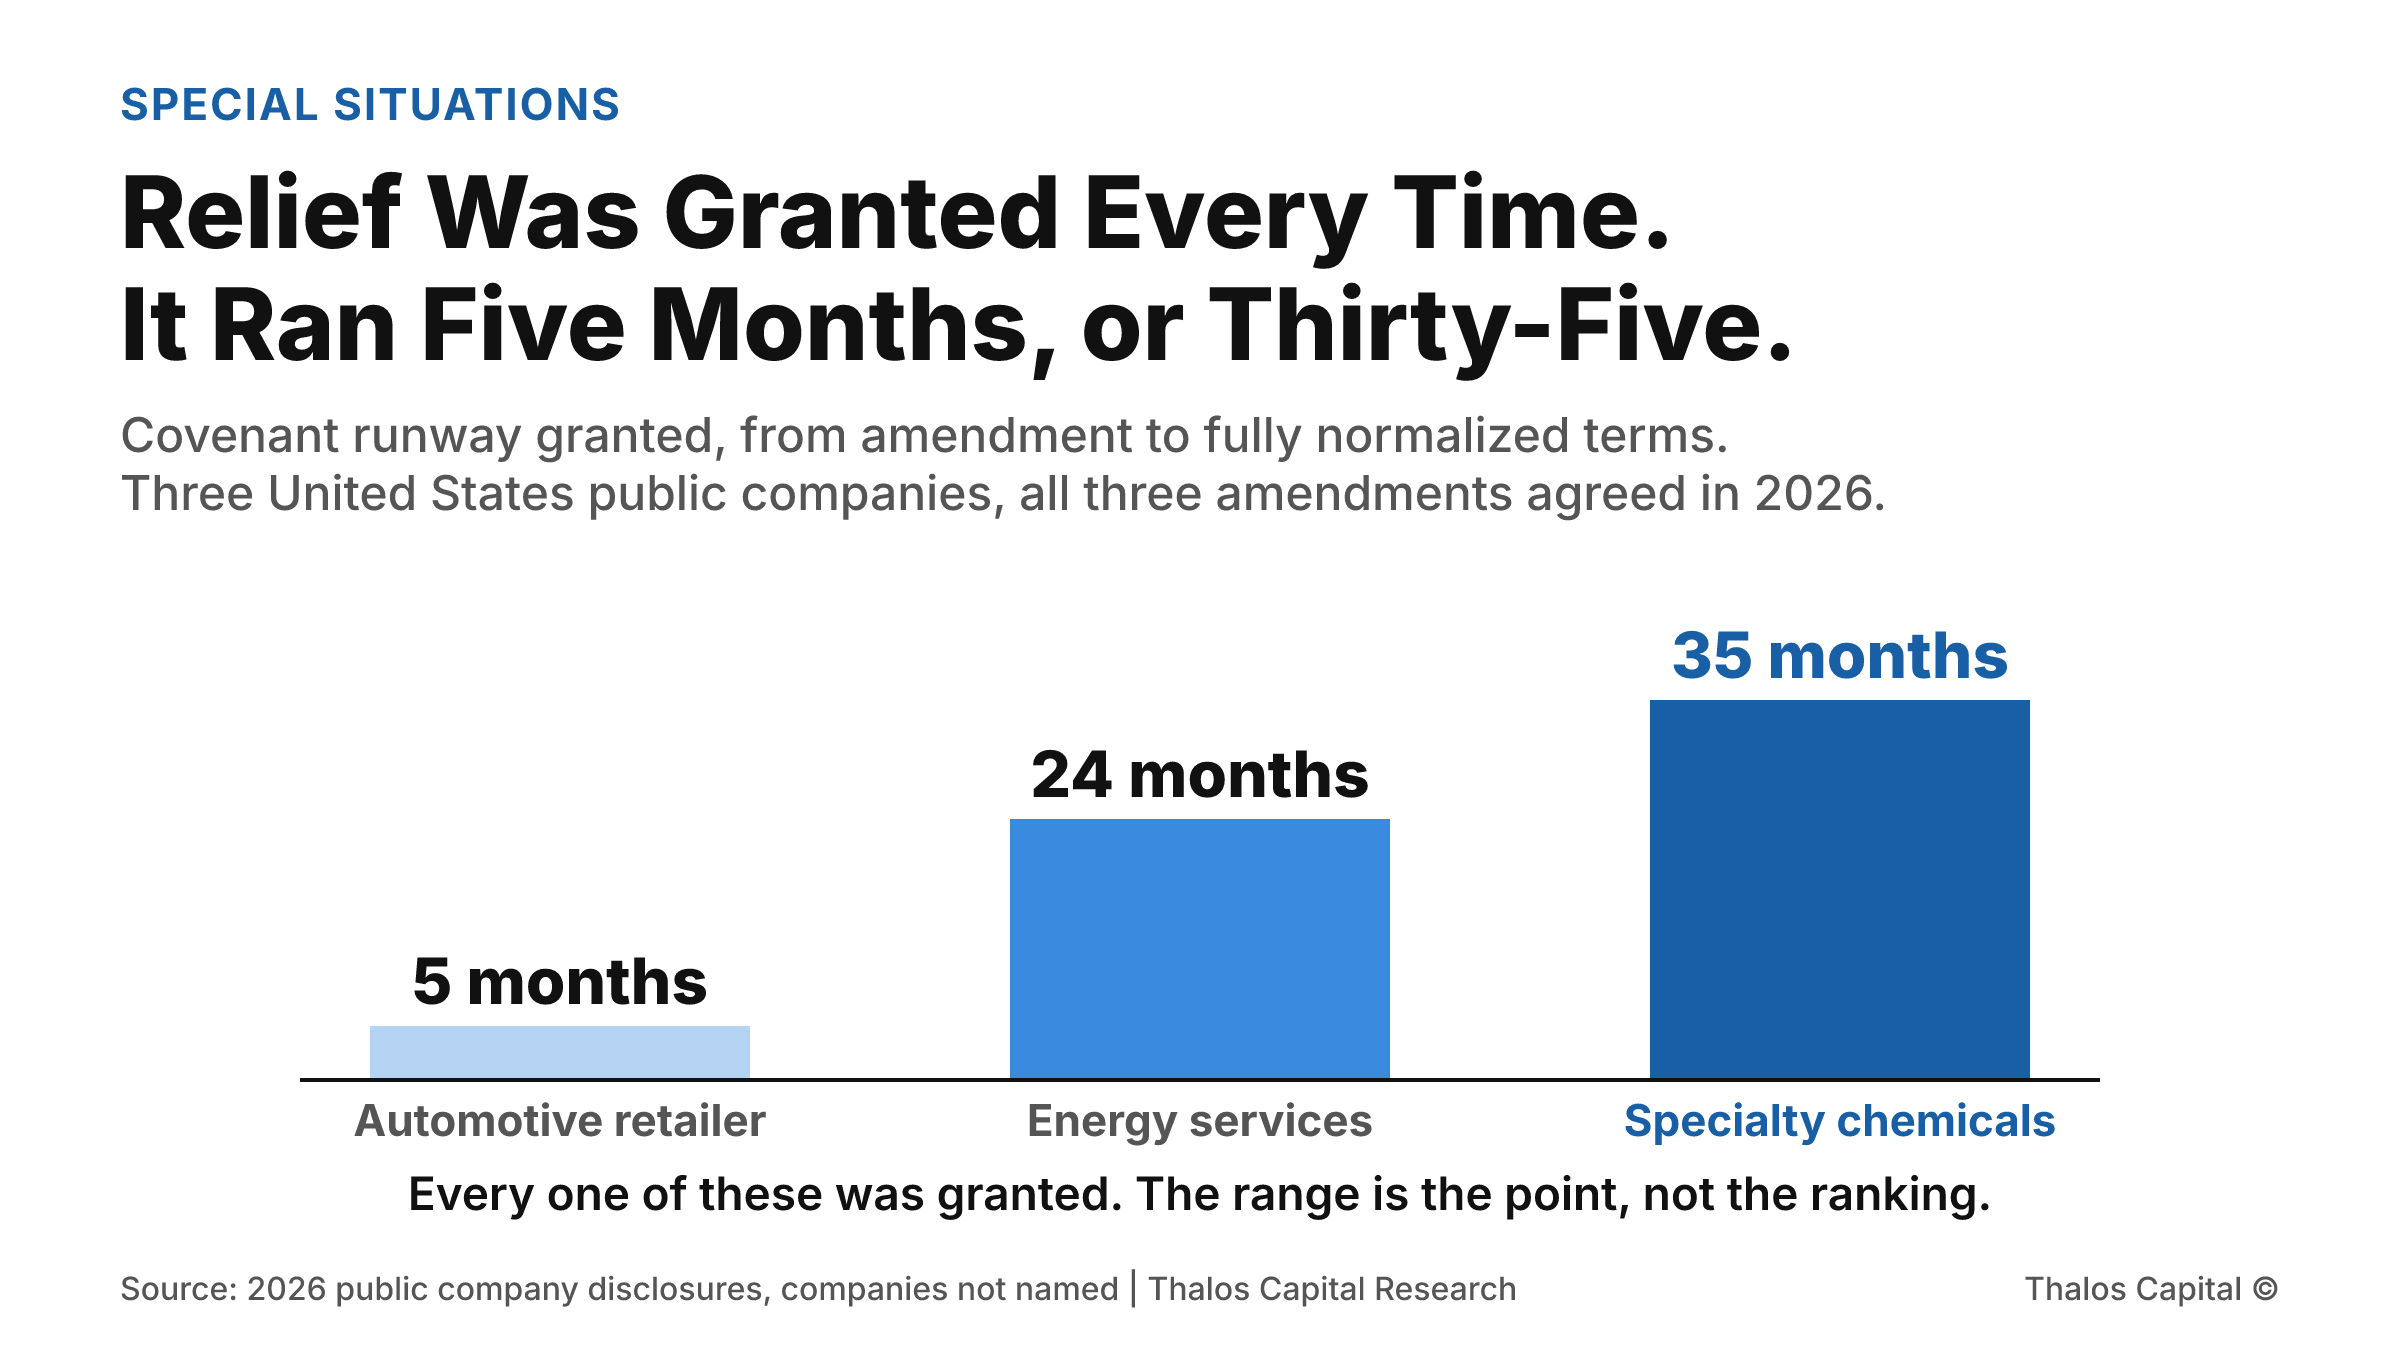
Three columns comparing covenant runway granted in 2026 amendments by three United States public companies: about five months for an automotive retailer, twenty-four months for an energy services company, and thirty-five months for a specialty chemicals company.

Relief Was Granted Every Time. It Ran Five Months, or Thirty-Five.

Three United States public companies disclosed covenant amendments in 2026. Every creditor group said yes. One got a conditional bridge of a few months, another two years, a third nearly three. The breach severity is not what separated them.
Read More
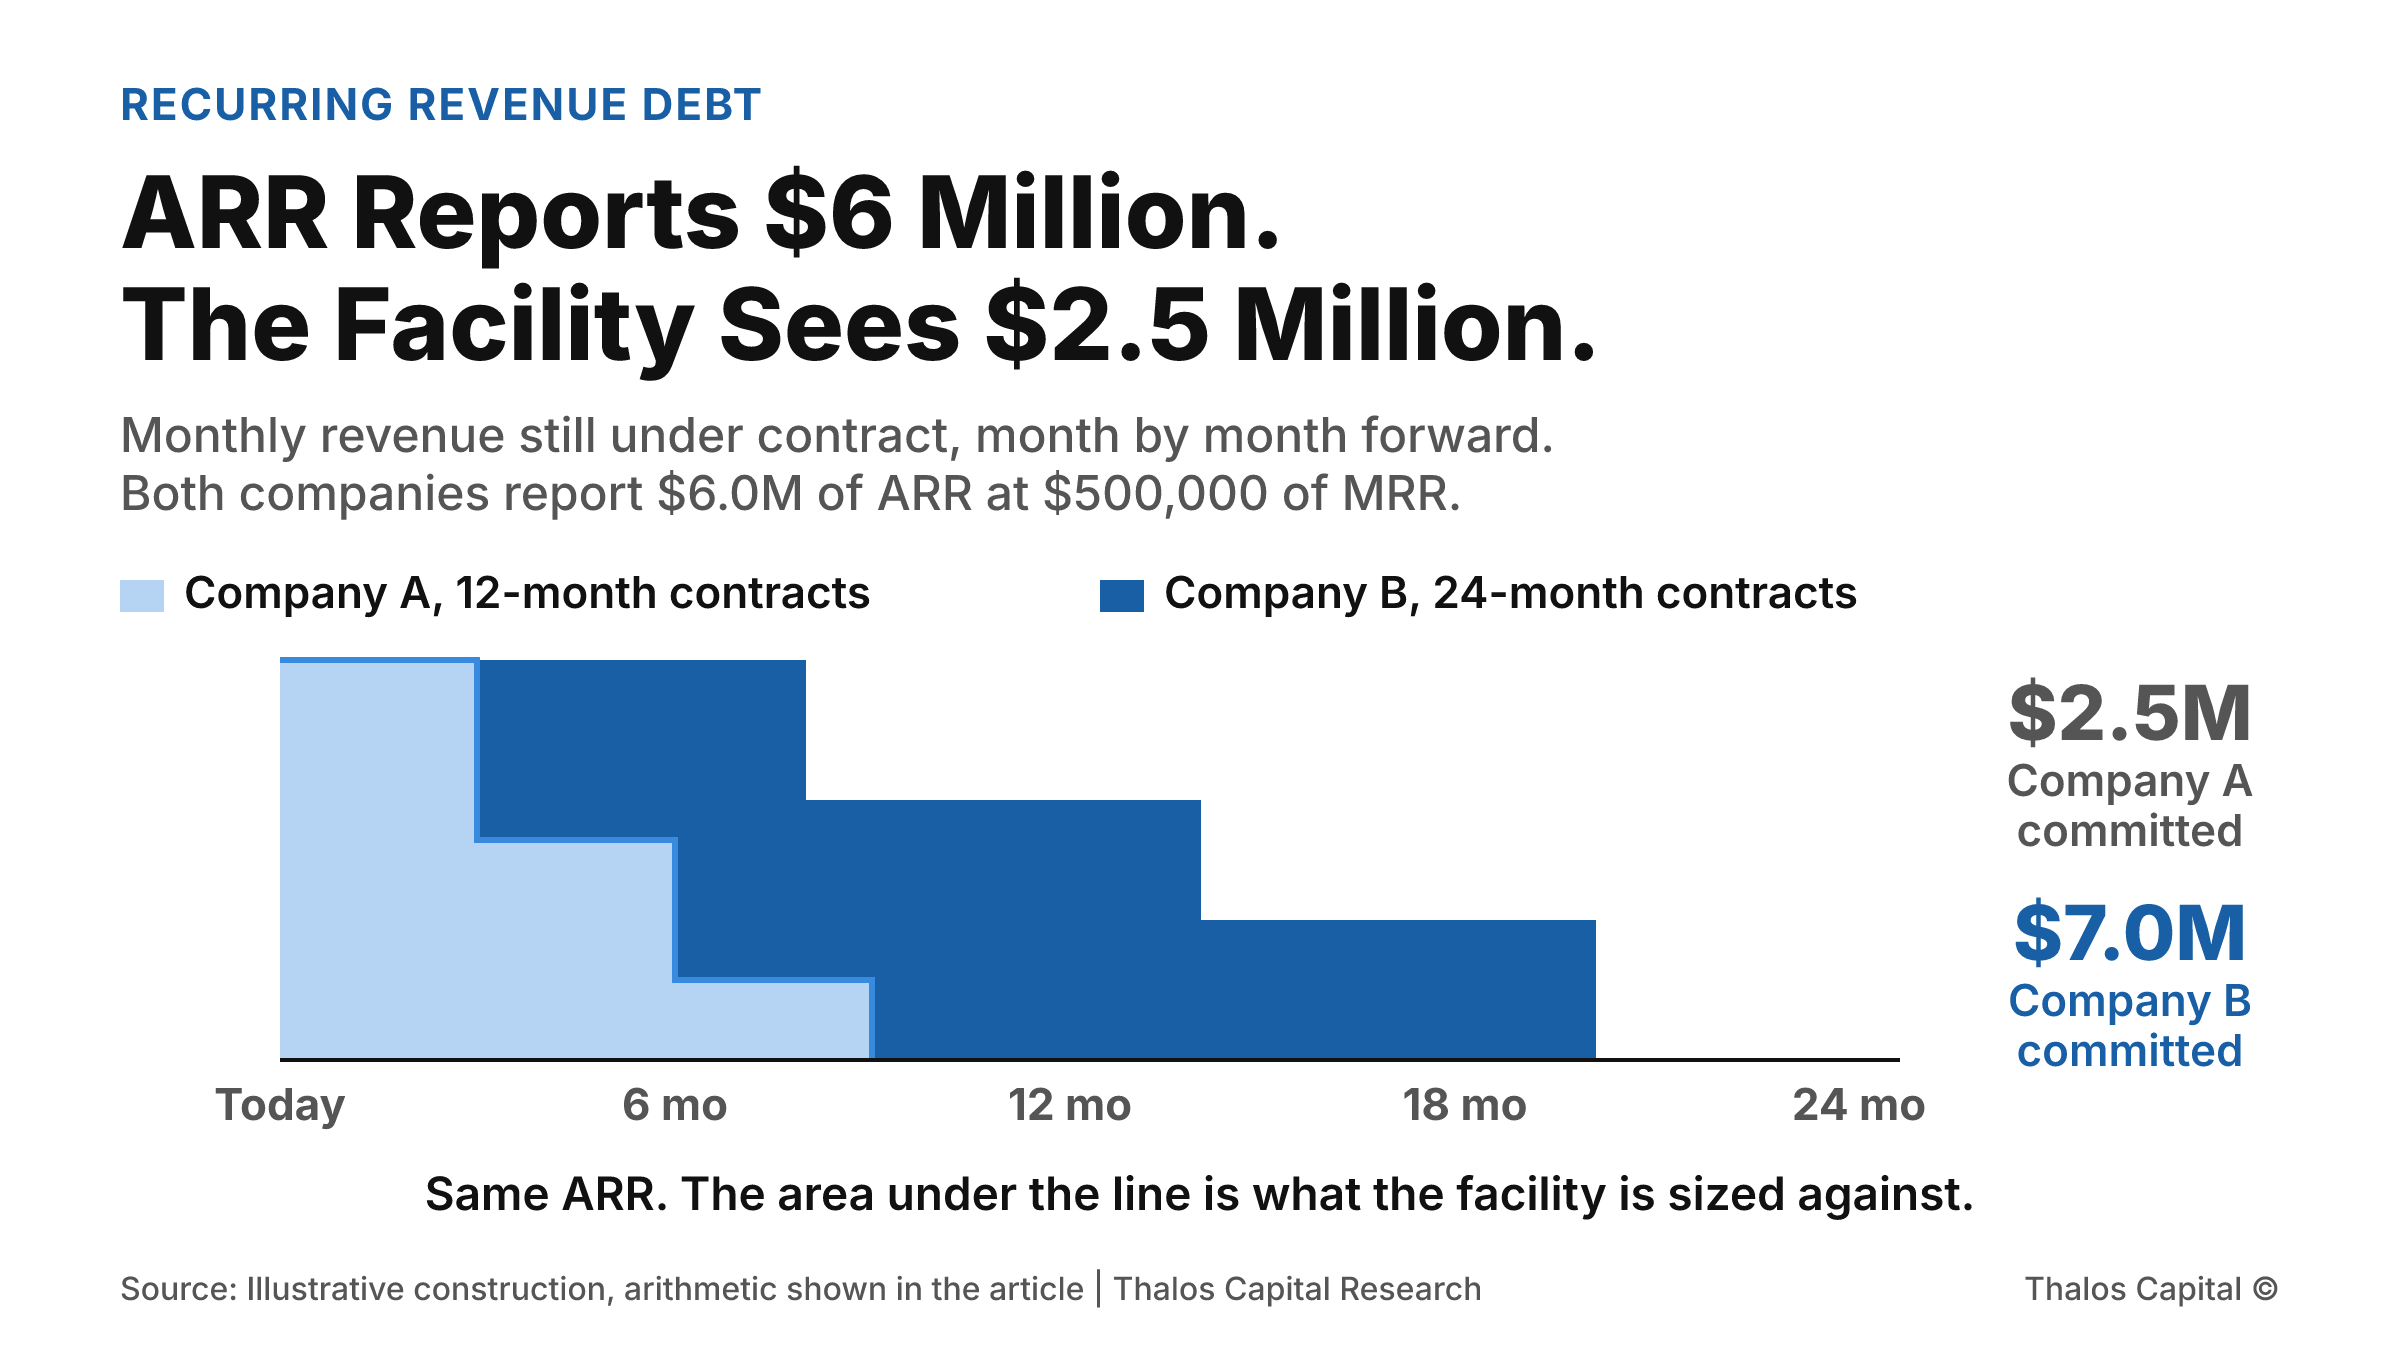
Two stepped areas showing monthly revenue still under contract over the next 24 months for two companies with identical $6.0 million ARR: a 12-month contract book holding $2.5 million of remaining contracted value and a 24-month contract book holding $7.0 million.

ARR Reports $6 Million. The Facility Sees $2.5 Million.

Two recurring-revenue companies each report $6.0 million of ARR. One is offered a $2.0 million facility and the other $1.0 million. The difference is contract length, and it does not appear in any metric either company reports.
Read More
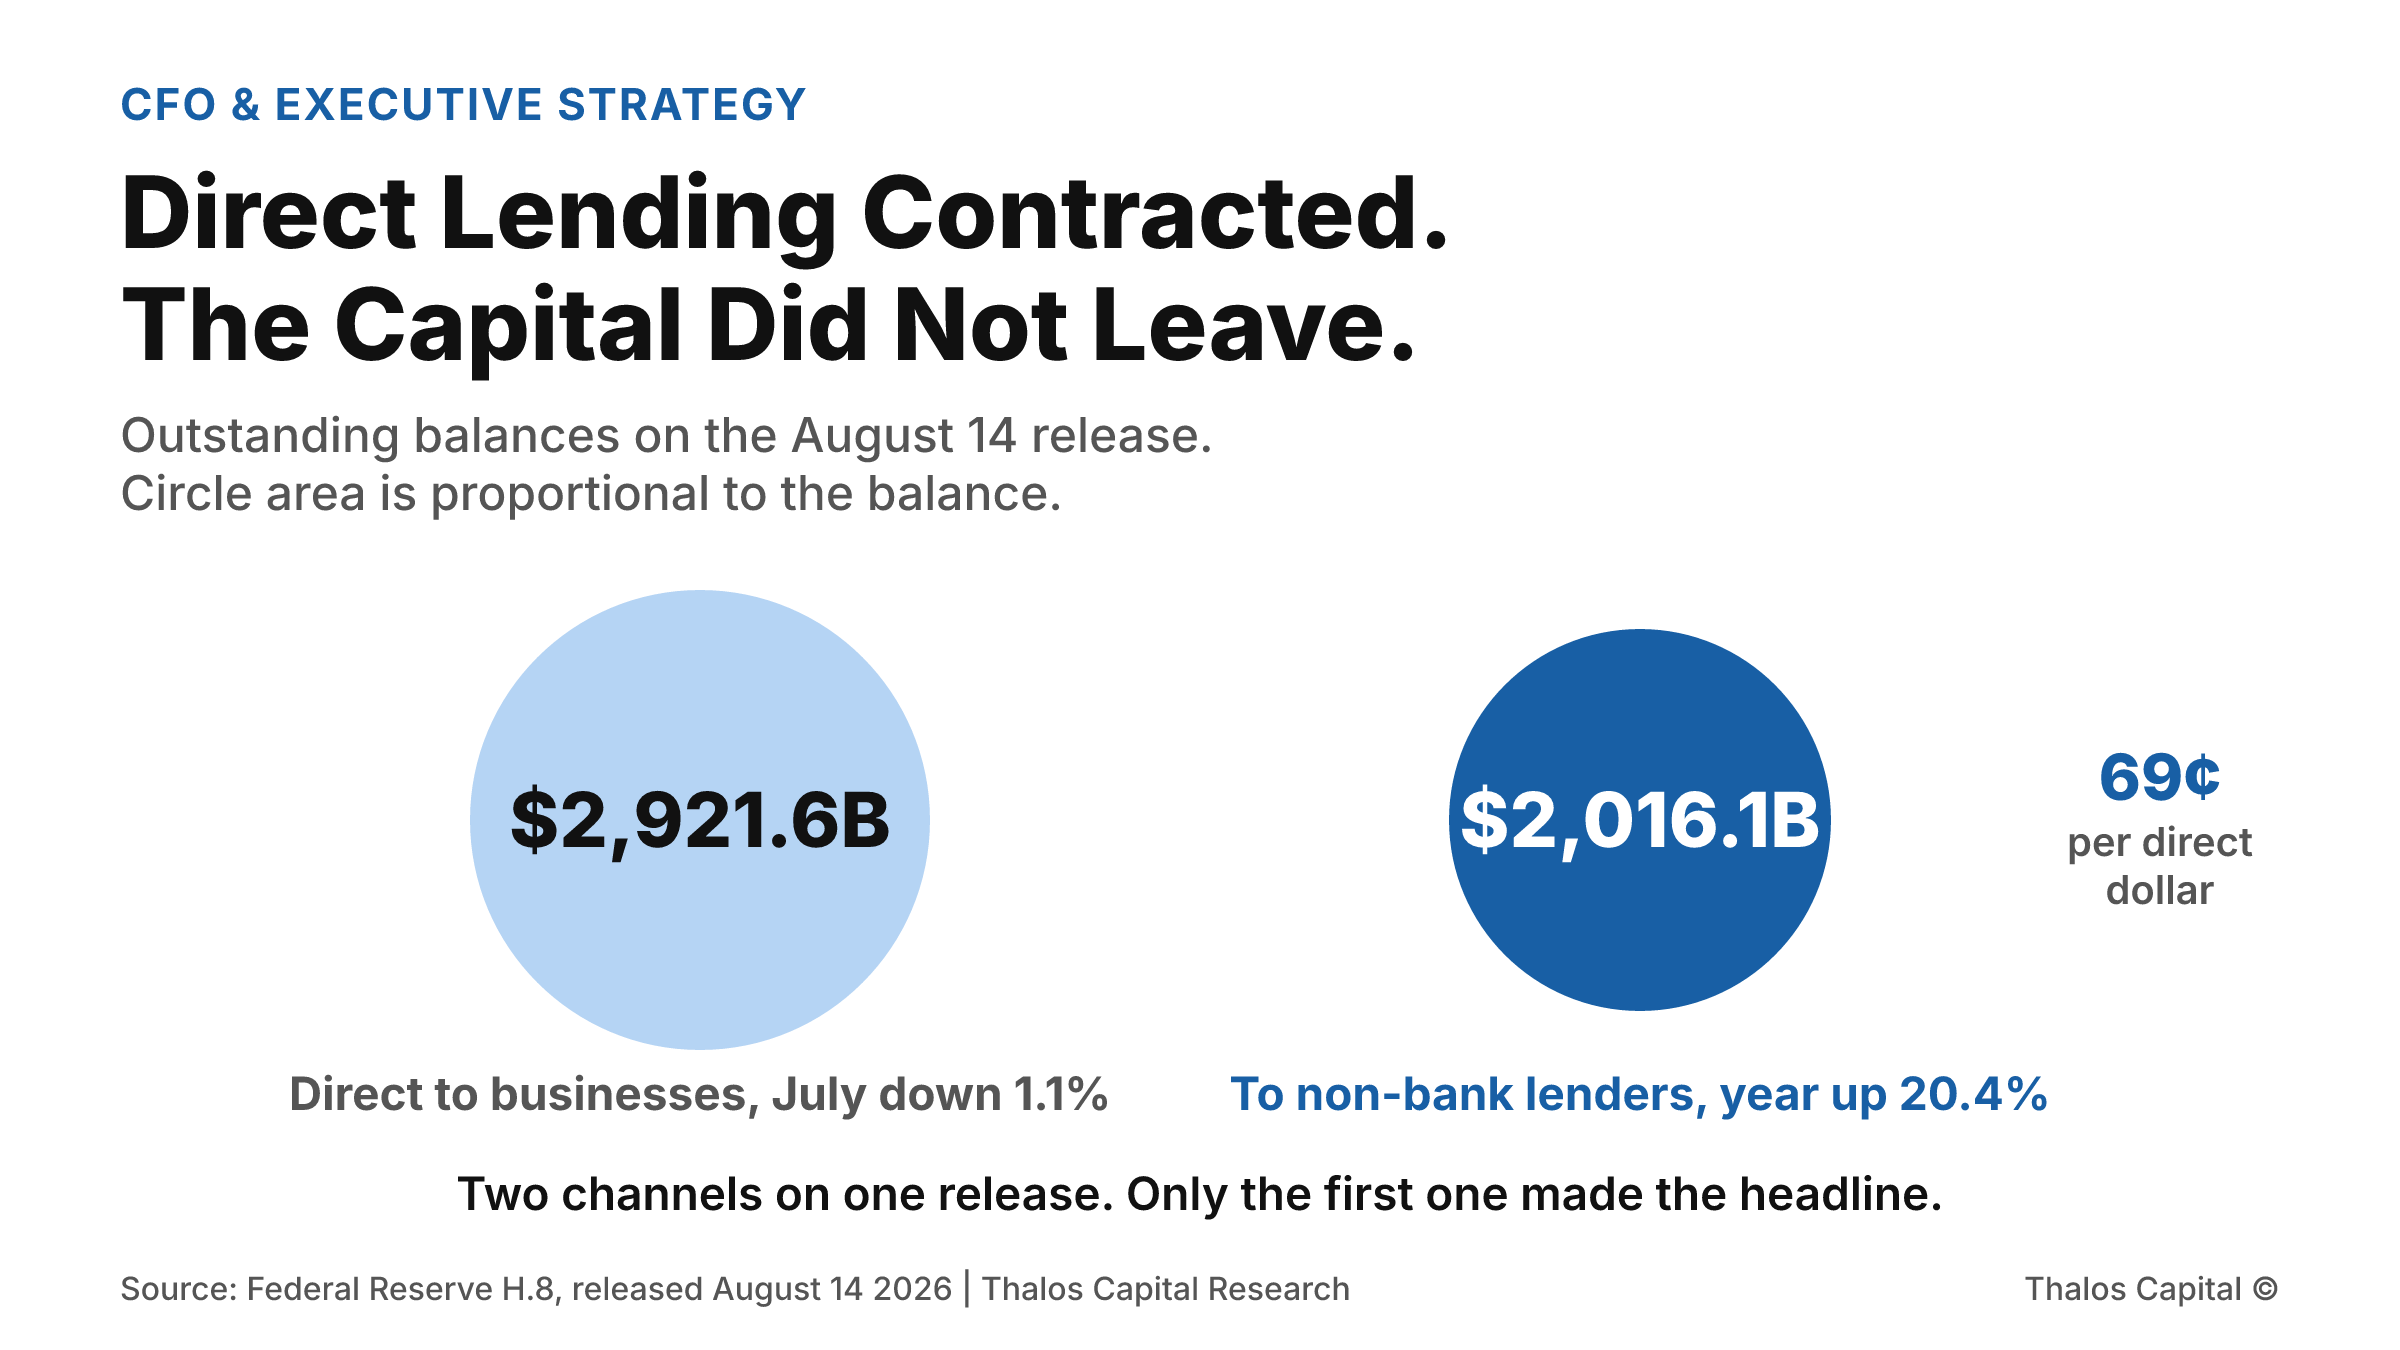
Two proportional circles comparing commercial and industrial loan balances of $2,921.6 billion, which contracted 1.1 percent annualized in July, against lending to non-depository financial institutions of $2,016.1 billion, up 20.4 percent on the year.

Direct Lending Contracted. The Capital Did Not Leave.

July brought the first contraction in commercial and industrial balances all year, at minus 1.1 percent annualized. Over the same stretch, lending to non-bank financial institutions reached $2,016.1 billion, up 20.4 percent.
Read More
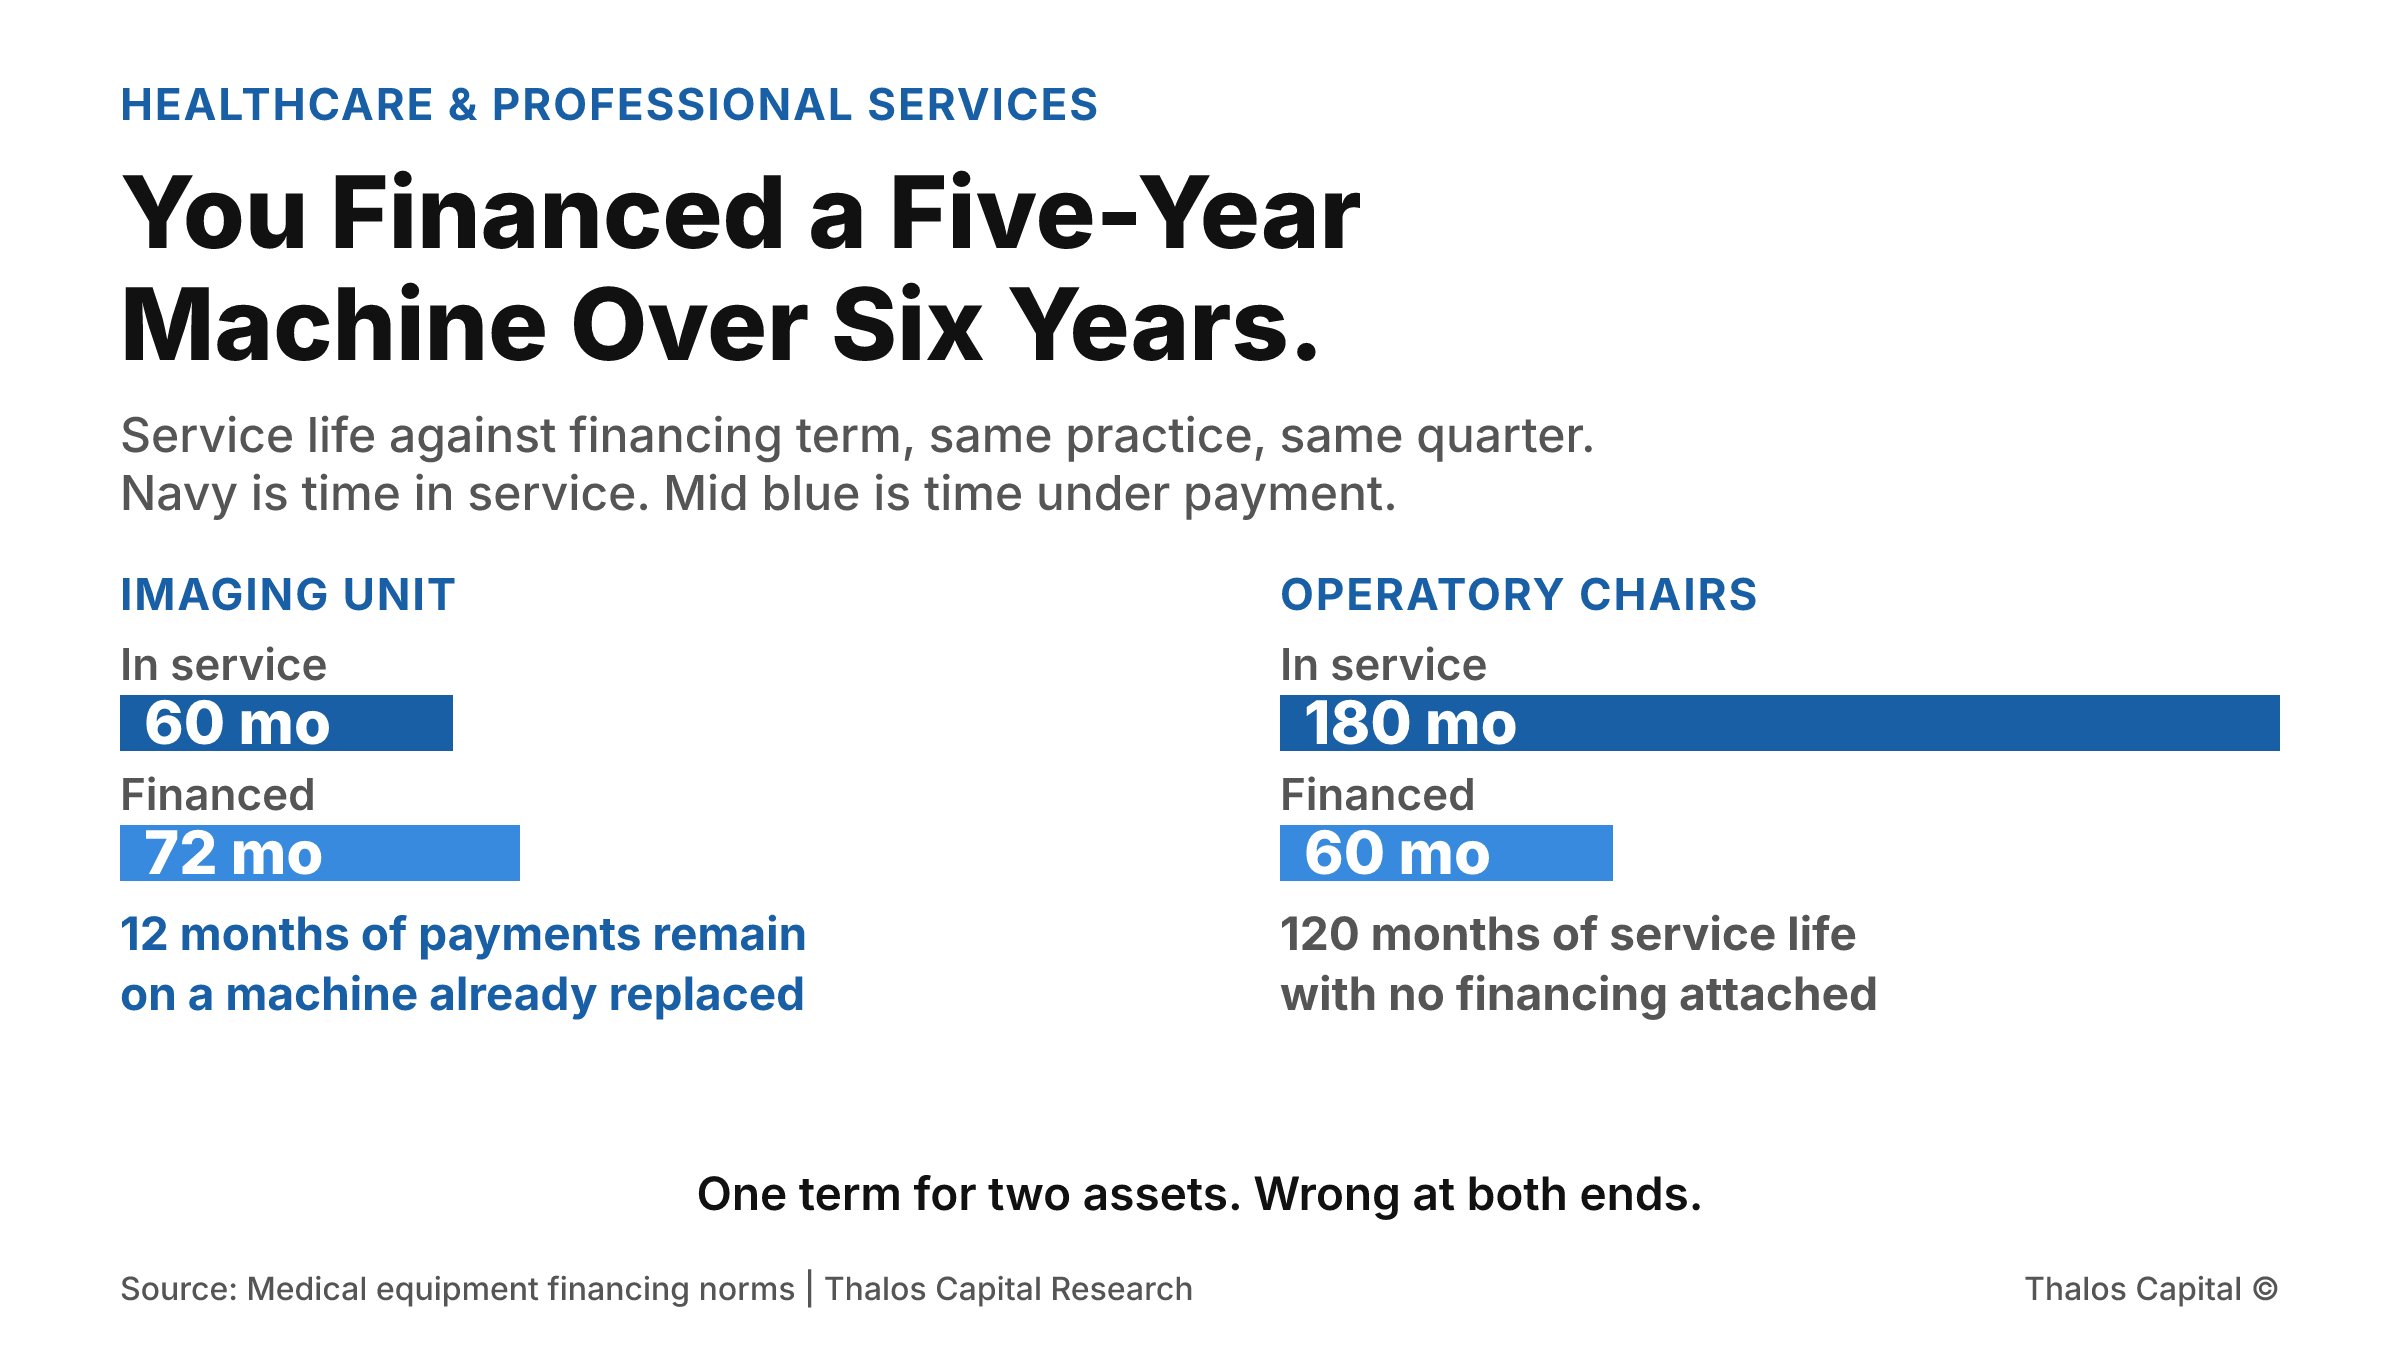
Two panels comparing asset service life against financing term. An imaging unit serves about 60 months but is financed over 72, leaving 12 months of payments on a retired machine. Operatory chairs serve about 180 months but are financed over 60, leaving 120 months of unfinanced life.

You Financed a Five-Year Machine Over Six Years.

A practice buys imaging and operatory chairs in the same quarter. One faces obsolescence in five years, the other runs fifteen. Financing both on a single term loses money at both ends.
Read More
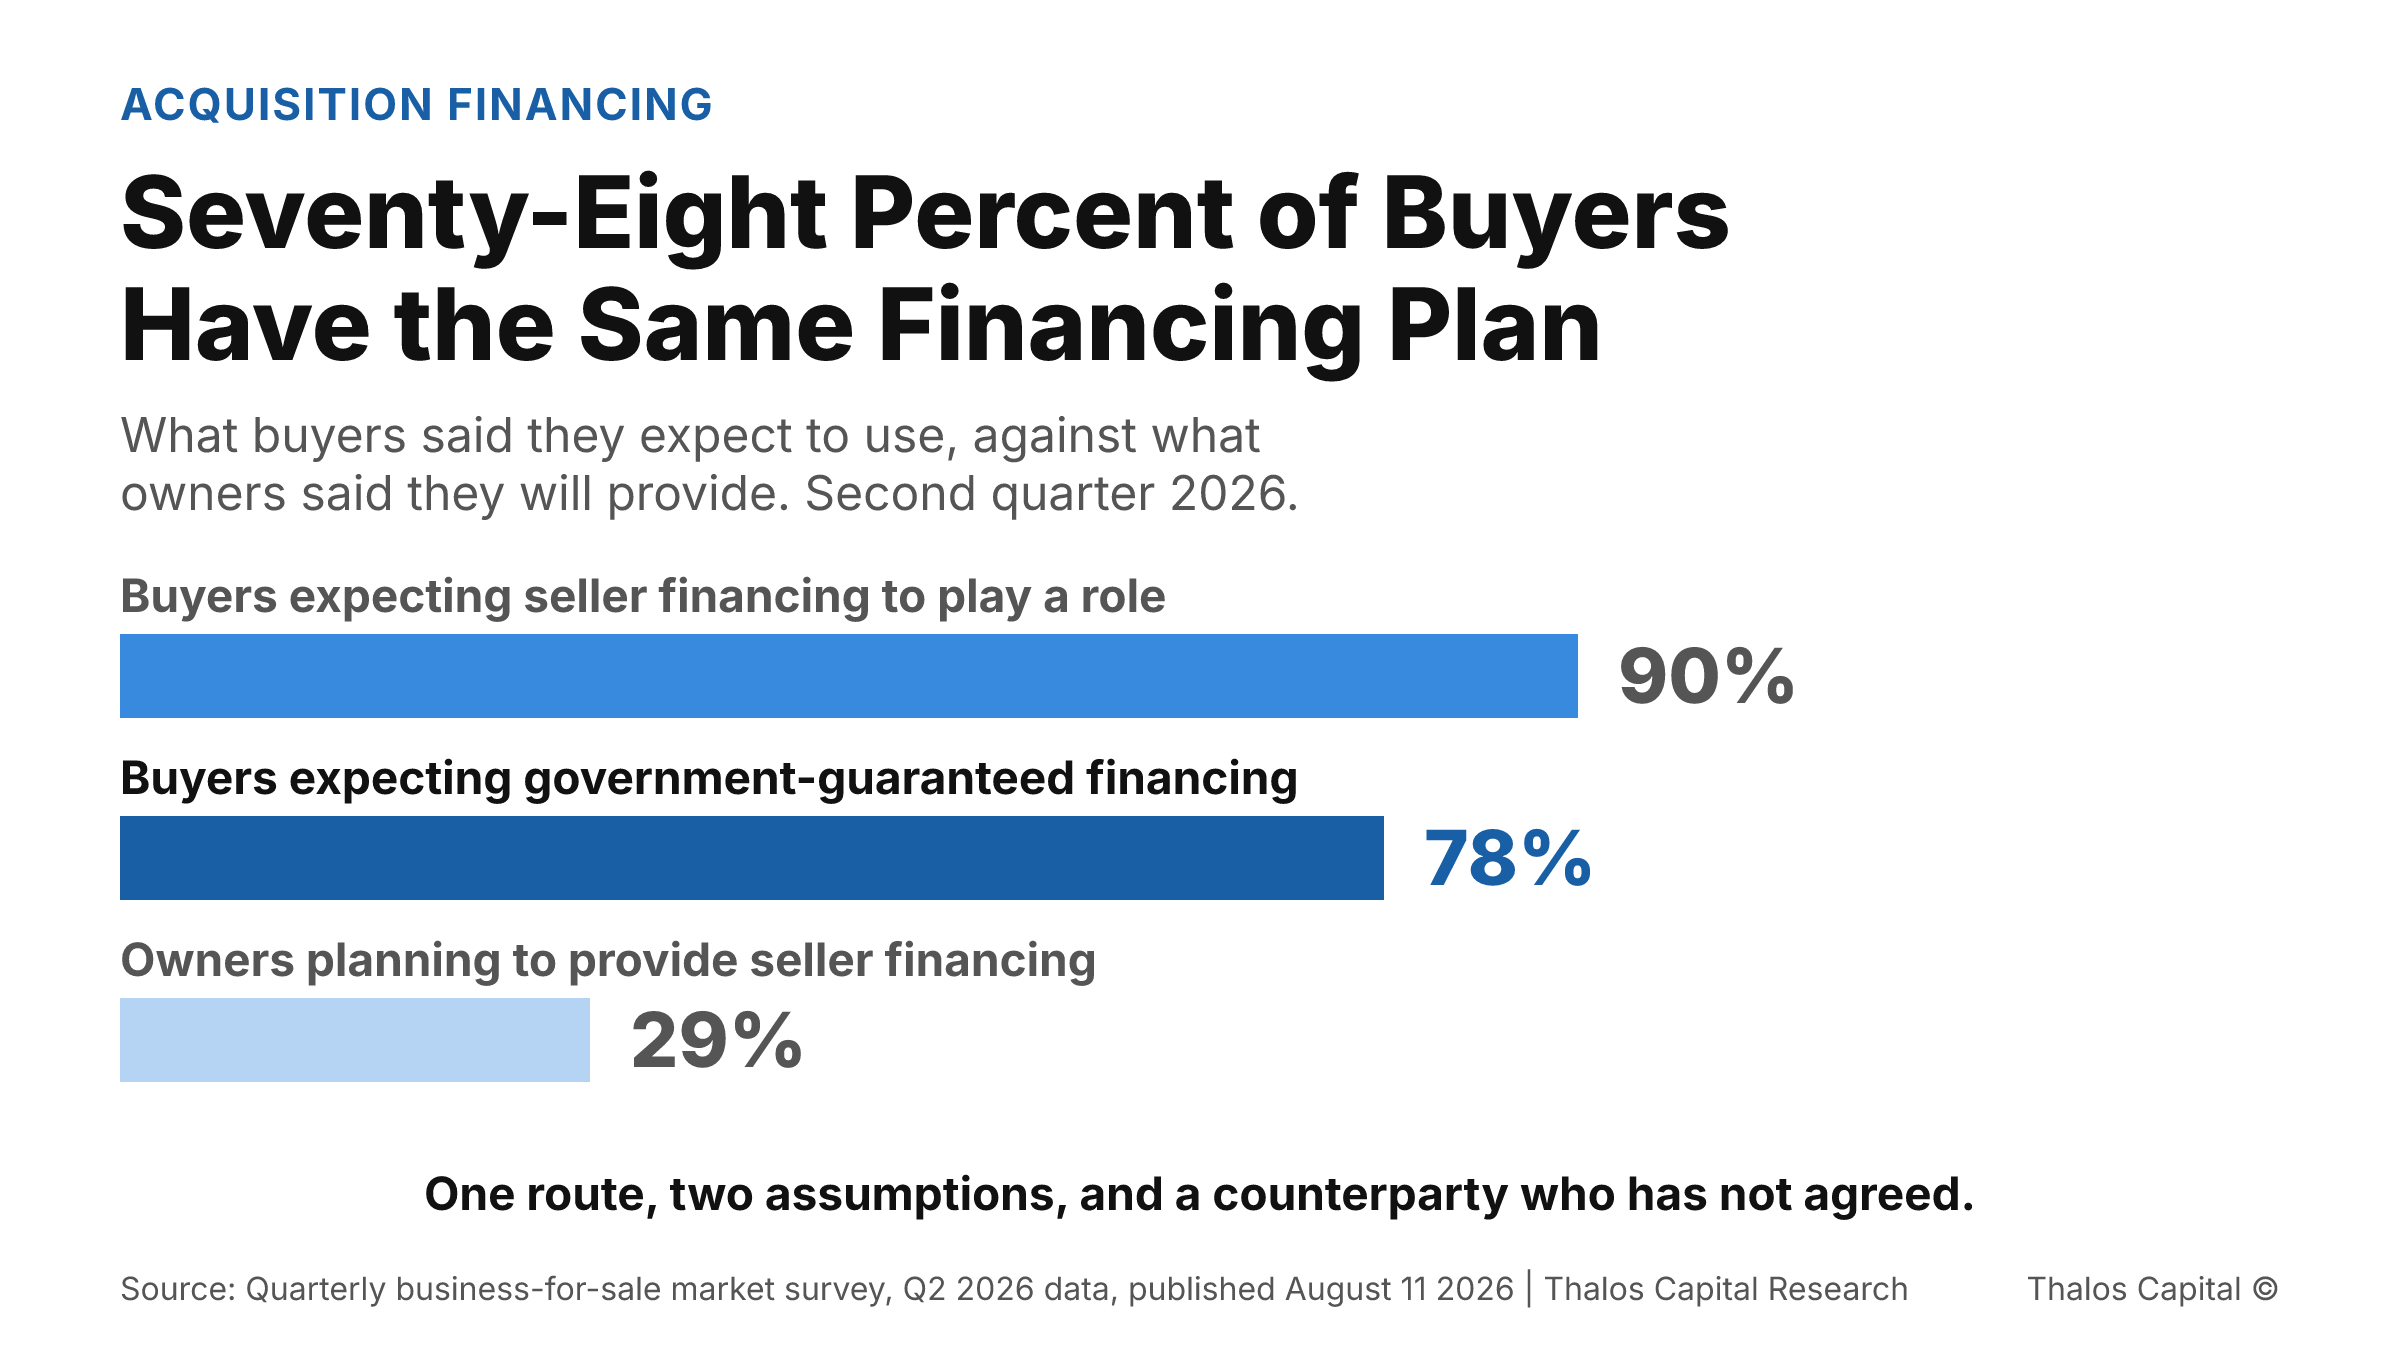
Horizontal bar chart of three survey figures from the second quarter of 2026. Ninety percent of buyers expect seller financing to play a role, seventy-eight percent expect financing backed by the U.S. Small Business Administration, shown in the darkest navy as the value argued, and twenty-nine percent of owners plan to provide seller financing.

Seventy-Eight Percent of Buyers Have the Same Financing Plan

Nearly eight in ten buyers expect to fund an acquisition through one government-guaranteed program, and ninety percent expect a seller note that only twenty-nine percent of owners plan to write.
Read More
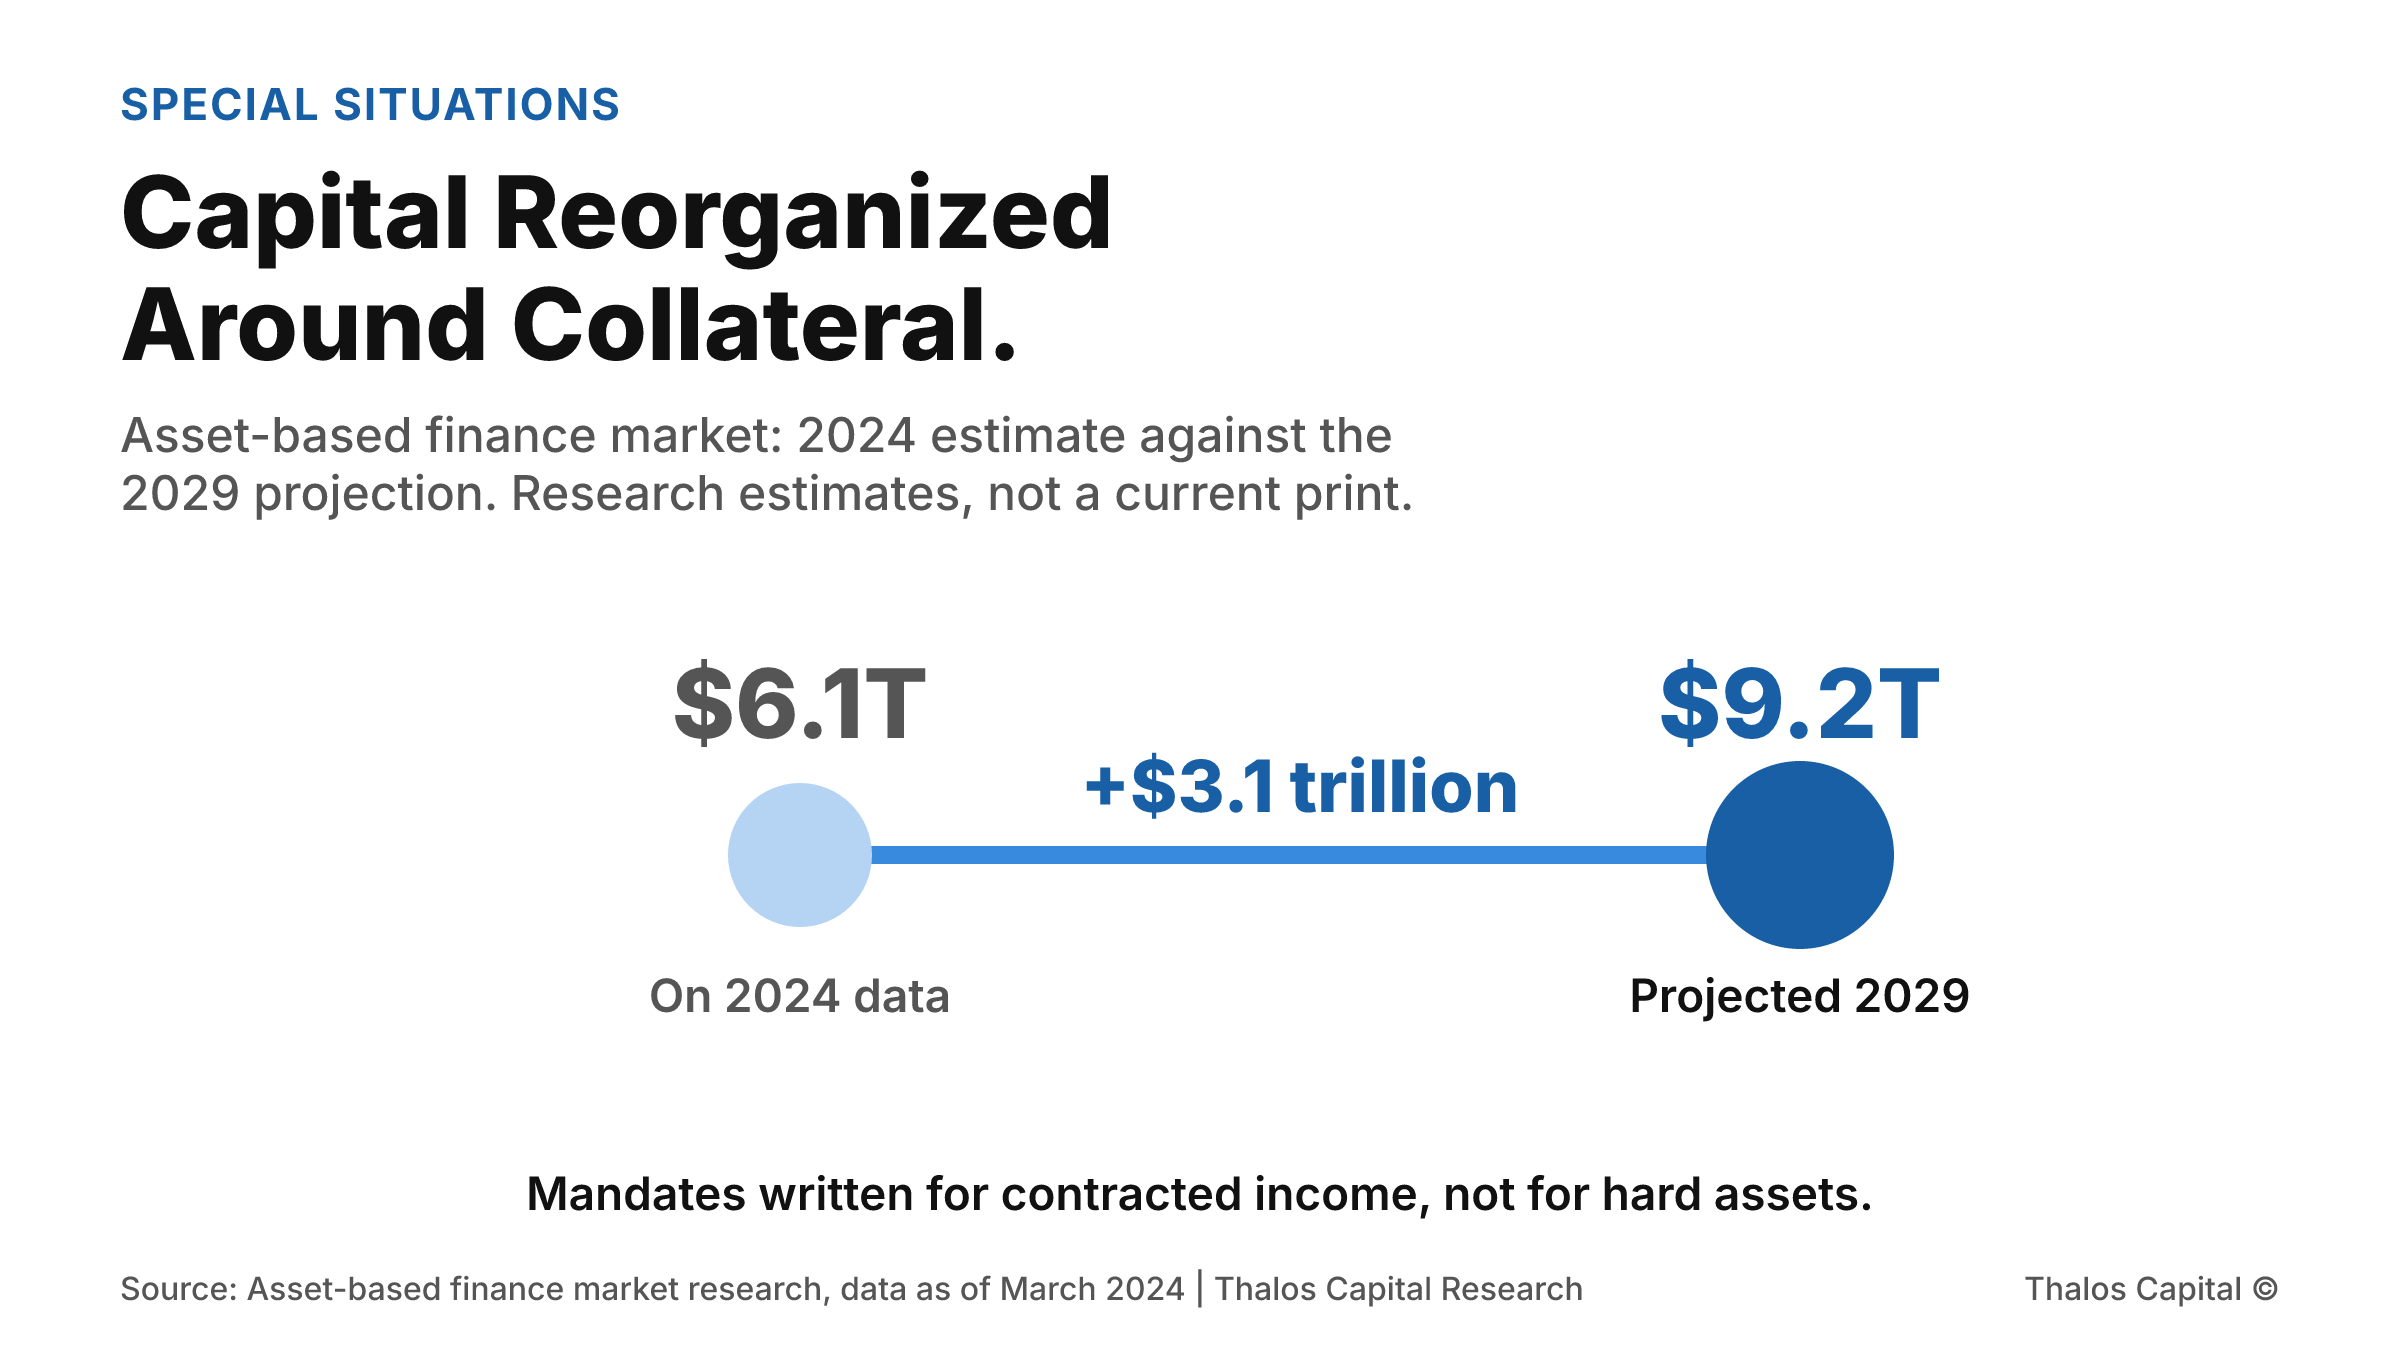
Two point range chart showing the asset-based finance market estimated at more than $6.1 trillion on 2024 data and projected to reach $9.2 trillion by 2029, an increase of roughly $3.1 trillion.

Capital Reorganized Around Collateral. Your Contracts Are Collateral.

Asset-based finance was estimated at more than $6.1 trillion on 2024 data and projected to reach $9.2 trillion by 2029. Inside it are mandates written for contracted and intangible cash flows rather than for hard assets.
Read More
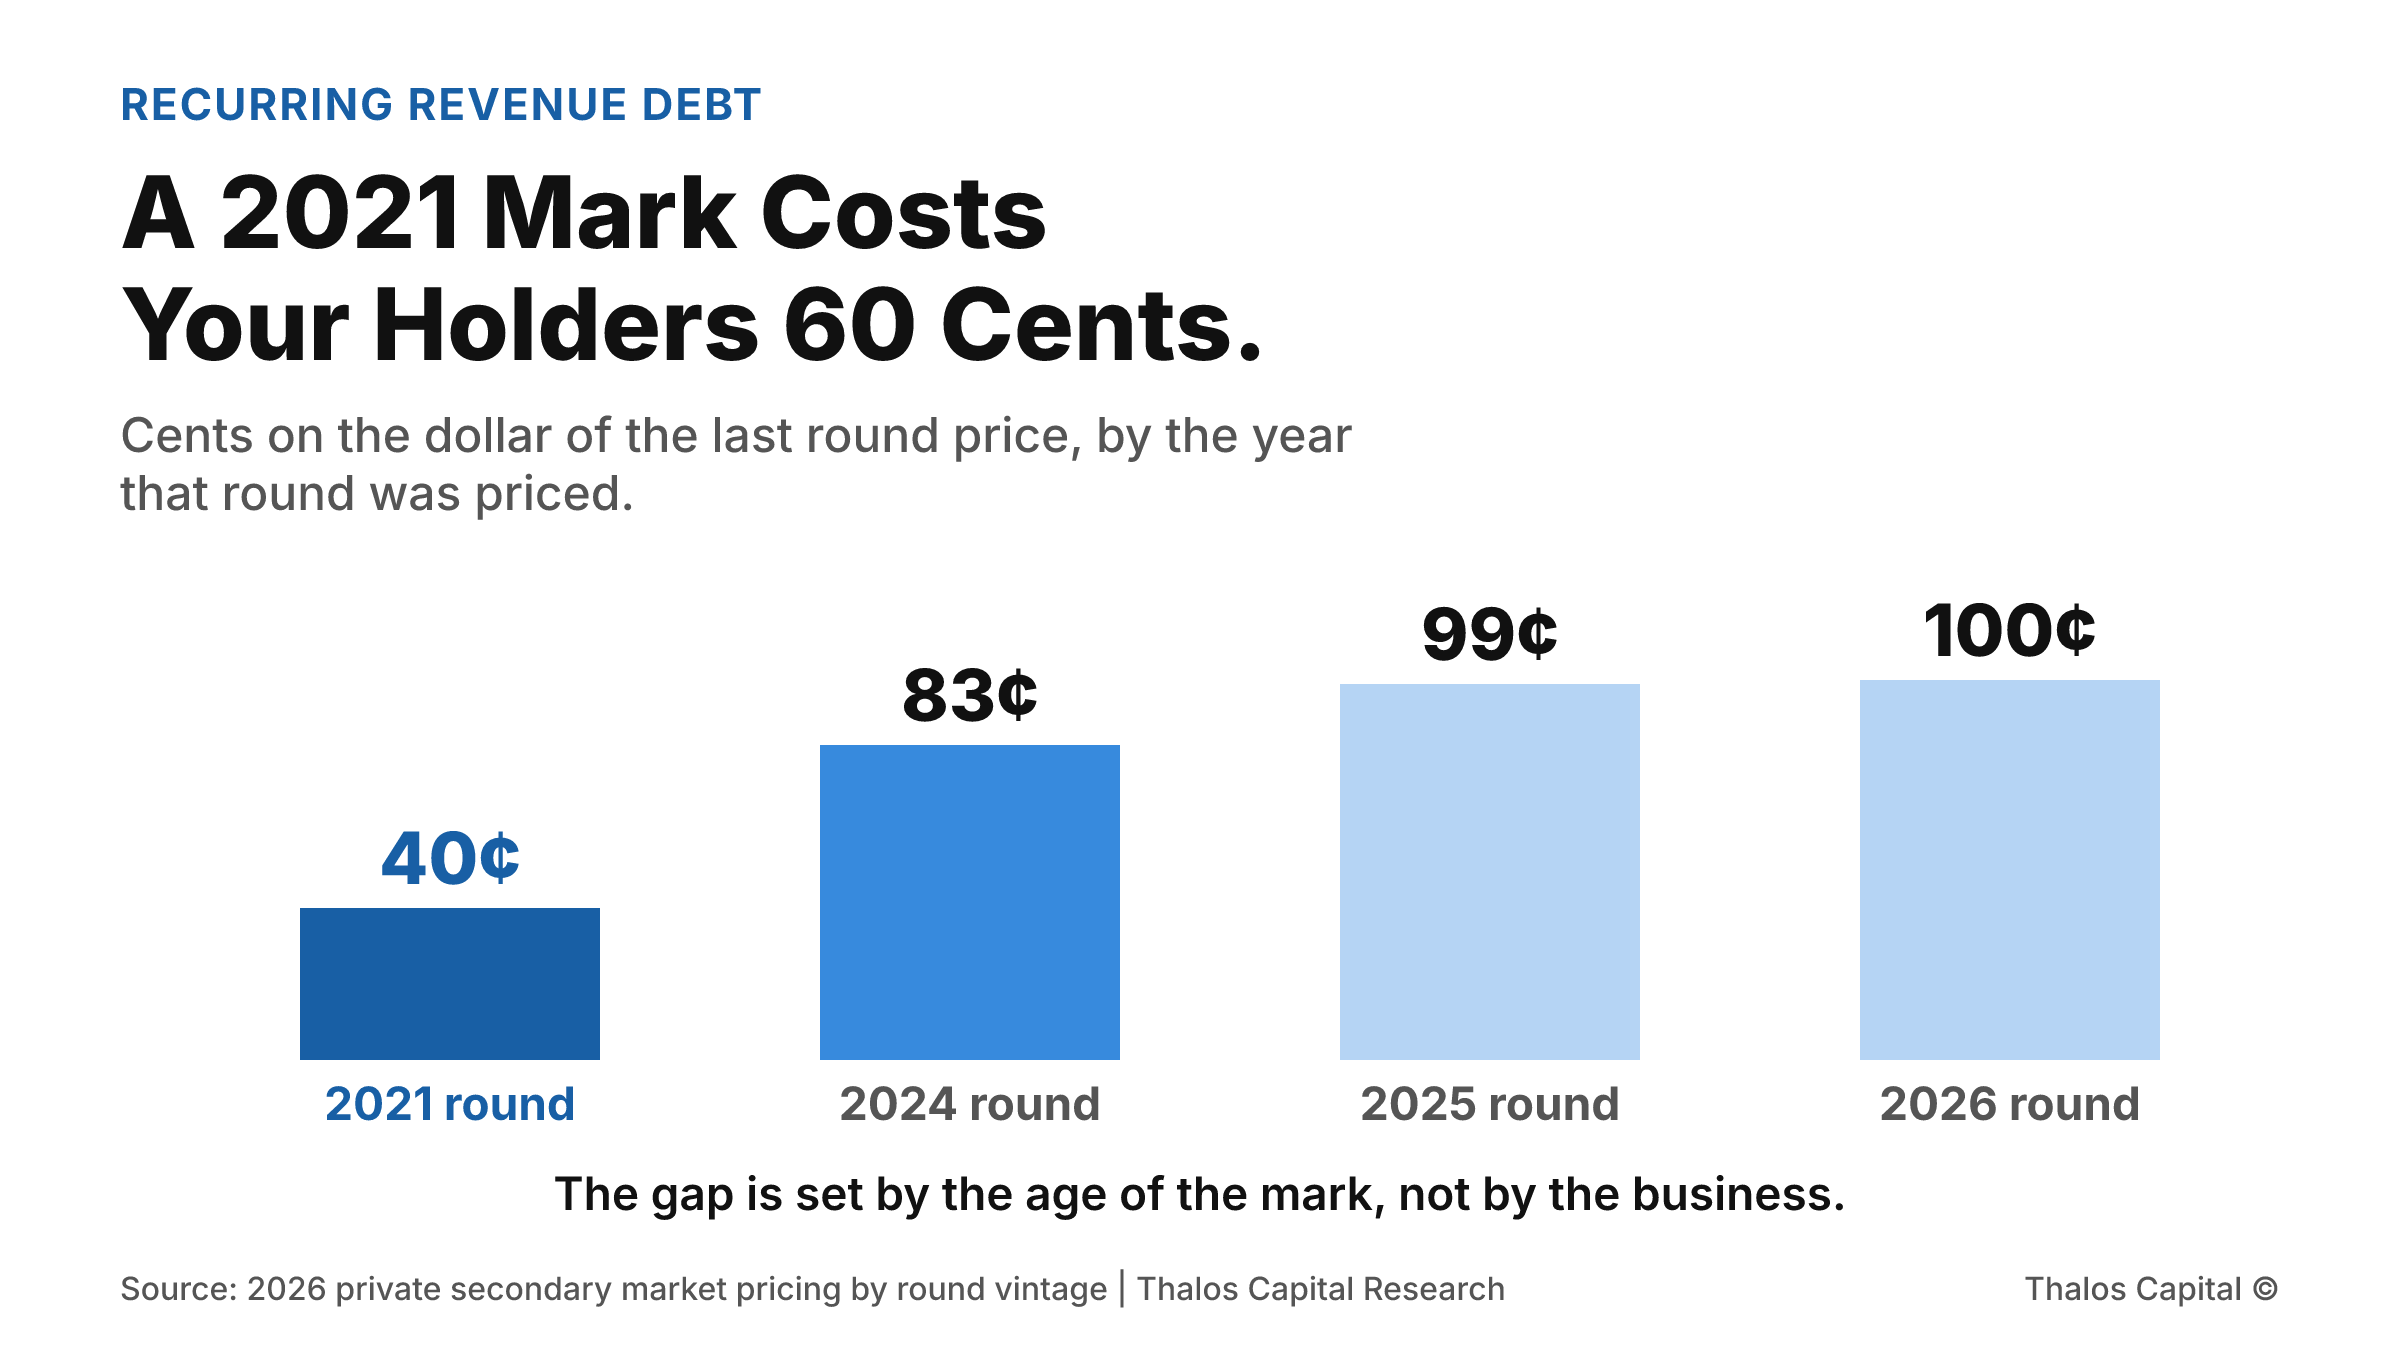
Column chart of what private shares fetch as cents on the dollar of the last round price, by the year that round was priced: about 40 cents for a 2021 mark shown in the darkest navy, 83 cents for 2024, 99 cents for 2025 and 100 cents for 2026.

A 2021 Mark Costs Your Holders 60 Cents.

Private shares trade below the last round price, and how far below depends on when that round was priced. A 2021 mark trades around 60 percent under. A 2025 mark trades around 1 percent under. What that costs an early holder.
Read More
Working through a financing decision?
Insights are a starting point. A conversation maps your actual options.
Tell us what you are financing and we will map the structures and sources that fit.
Submit your financing request →
Explore our financing solutions
Equipment FinancingWorking CapitalAsset-Based LendingStrategic Debt