Tag

strategic debt

5 insights

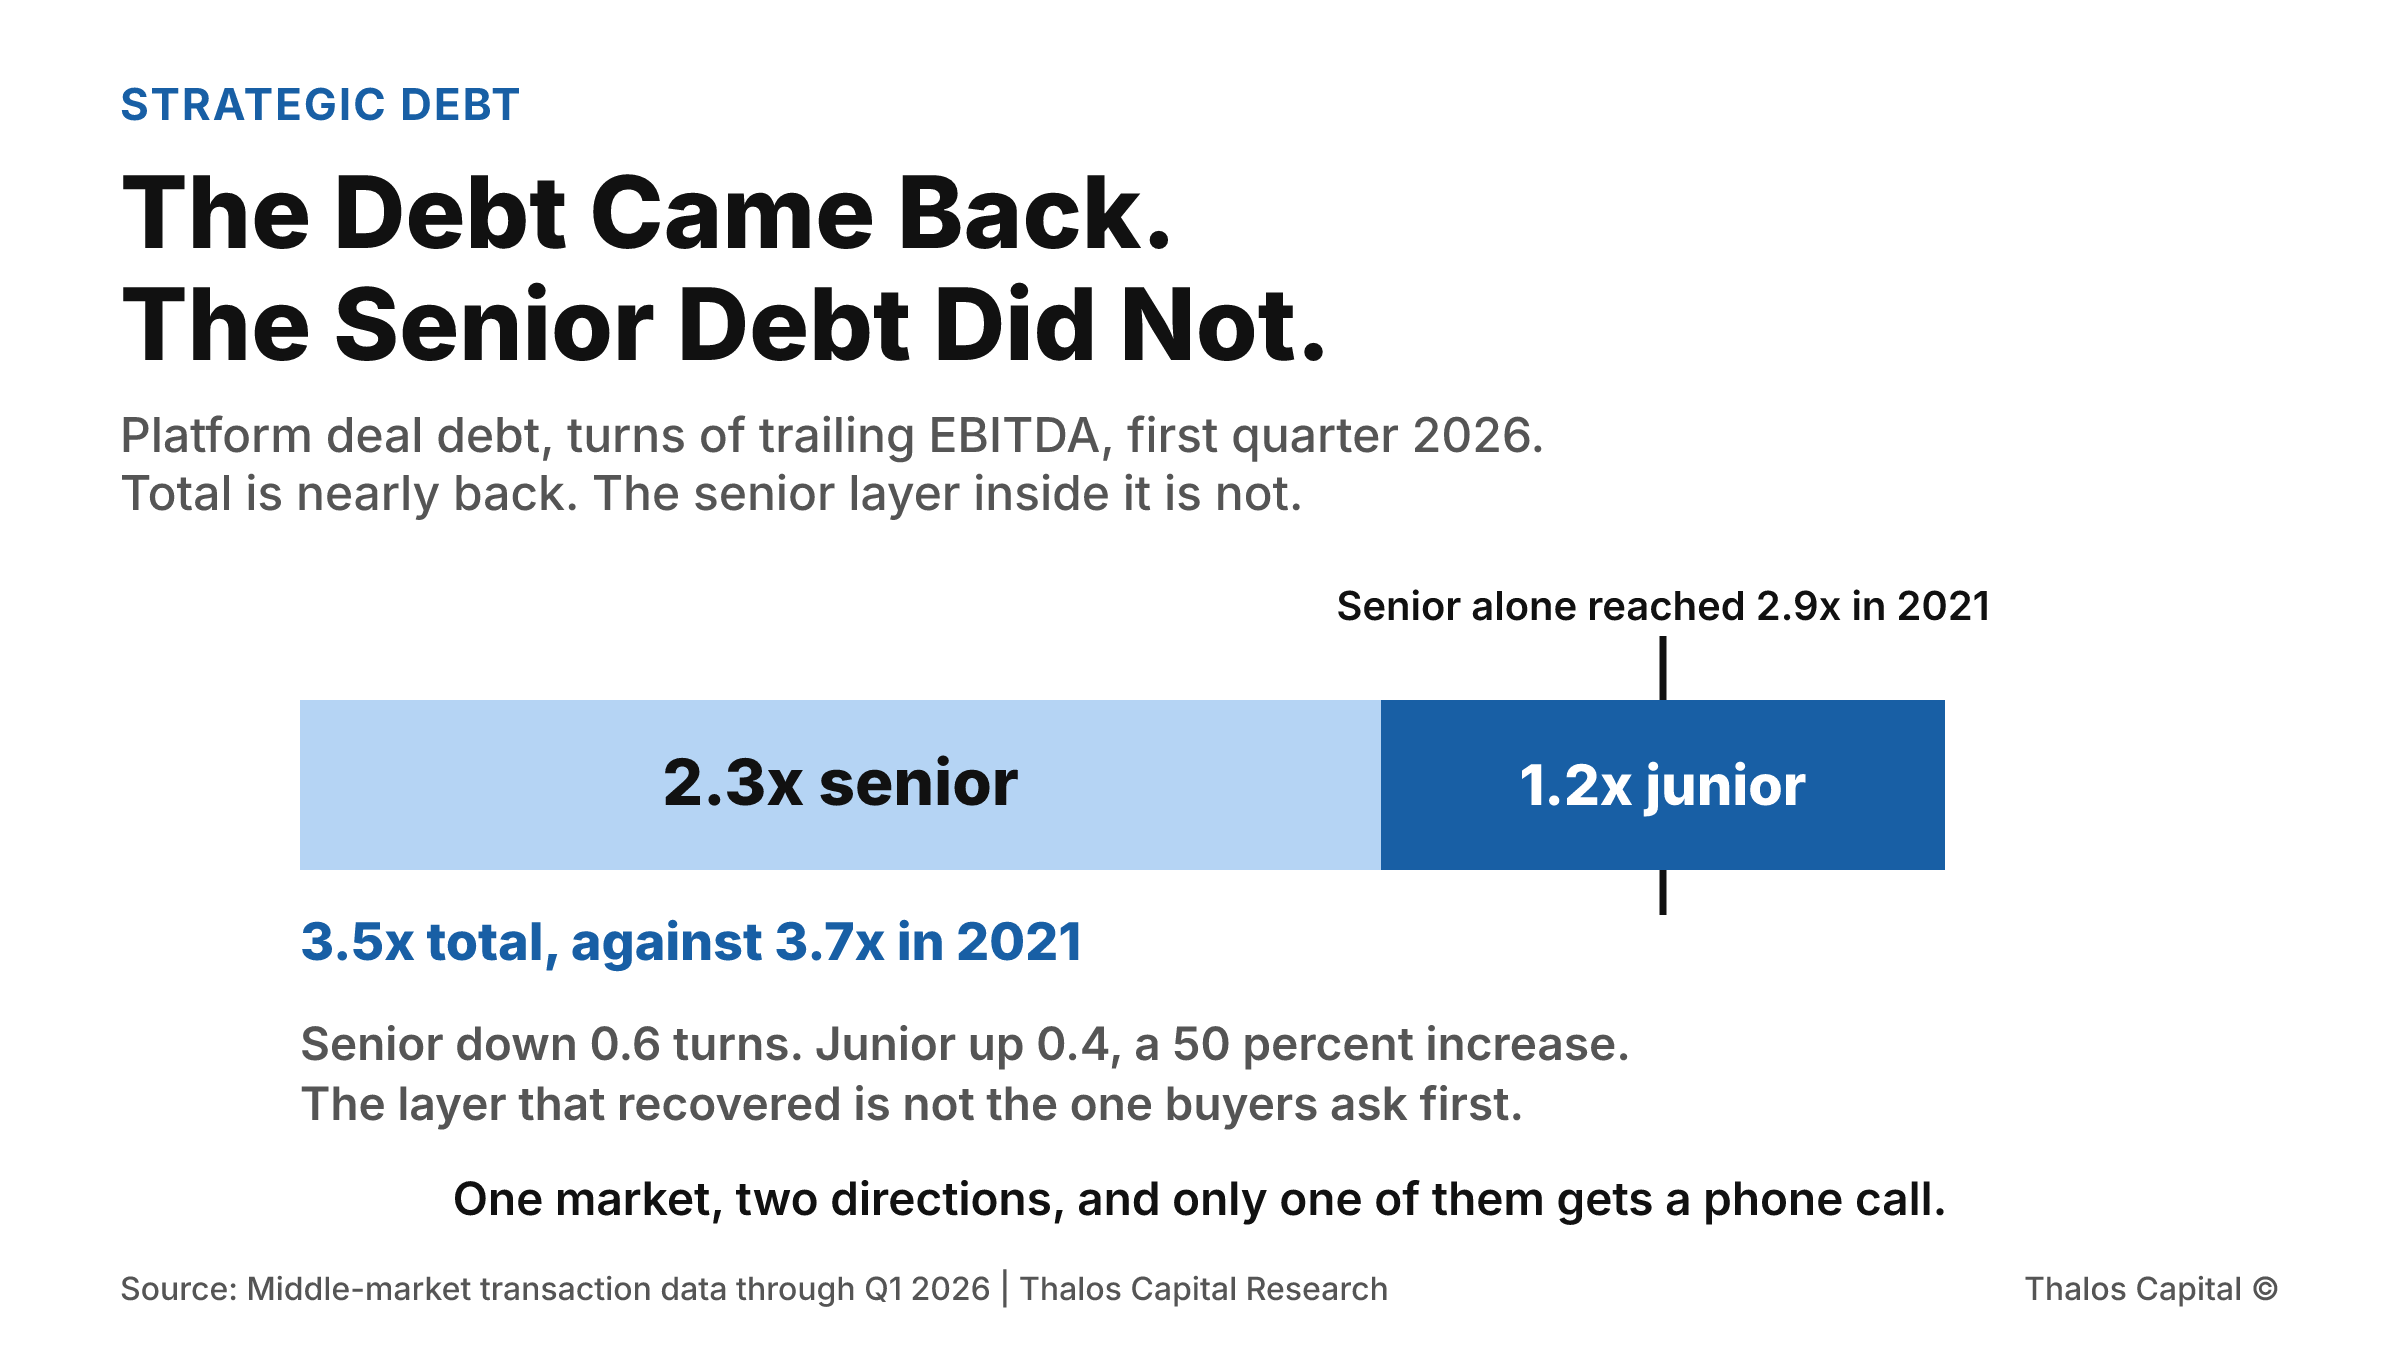
A single stacked bar showing platform deal debt at 3.5 times EBITDA in Q1 2026, split between 2.3 times of senior debt and 1.2 times of junior capital, with a marker showing that senior debt alone reached 2.9 times in 2021.

The Debt Came Back. The Senior Debt Did Not.

Acquisition leverage has recovered to roughly where it stood at the 2021 peak. On platform deals the senior layer has not, and the gap was filled by junior capital, which is not the pool most buyers approach first.
Read More
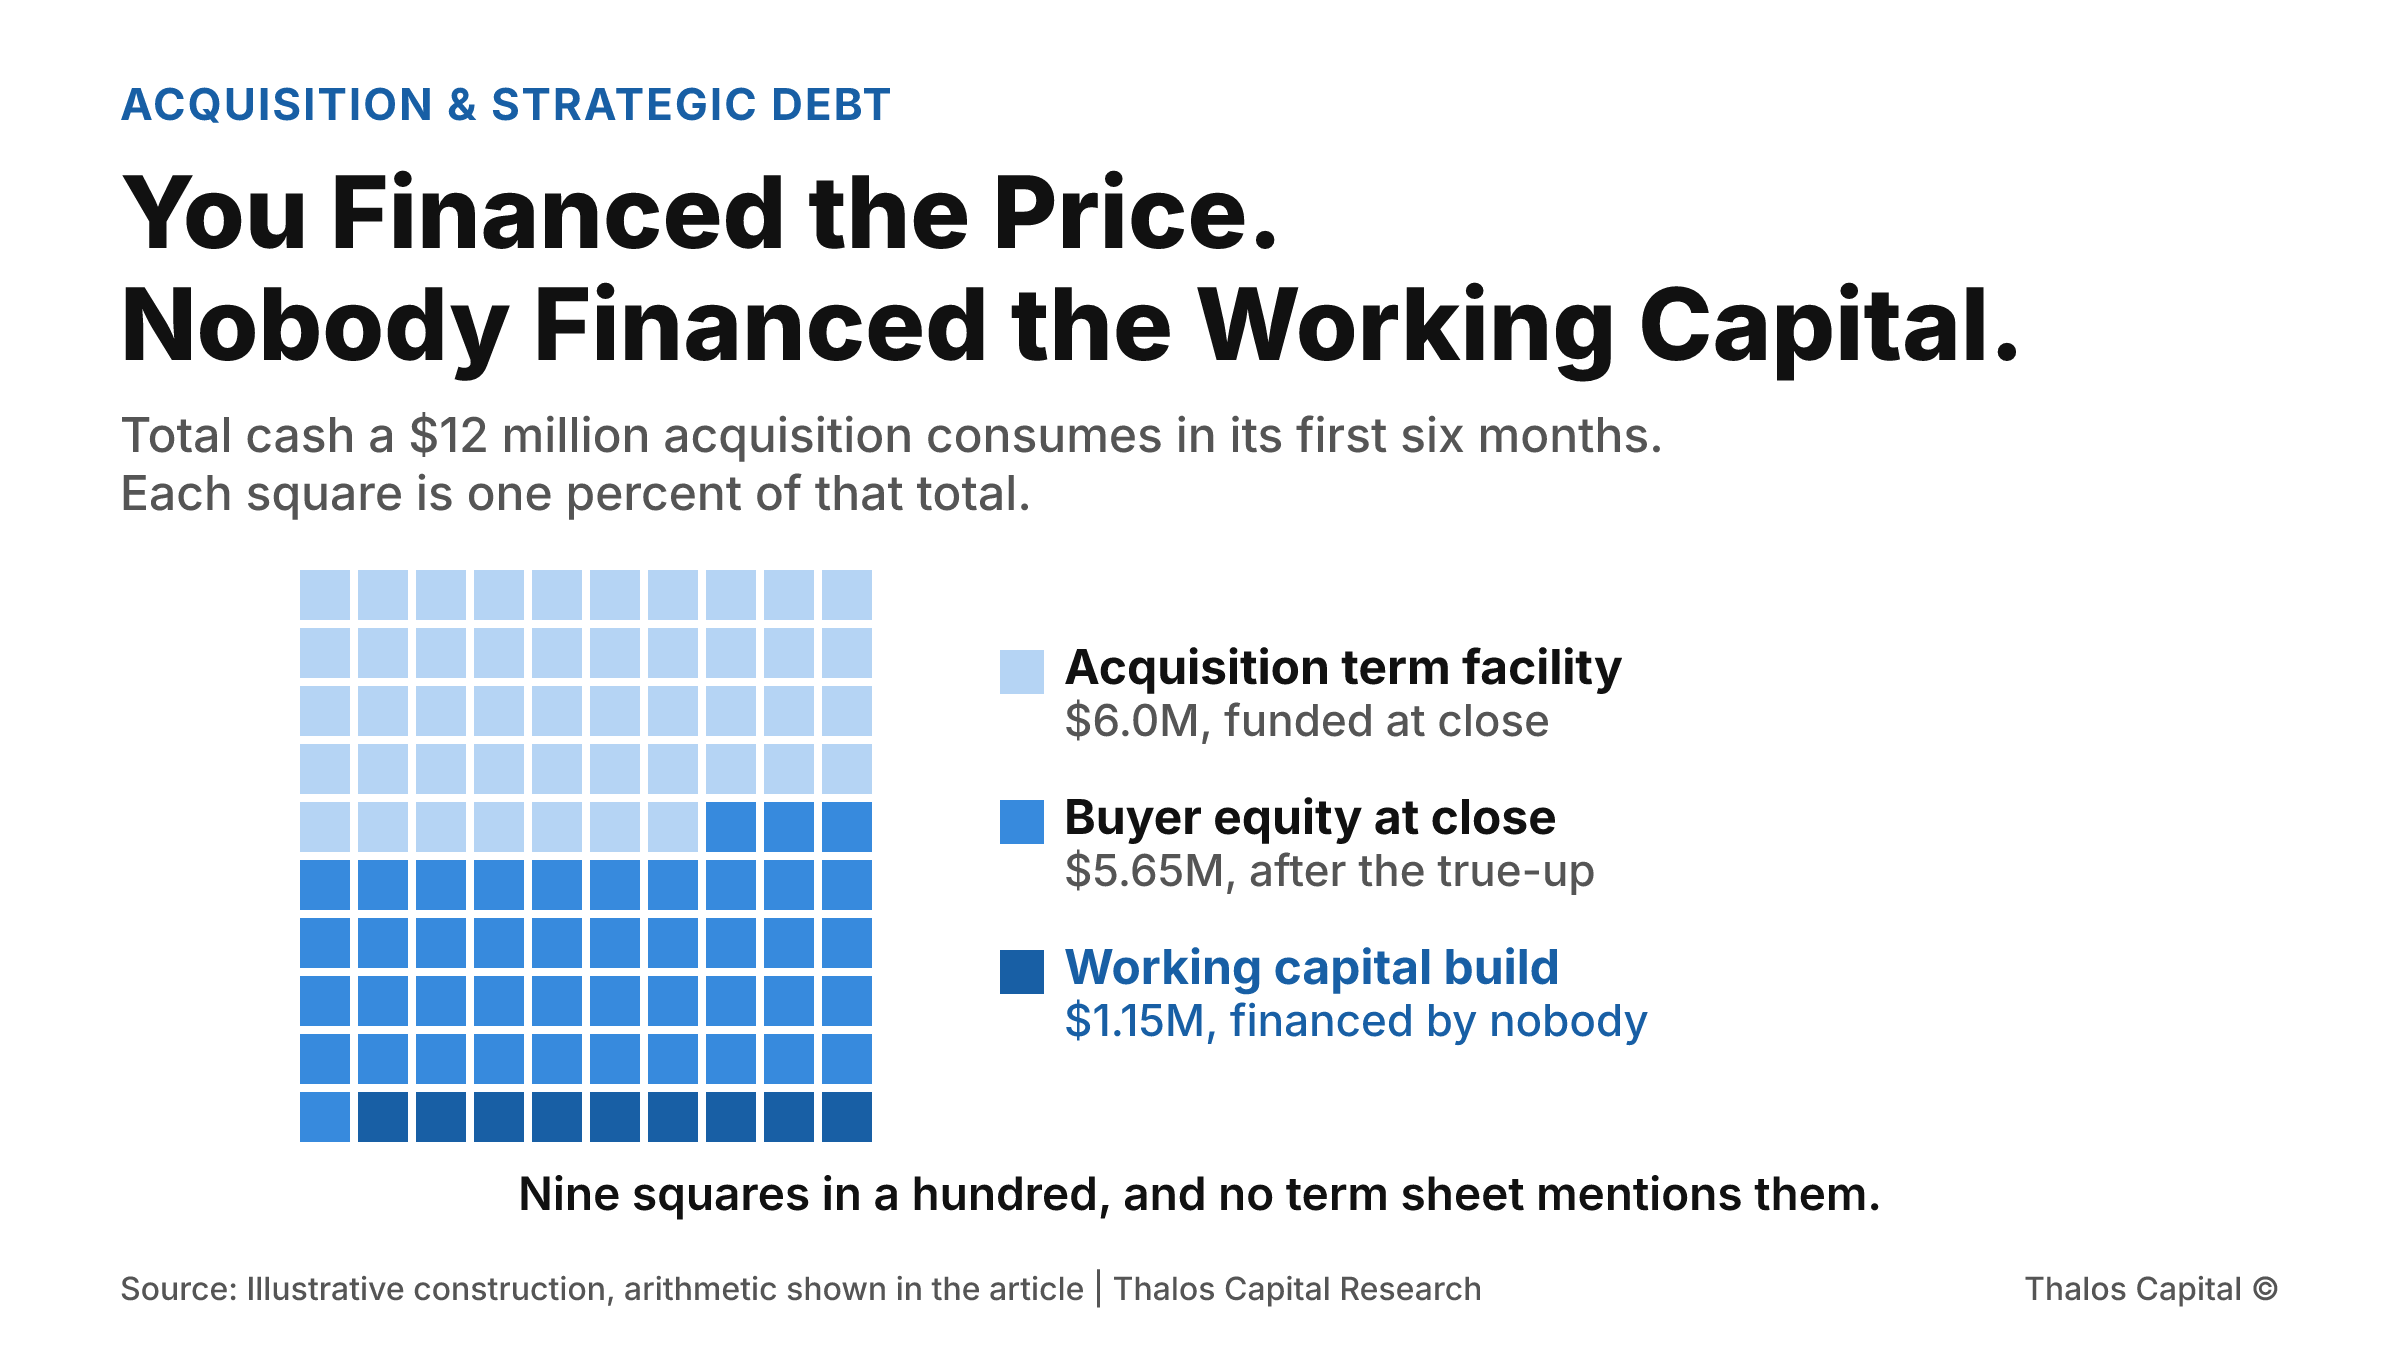
A hundred-square waffle showing the total cash a $12 million acquisition consumes in its first six months: 47 squares funded by the acquisition term facility, 44 by buyer equity at close, and 9 by a working capital build that sits outside the deal model.

You Financed the Price. Nobody Financed the Working Capital.

A buyer models an acquisition as price minus debt equals equity. Then the working capital true-up lands, and the seasonal build after it. The cash required is the same whichever month the deal closes, and the acquisition facility funds none of it.
Read More
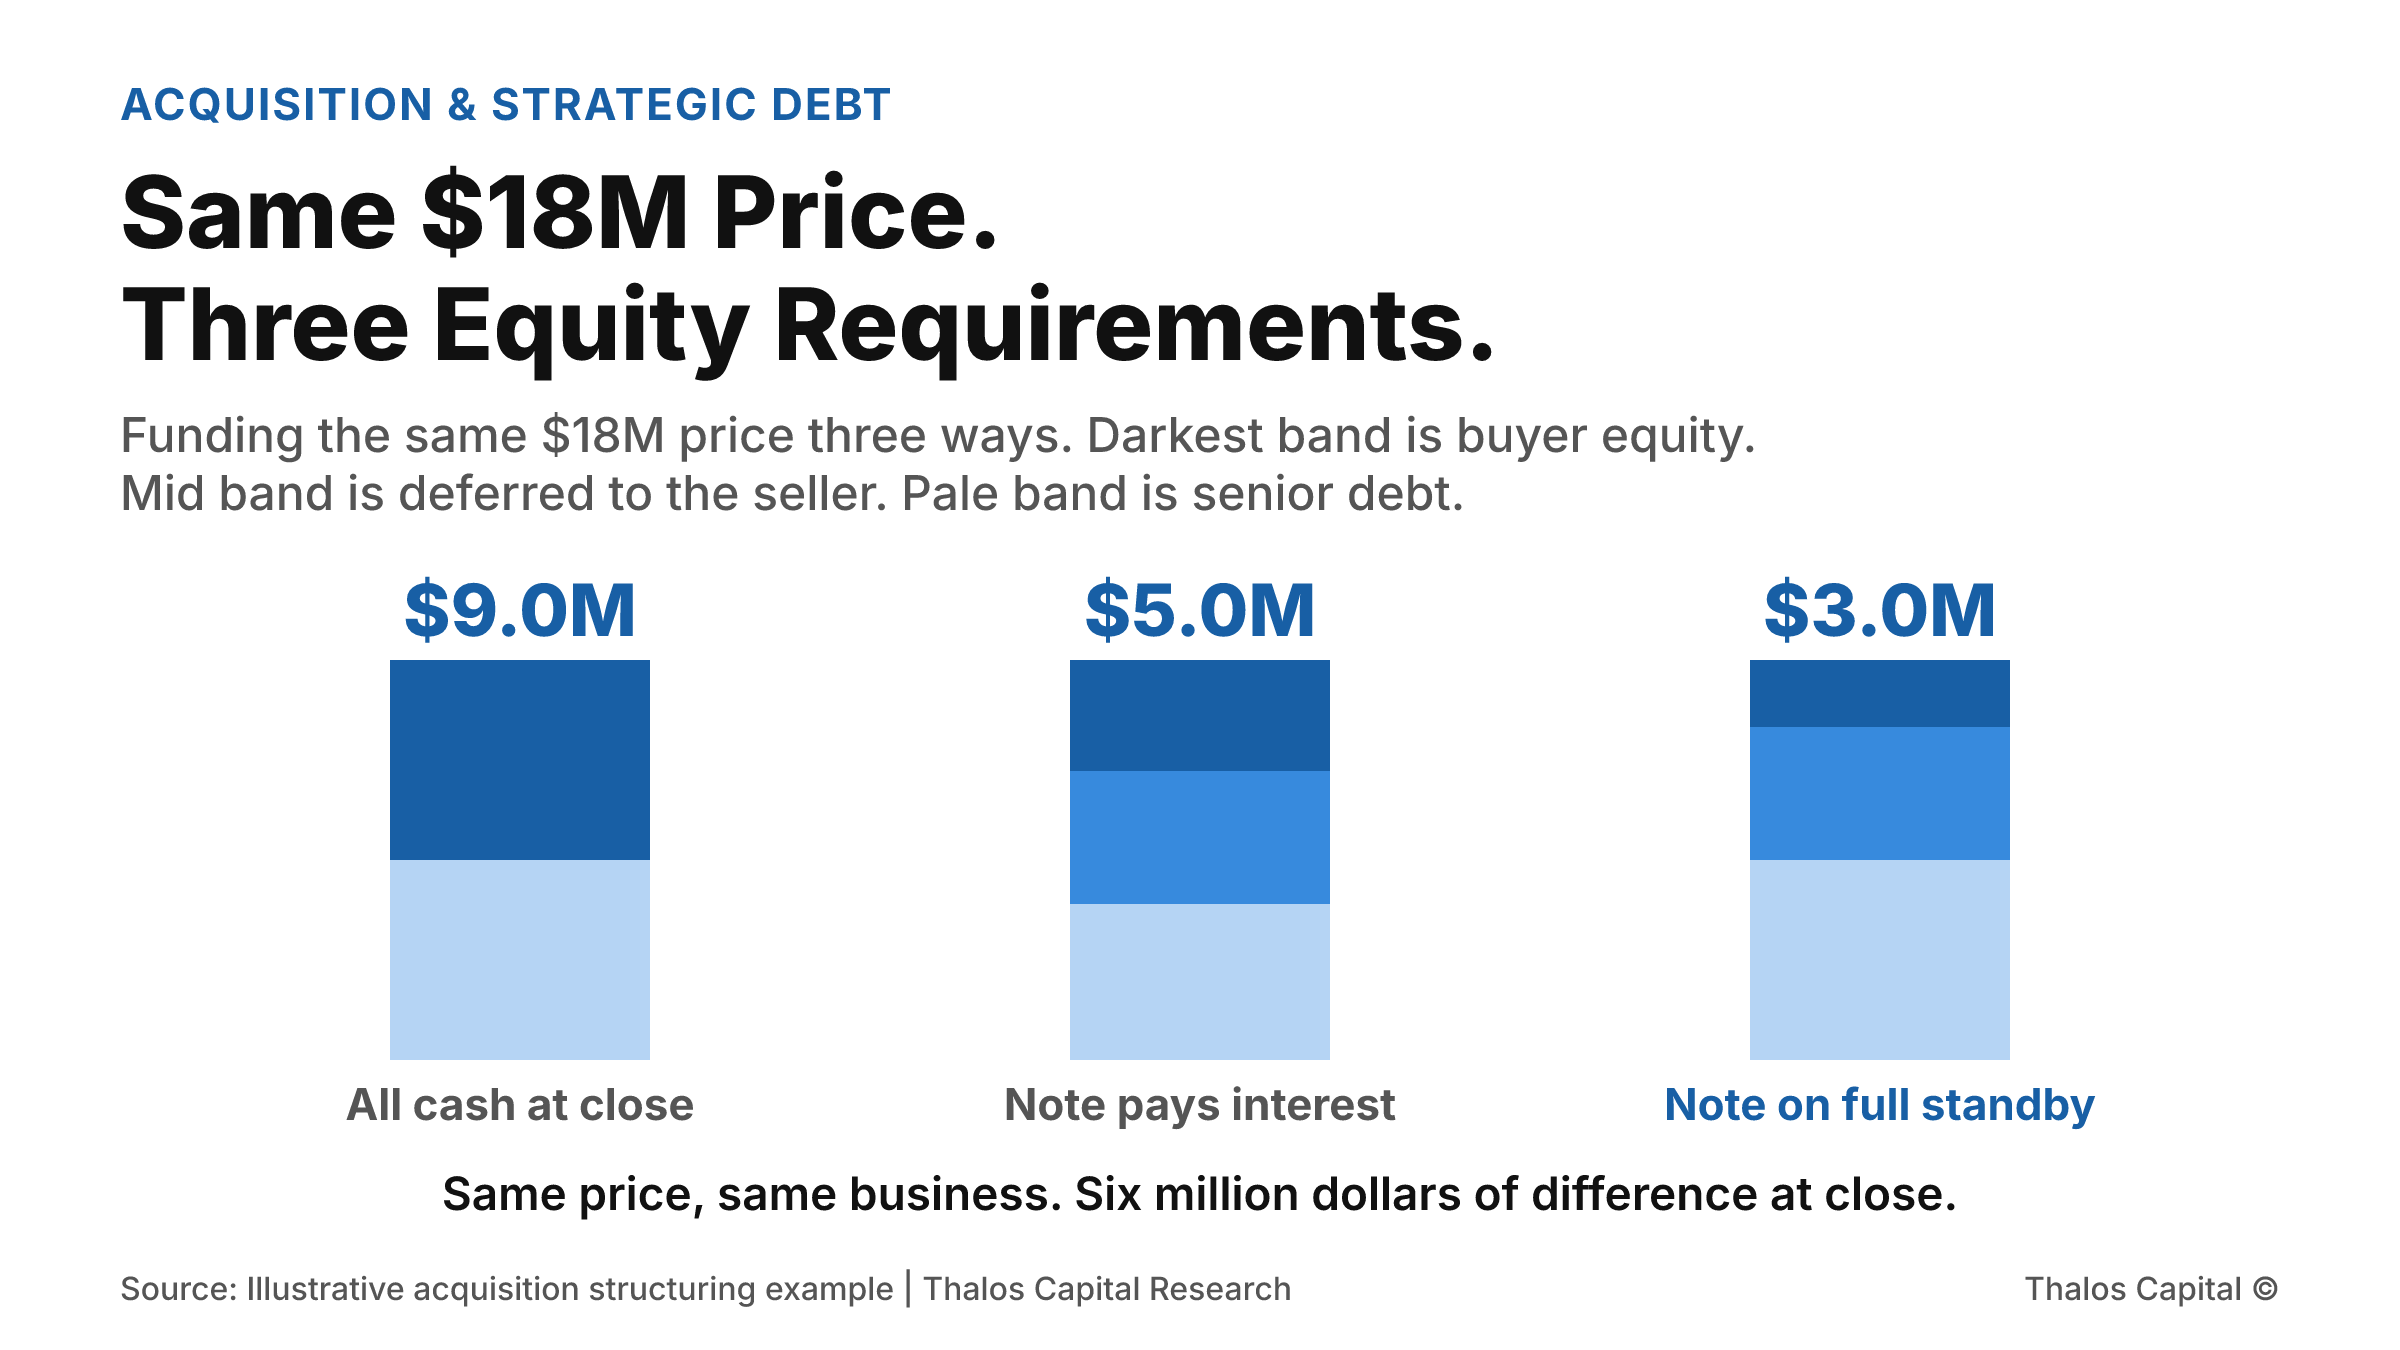
Three small stacked columns funding the same $18 million purchase price, showing buyer equity at close of $9 million on an all-cash deal, $5 million when the seller note pays current interest, and $3 million when the seller note sits on full standby.

Same $18M Price. Three Different Equity Requirements.

Two buyers agree the same $18 million price for the same business. Depending on how the deferred consideration is structured, the cash the buyer needs at close is $9 million, $5 million, or $3 million. The price never changed.
Read More
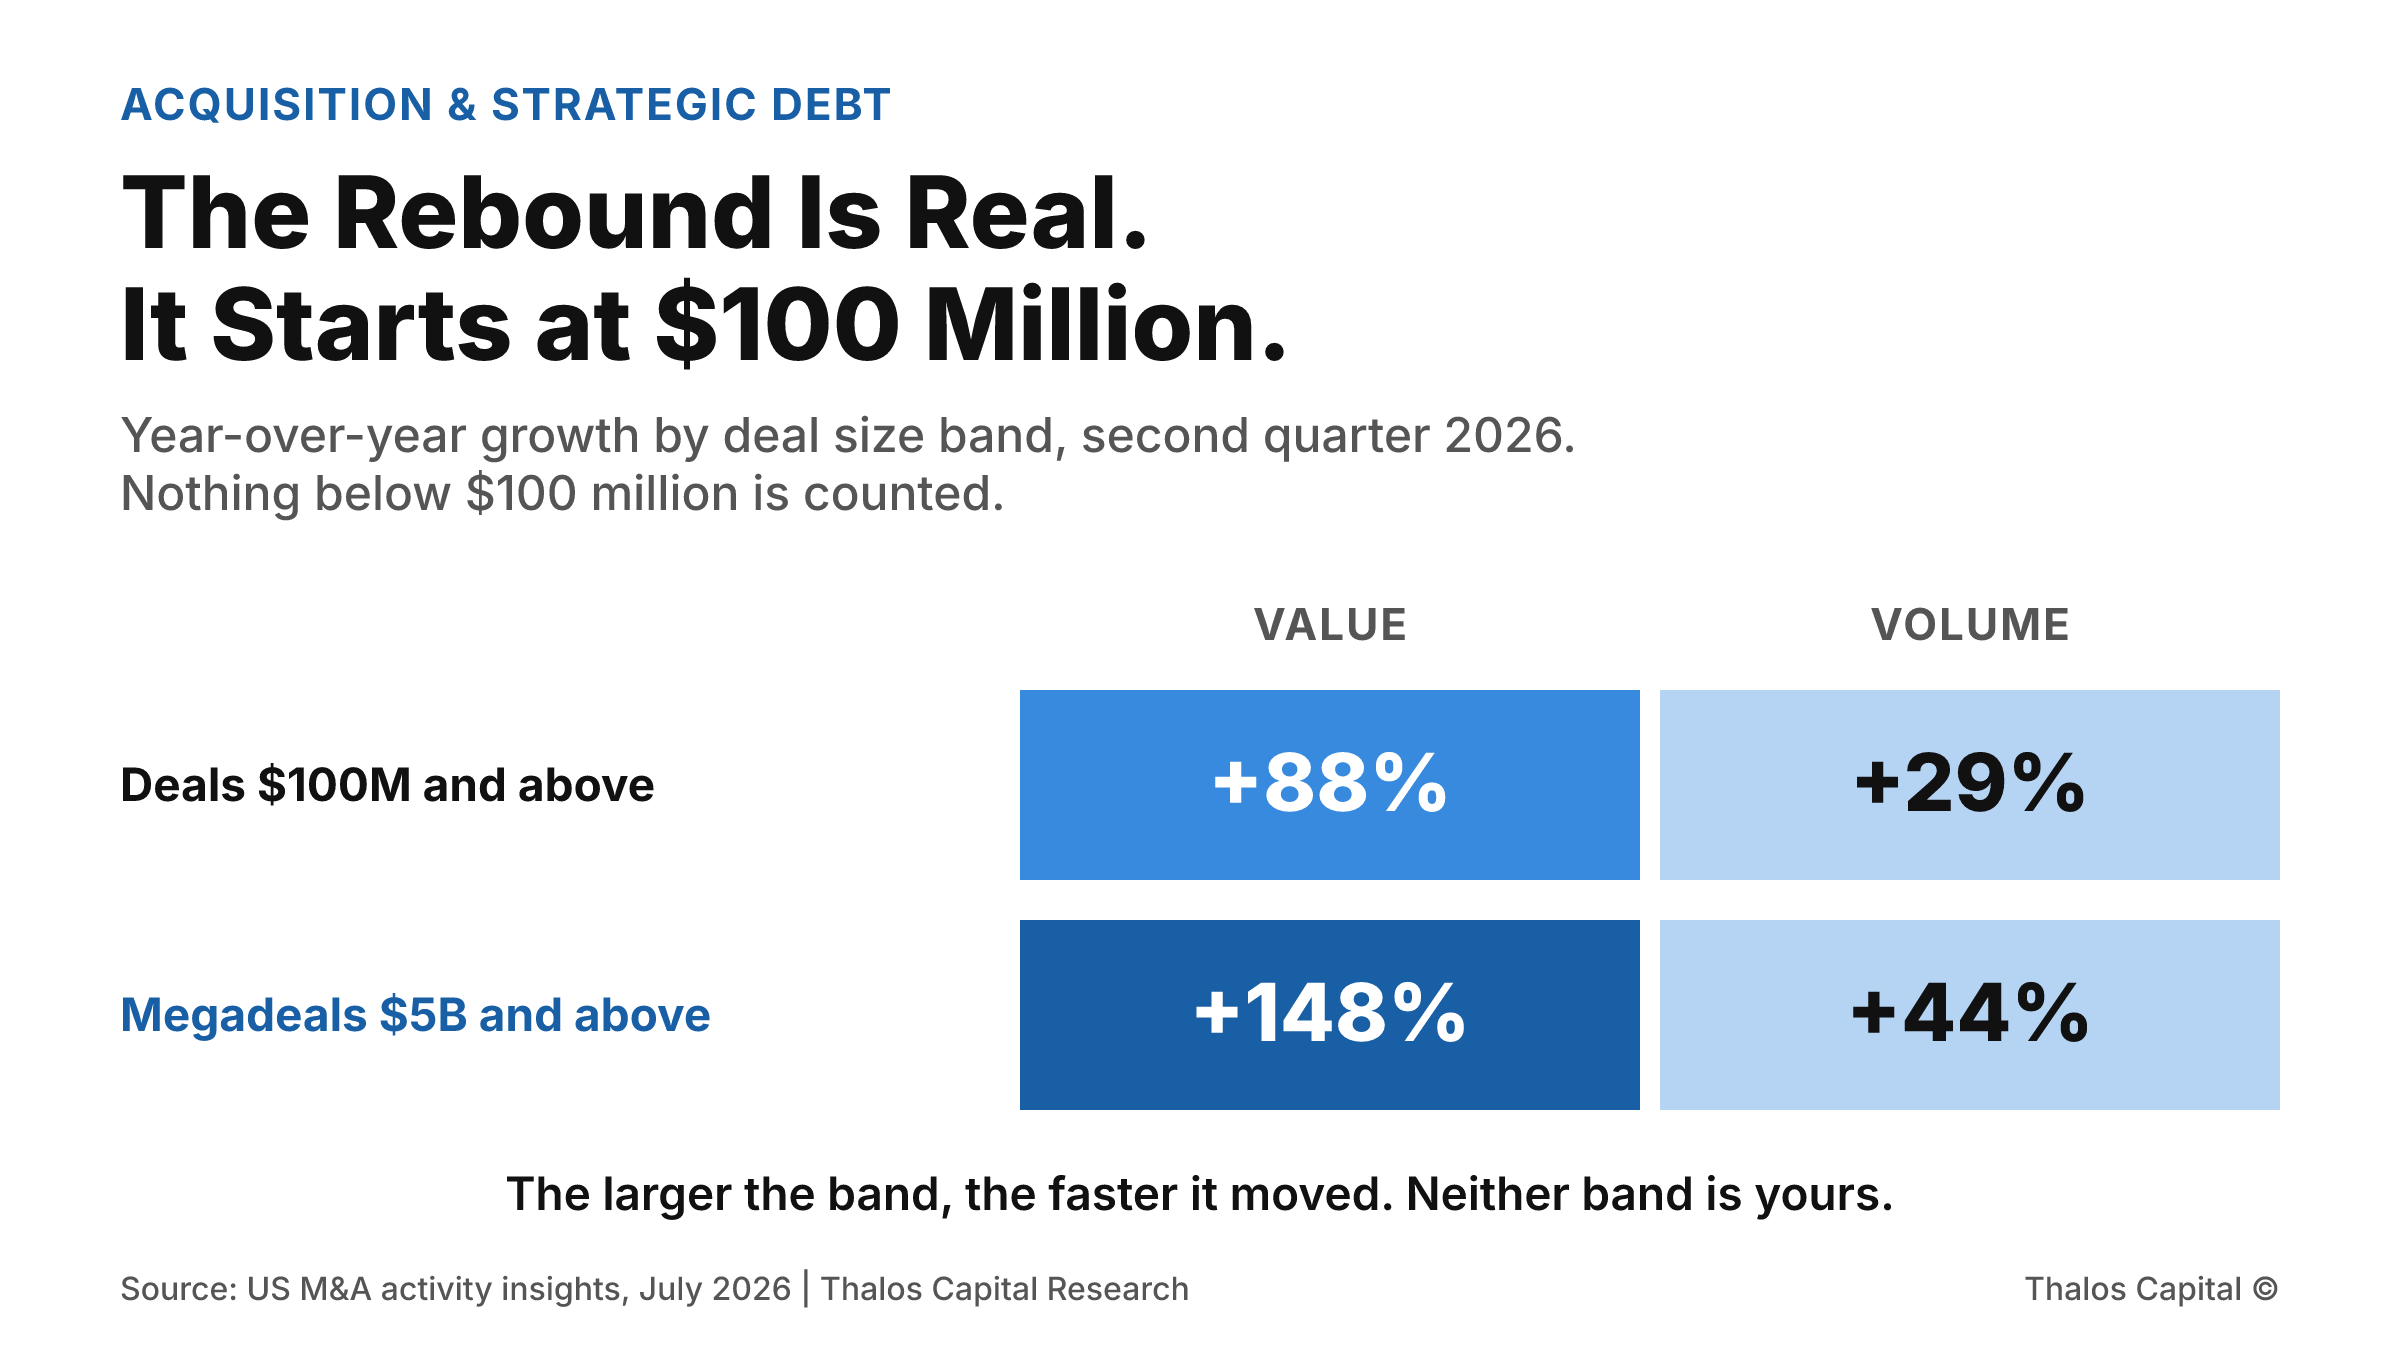
Shaded grid comparing year-over-year growth in the second quarter of 2026 for two deal size bands: transactions of $100 million or more grew 88 percent in value and 29 percent in volume, while megadeals of $5 billion or more grew 148 percent in value and 44 percent in volume, with the 148 percent figure shown in the darkest navy.

The Rebound Is Real. It Starts at $100 Million.

Second-quarter deals of $100 million or more rose 88 percent in value and 29 percent in volume, and the data that reports it does not count anything smaller. What that means for a buyer working a $5 to $50 million acquisition.
Read More
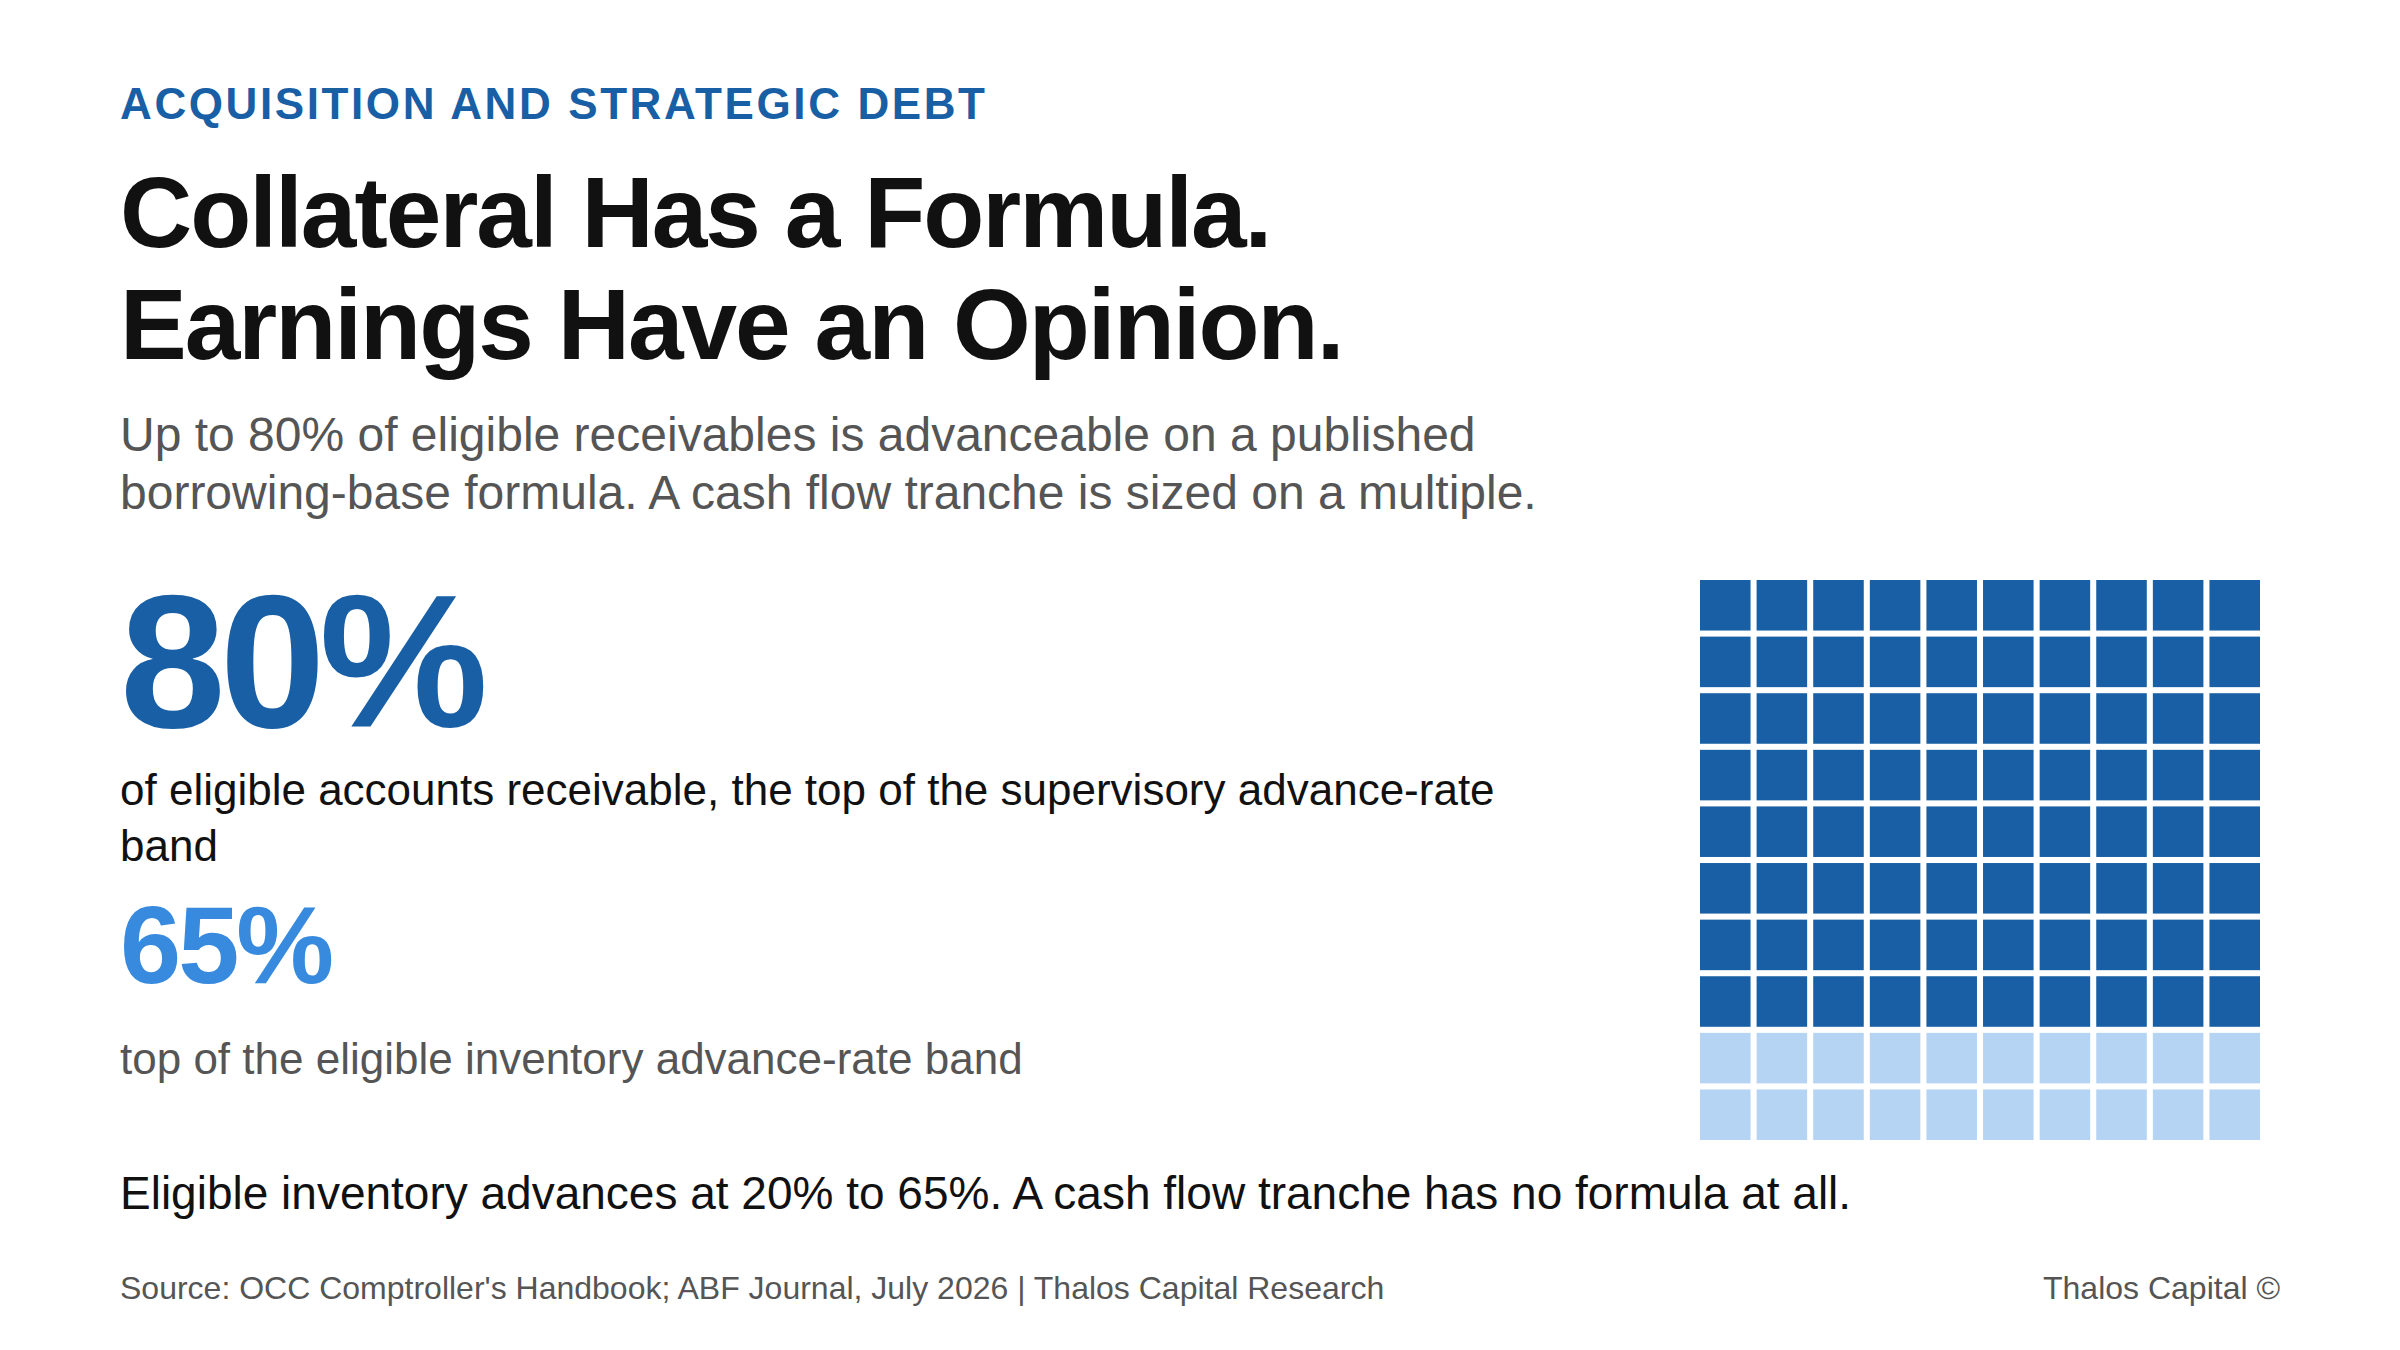
Squares pictogram showing 80 of 100 filled, representing the top of the 70 to 80 percent advance-rate band on eligible accounts receivable under a borrowing-base formula, with the 65 percent eligible inventory ceiling shown alongside.

You Are Buying a Balance Sheet and Financing It Like a Cash Flow Statement

Two facilities priced 200 to 250 basis points apart in the same week. The difference was collateral, not credit. Why acquisition debt sized only on EBITDA leaves both pricing and capacity on the table.
Read More
Working through a financing decision?
Insights are a starting point. A conversation maps your actual options.
Tell us what you are financing and we will map the structures and sources that fit.
Submit your financing request →
Explore our financing solutions
Equipment FinancingWorking CapitalAsset-Based LendingStrategic Debt