Tag

recurring revenue debt

10 insights

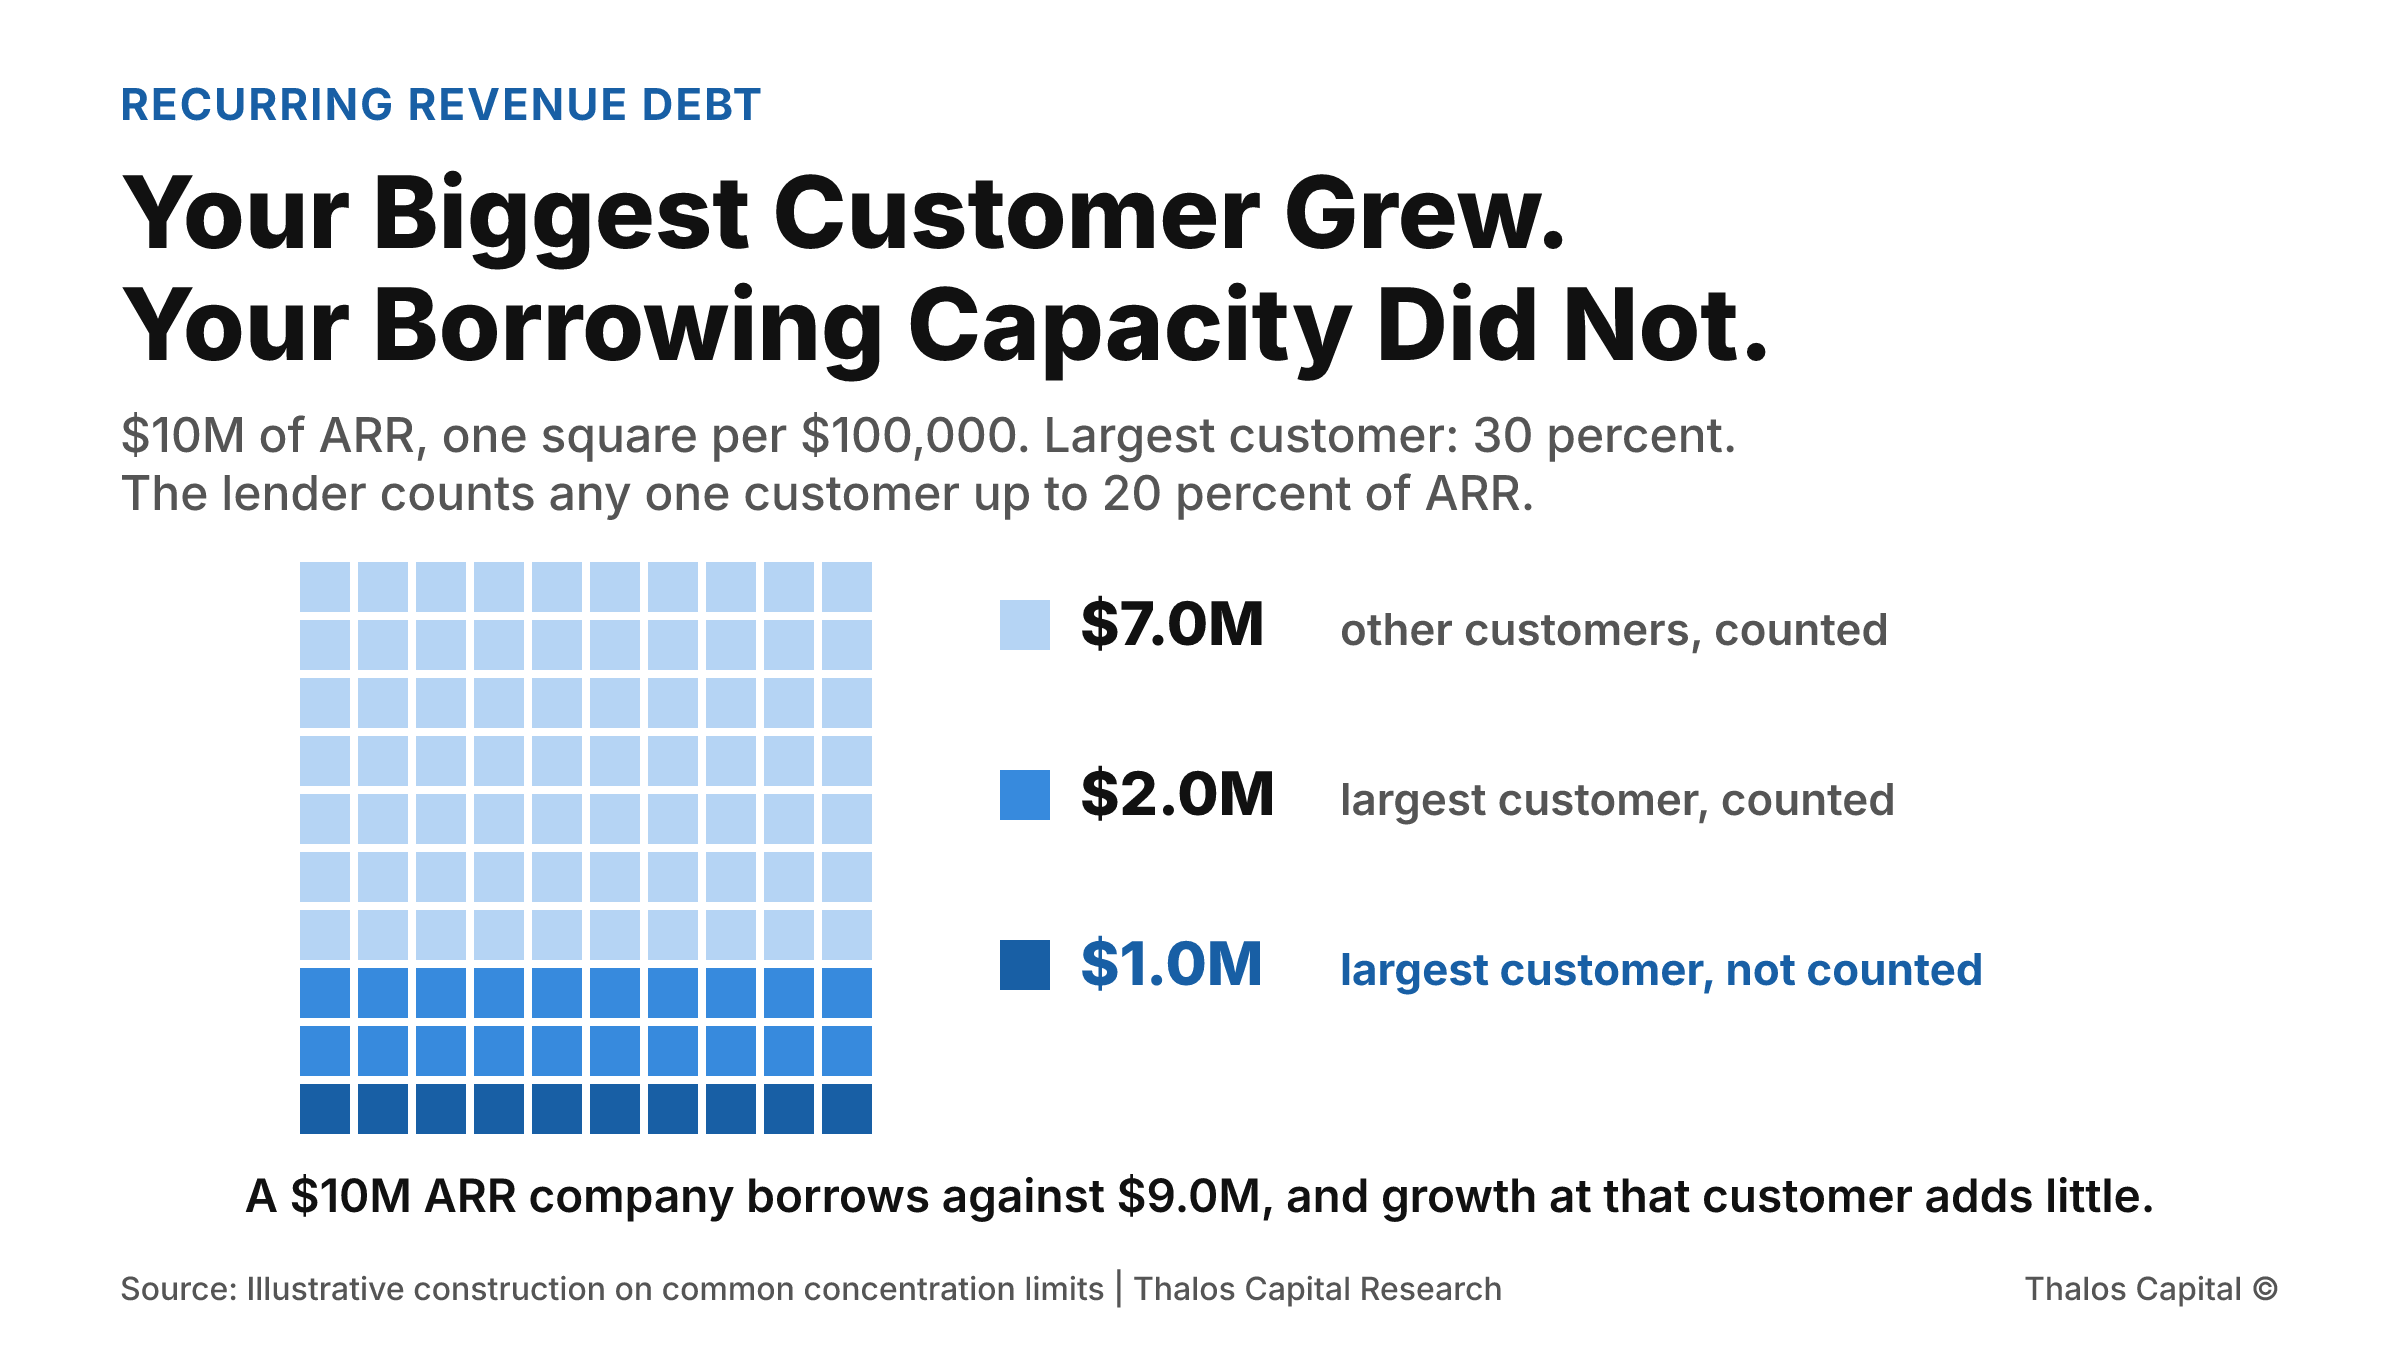
A grid of 100 squares, each worth $100,000 of a software company's $10 million ARR. Seventy squares are other customers and count toward borrowing. Thirty belong to the largest customer: twenty count and ten, the excess above a 20 percent concentration cap, do not.

Your Biggest Customer Grew. Your Borrowing Capacity Did Not.

A $10 million ARR software company adds $2 million of new ARR. From its largest customer, that lifts borrowing capacity by $240,000. From two new customers, the same ARR lifts it by $1.44 million, six times as much.
Read More
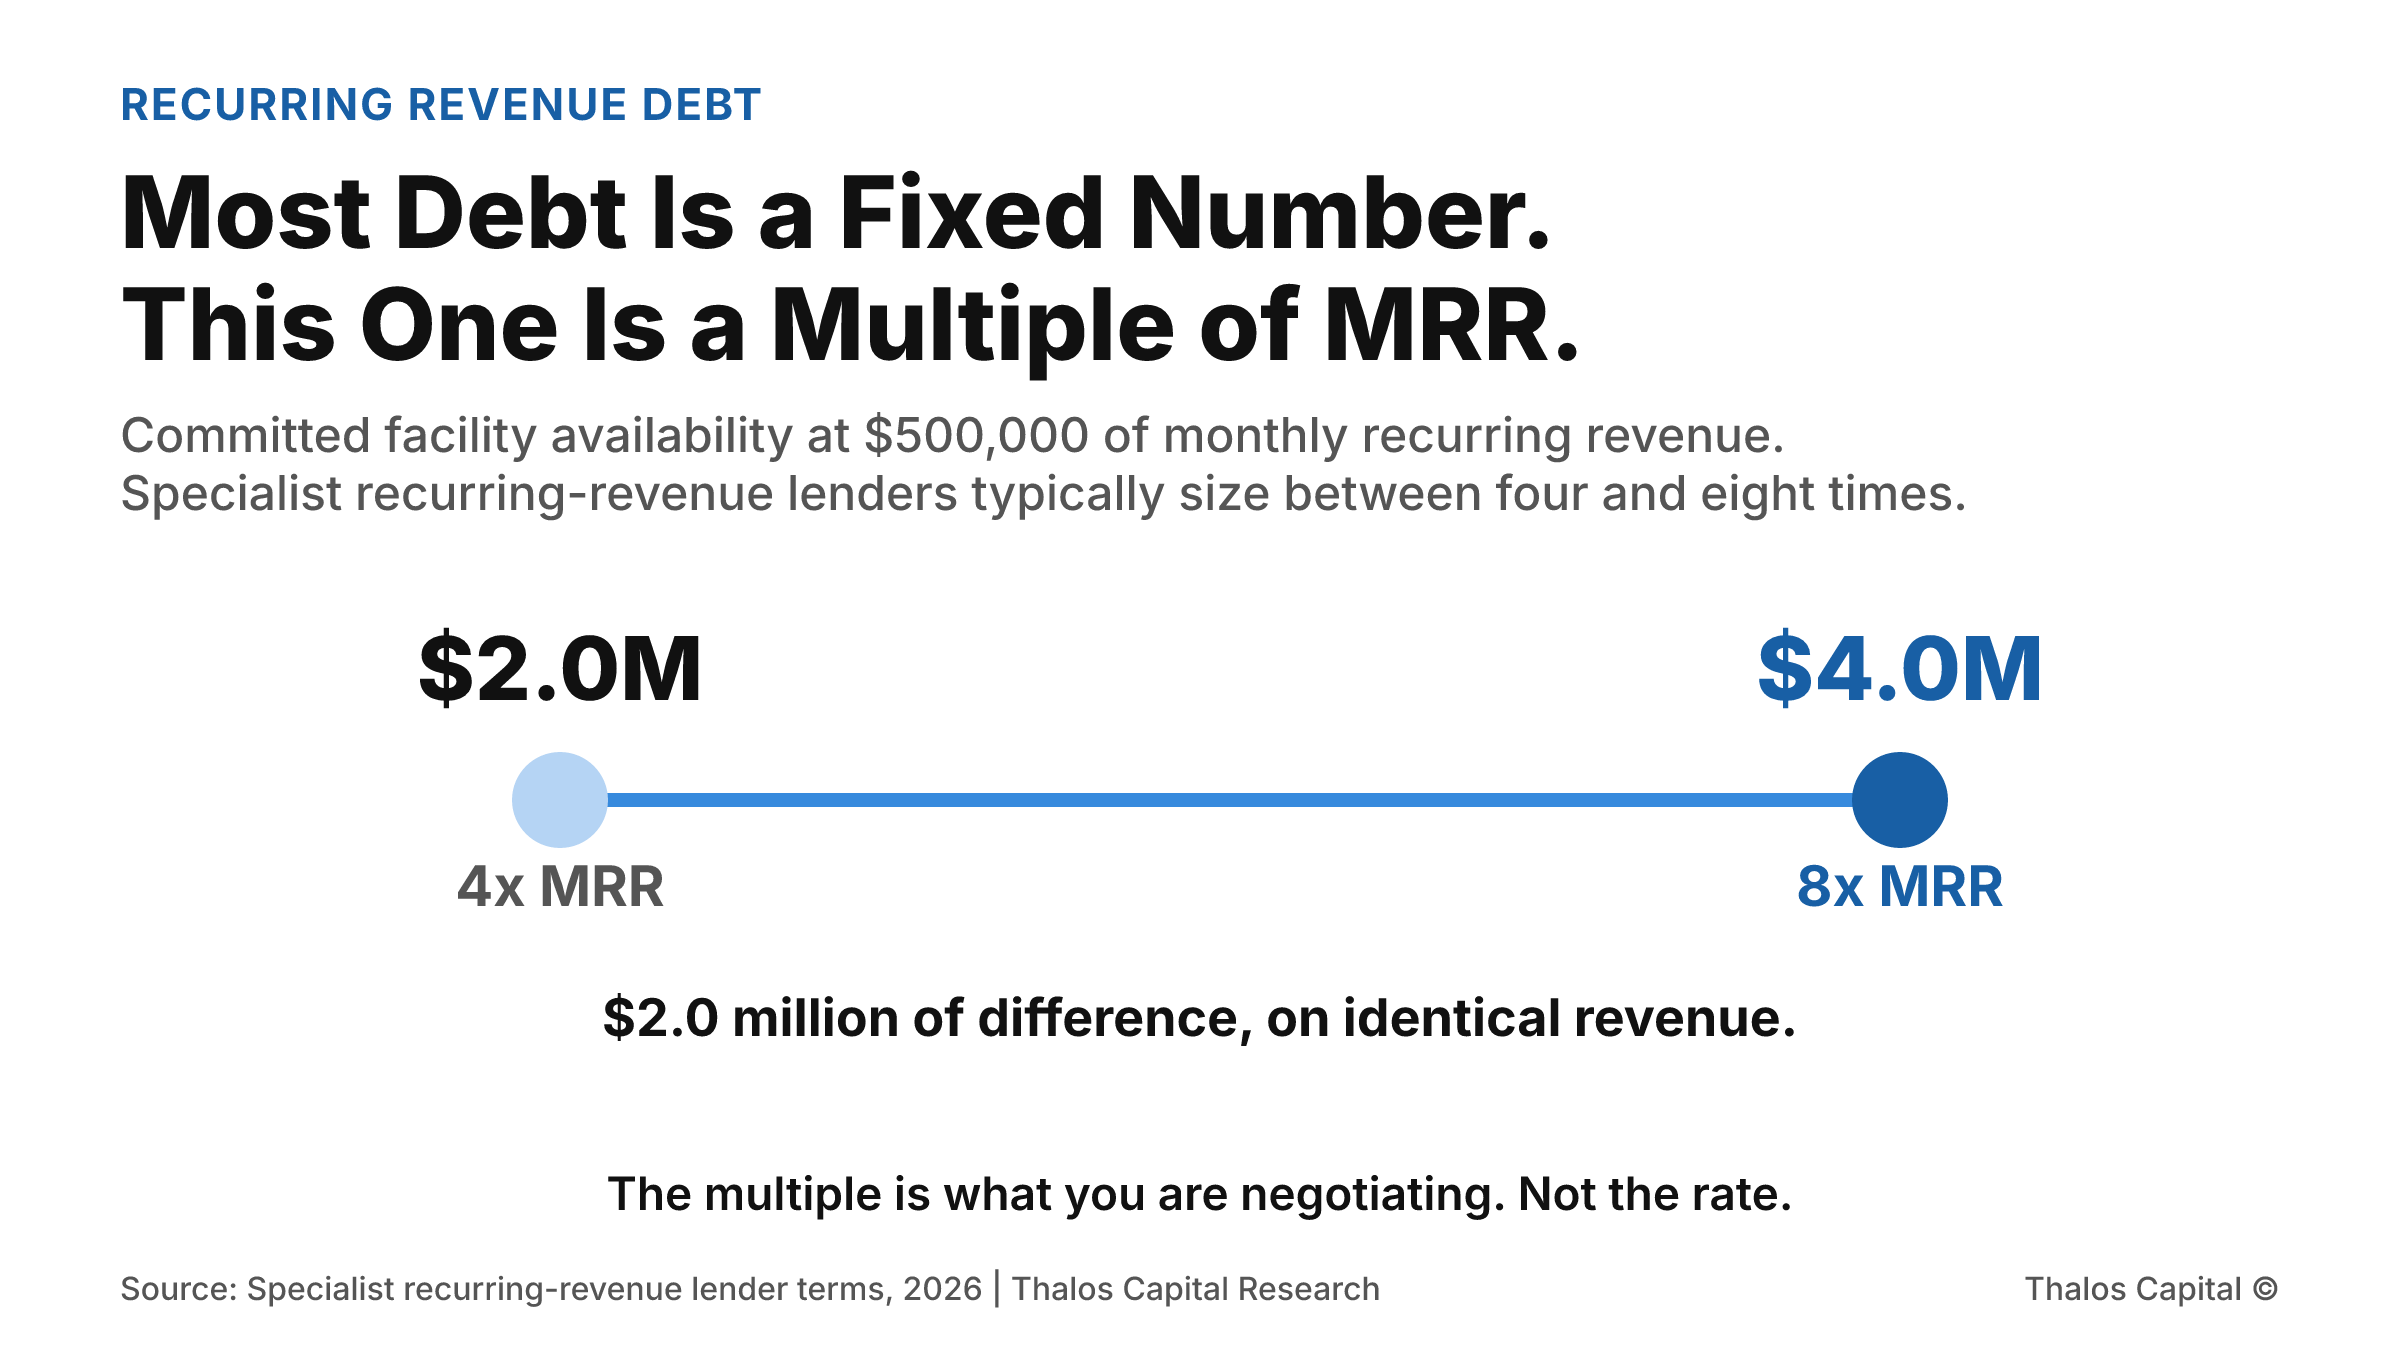
A two-point range showing that a company at $500,000 of monthly recurring revenue can access $2.0 million at a four times multiple or $4.0 million at eight times, a $2.0 million spread on identical revenue.

Most Debt Is a Fixed Number. This One Is a Multiple of MRR.

A term loan is sized once and never changes. A committed facility against recurring revenue is sized as a multiple of monthly revenue, and availability rises as that revenue rises, without a second underwriting.
Read More
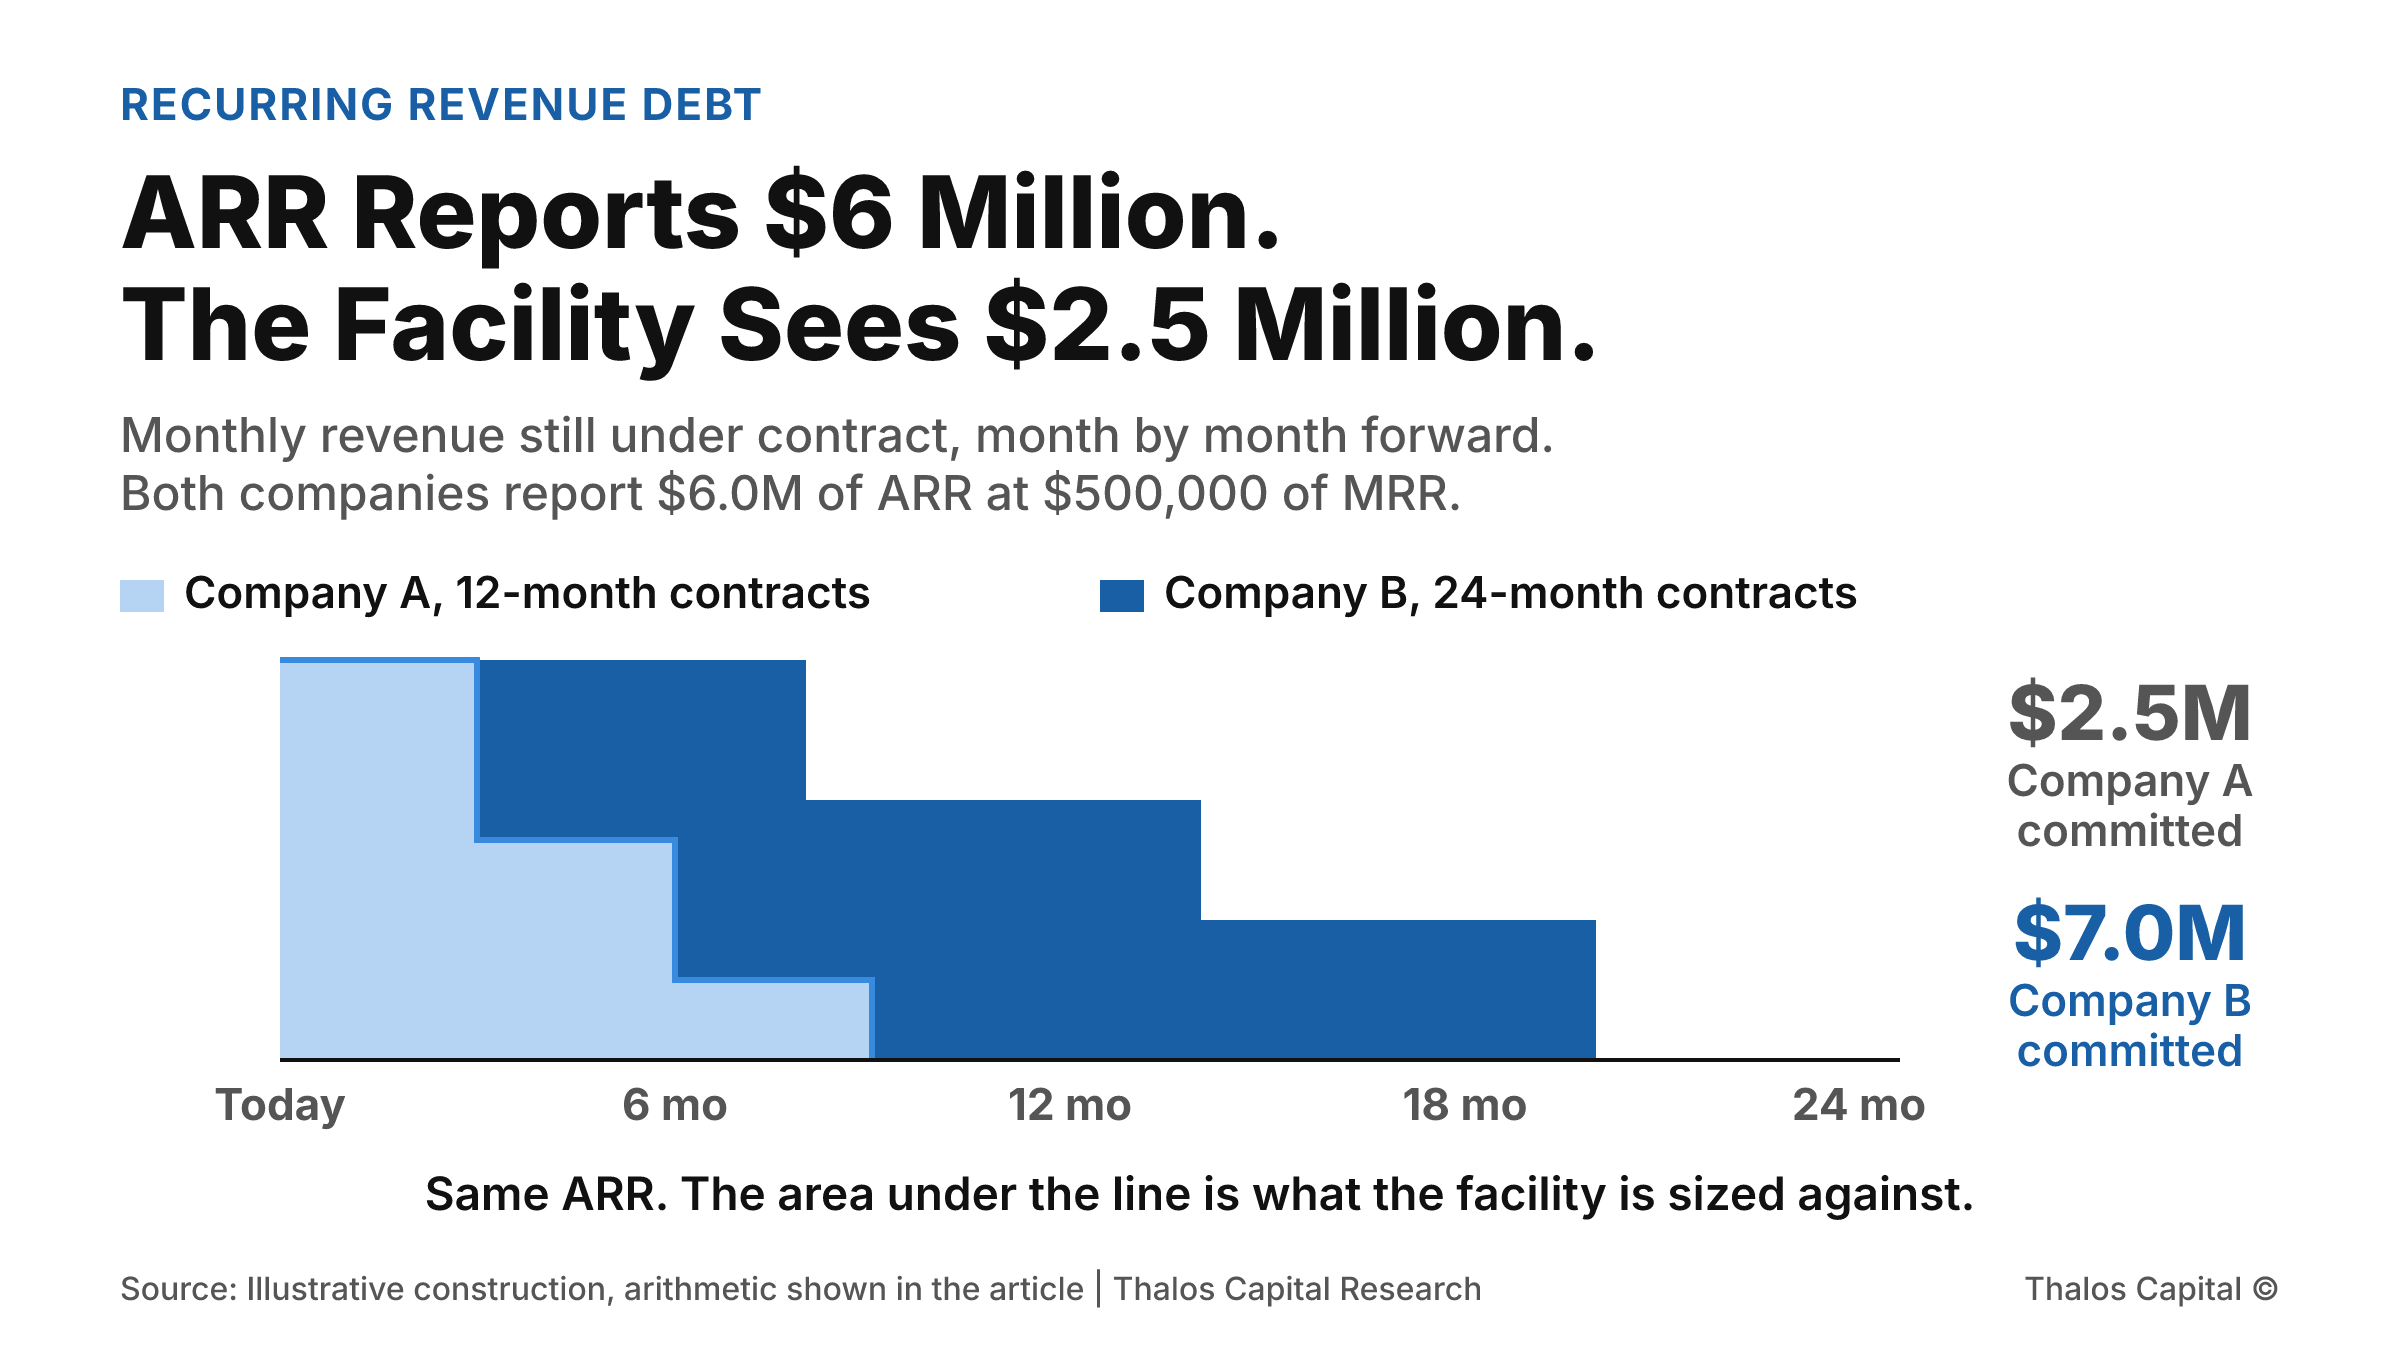
Two stepped areas showing monthly revenue still under contract over the next 24 months for two companies with identical $6.0 million ARR: a 12-month contract book holding $2.5 million of remaining contracted value and a 24-month contract book holding $7.0 million.

ARR Reports $6 Million. The Facility Sees $2.5 Million.

Two recurring-revenue companies each report $6.0 million of ARR. One is offered a $2.0 million facility and the other $1.0 million. The difference is contract length, and it does not appear in any metric either company reports.
Read More
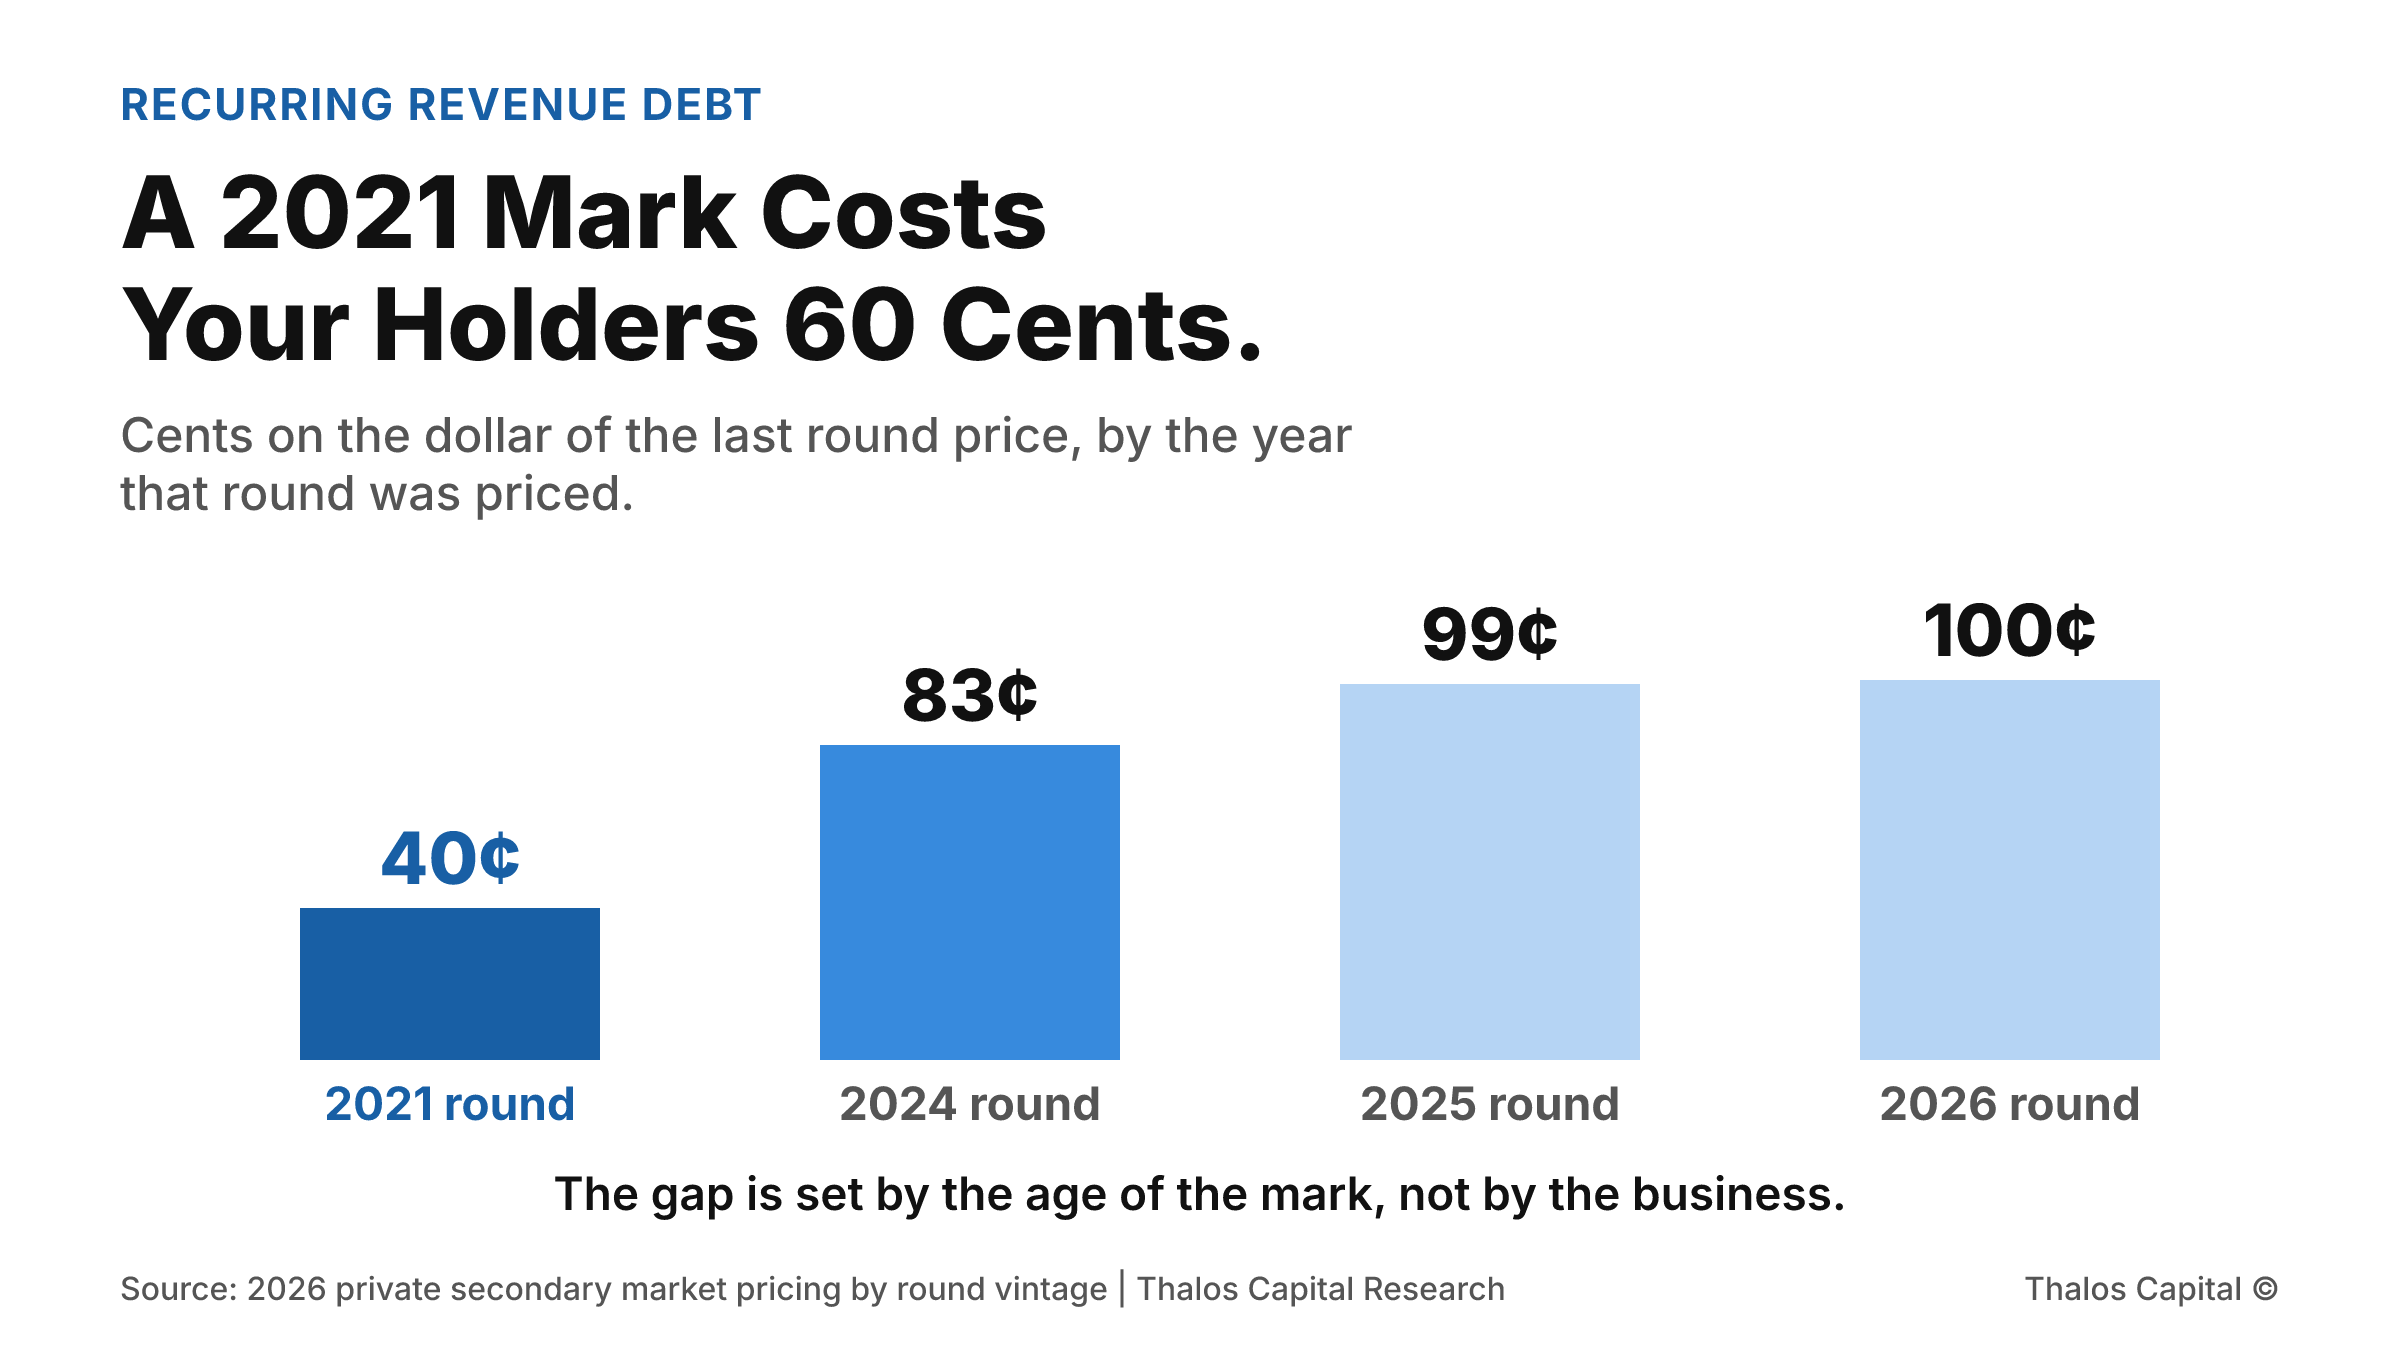
Column chart of what private shares fetch as cents on the dollar of the last round price, by the year that round was priced: about 40 cents for a 2021 mark shown in the darkest navy, 83 cents for 2024, 99 cents for 2025 and 100 cents for 2026.

A 2021 Mark Costs Your Holders 60 Cents.

Private shares trade below the last round price, and how far below depends on when that round was priced. A 2021 mark trades around 60 percent under. A 2025 mark trades around 1 percent under. What that costs an early holder.
Read More
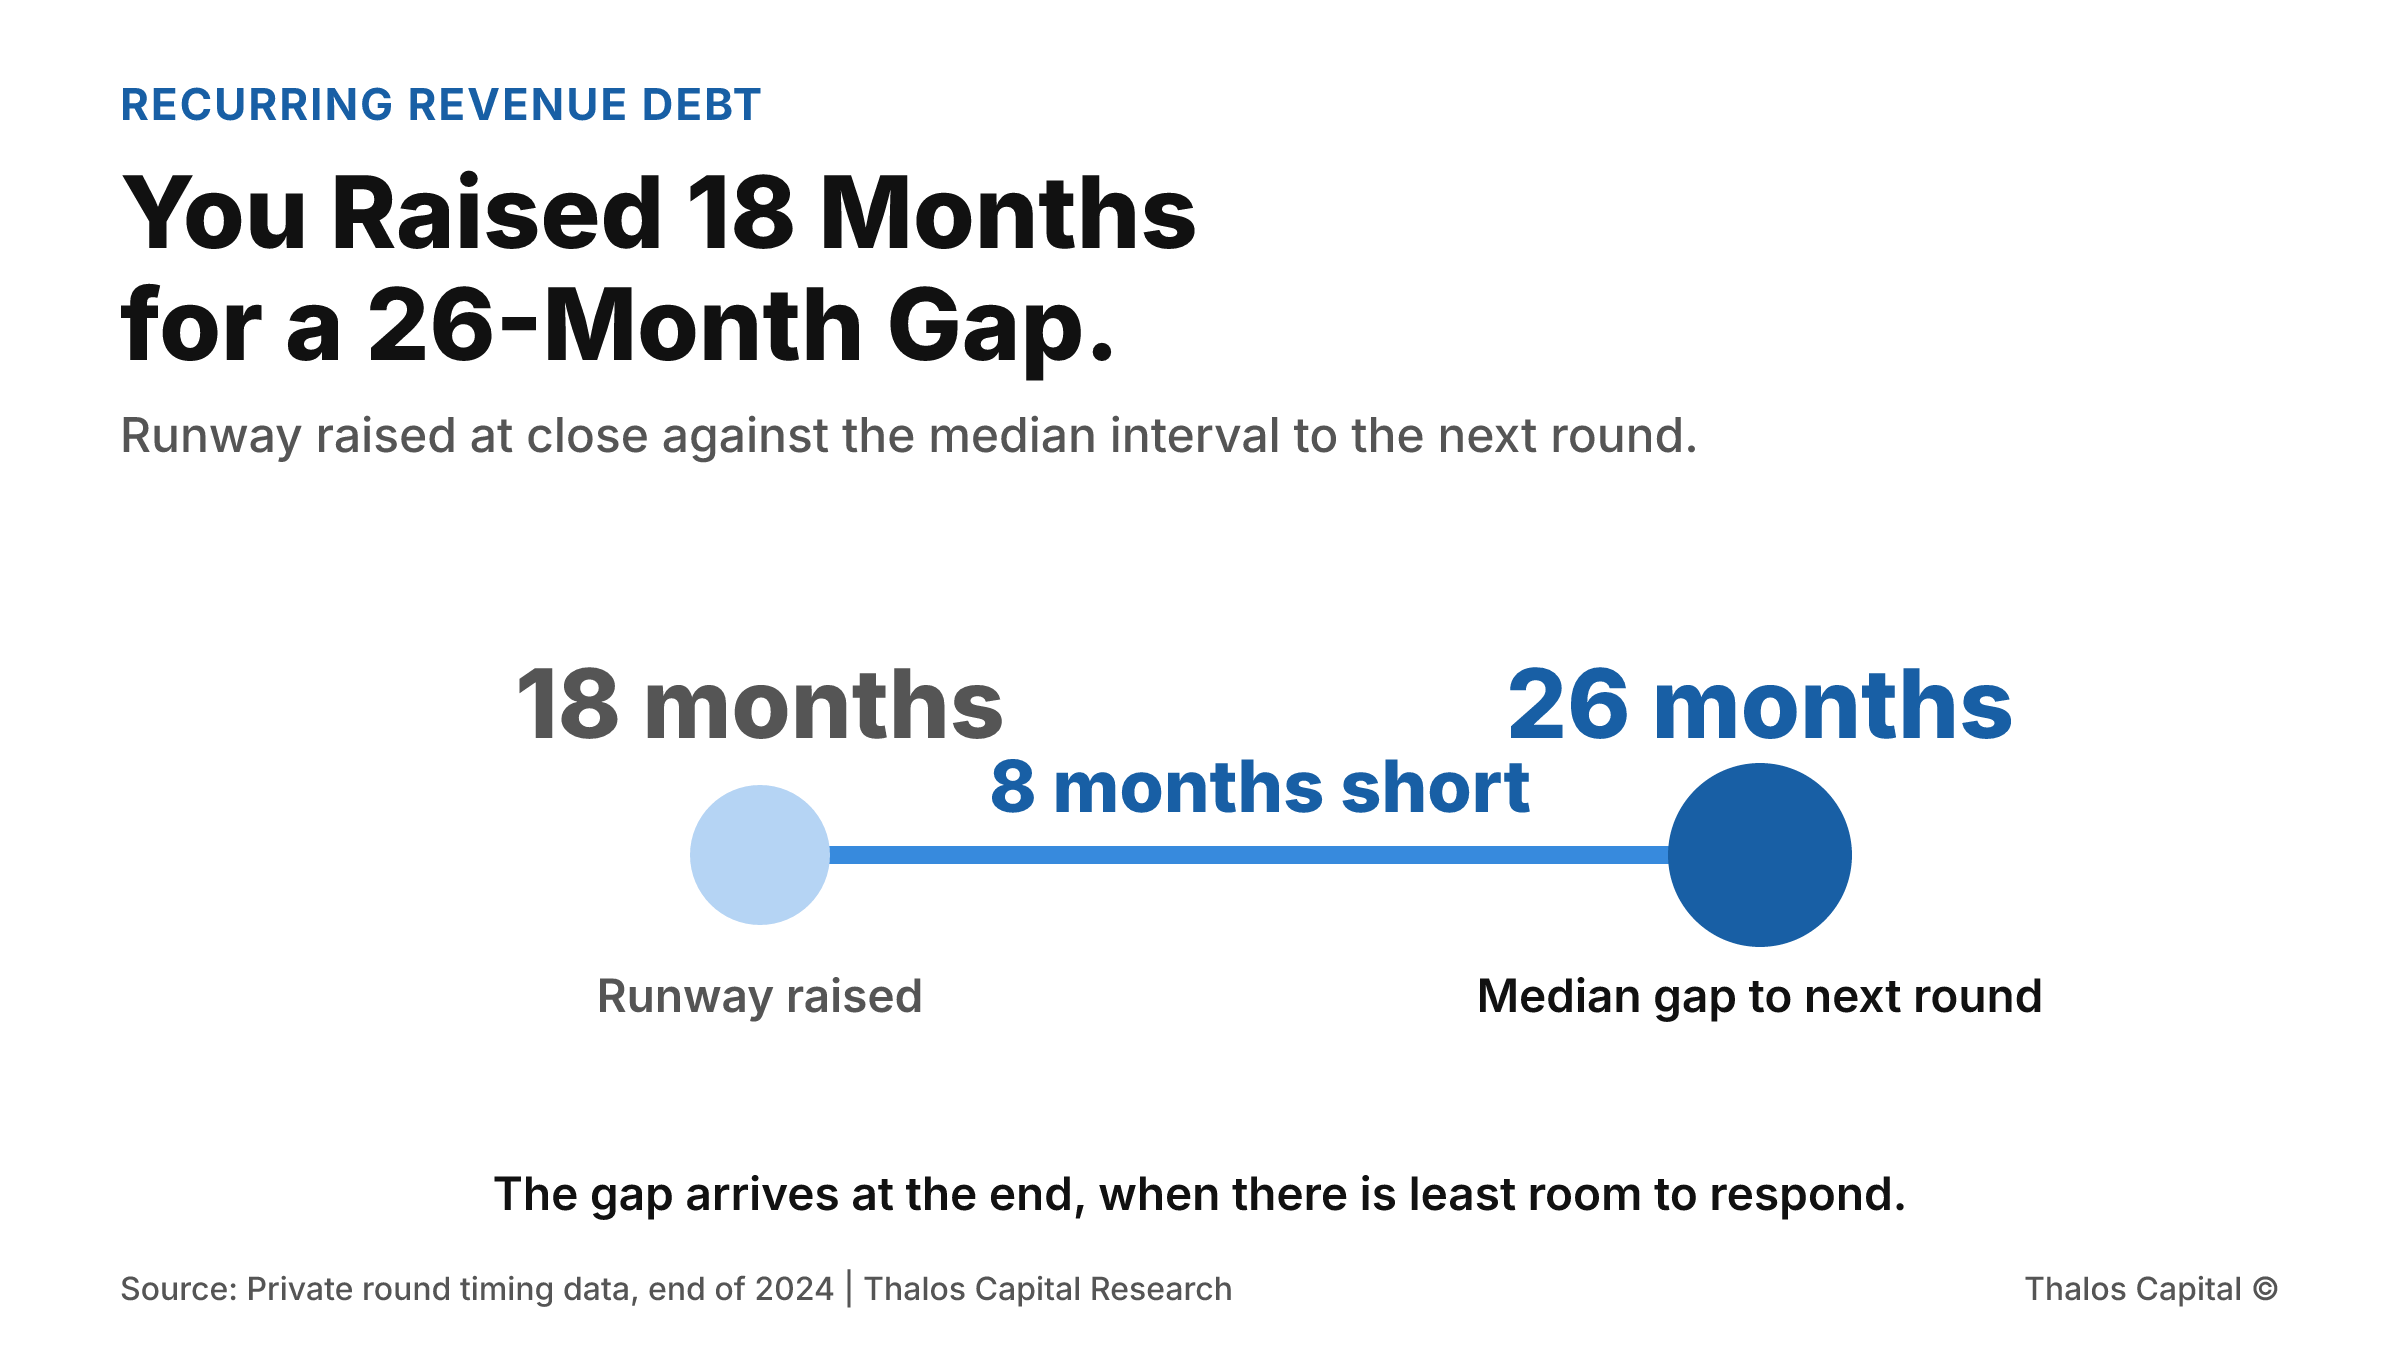
Two point range chart contrasting 18 months of runway raised at close against a median 26 month interval to the next round, with the eight month shortfall marked in navy.

You Raised 18 Months of Runway for a 26-Month Gap.

The median interval from seed to Series A has stretched to roughly 2.2 years. A company that closed with 18 months of cash is eight months short before it does anything wrong. What the decision looks like at month 10 against month 16.
Read More
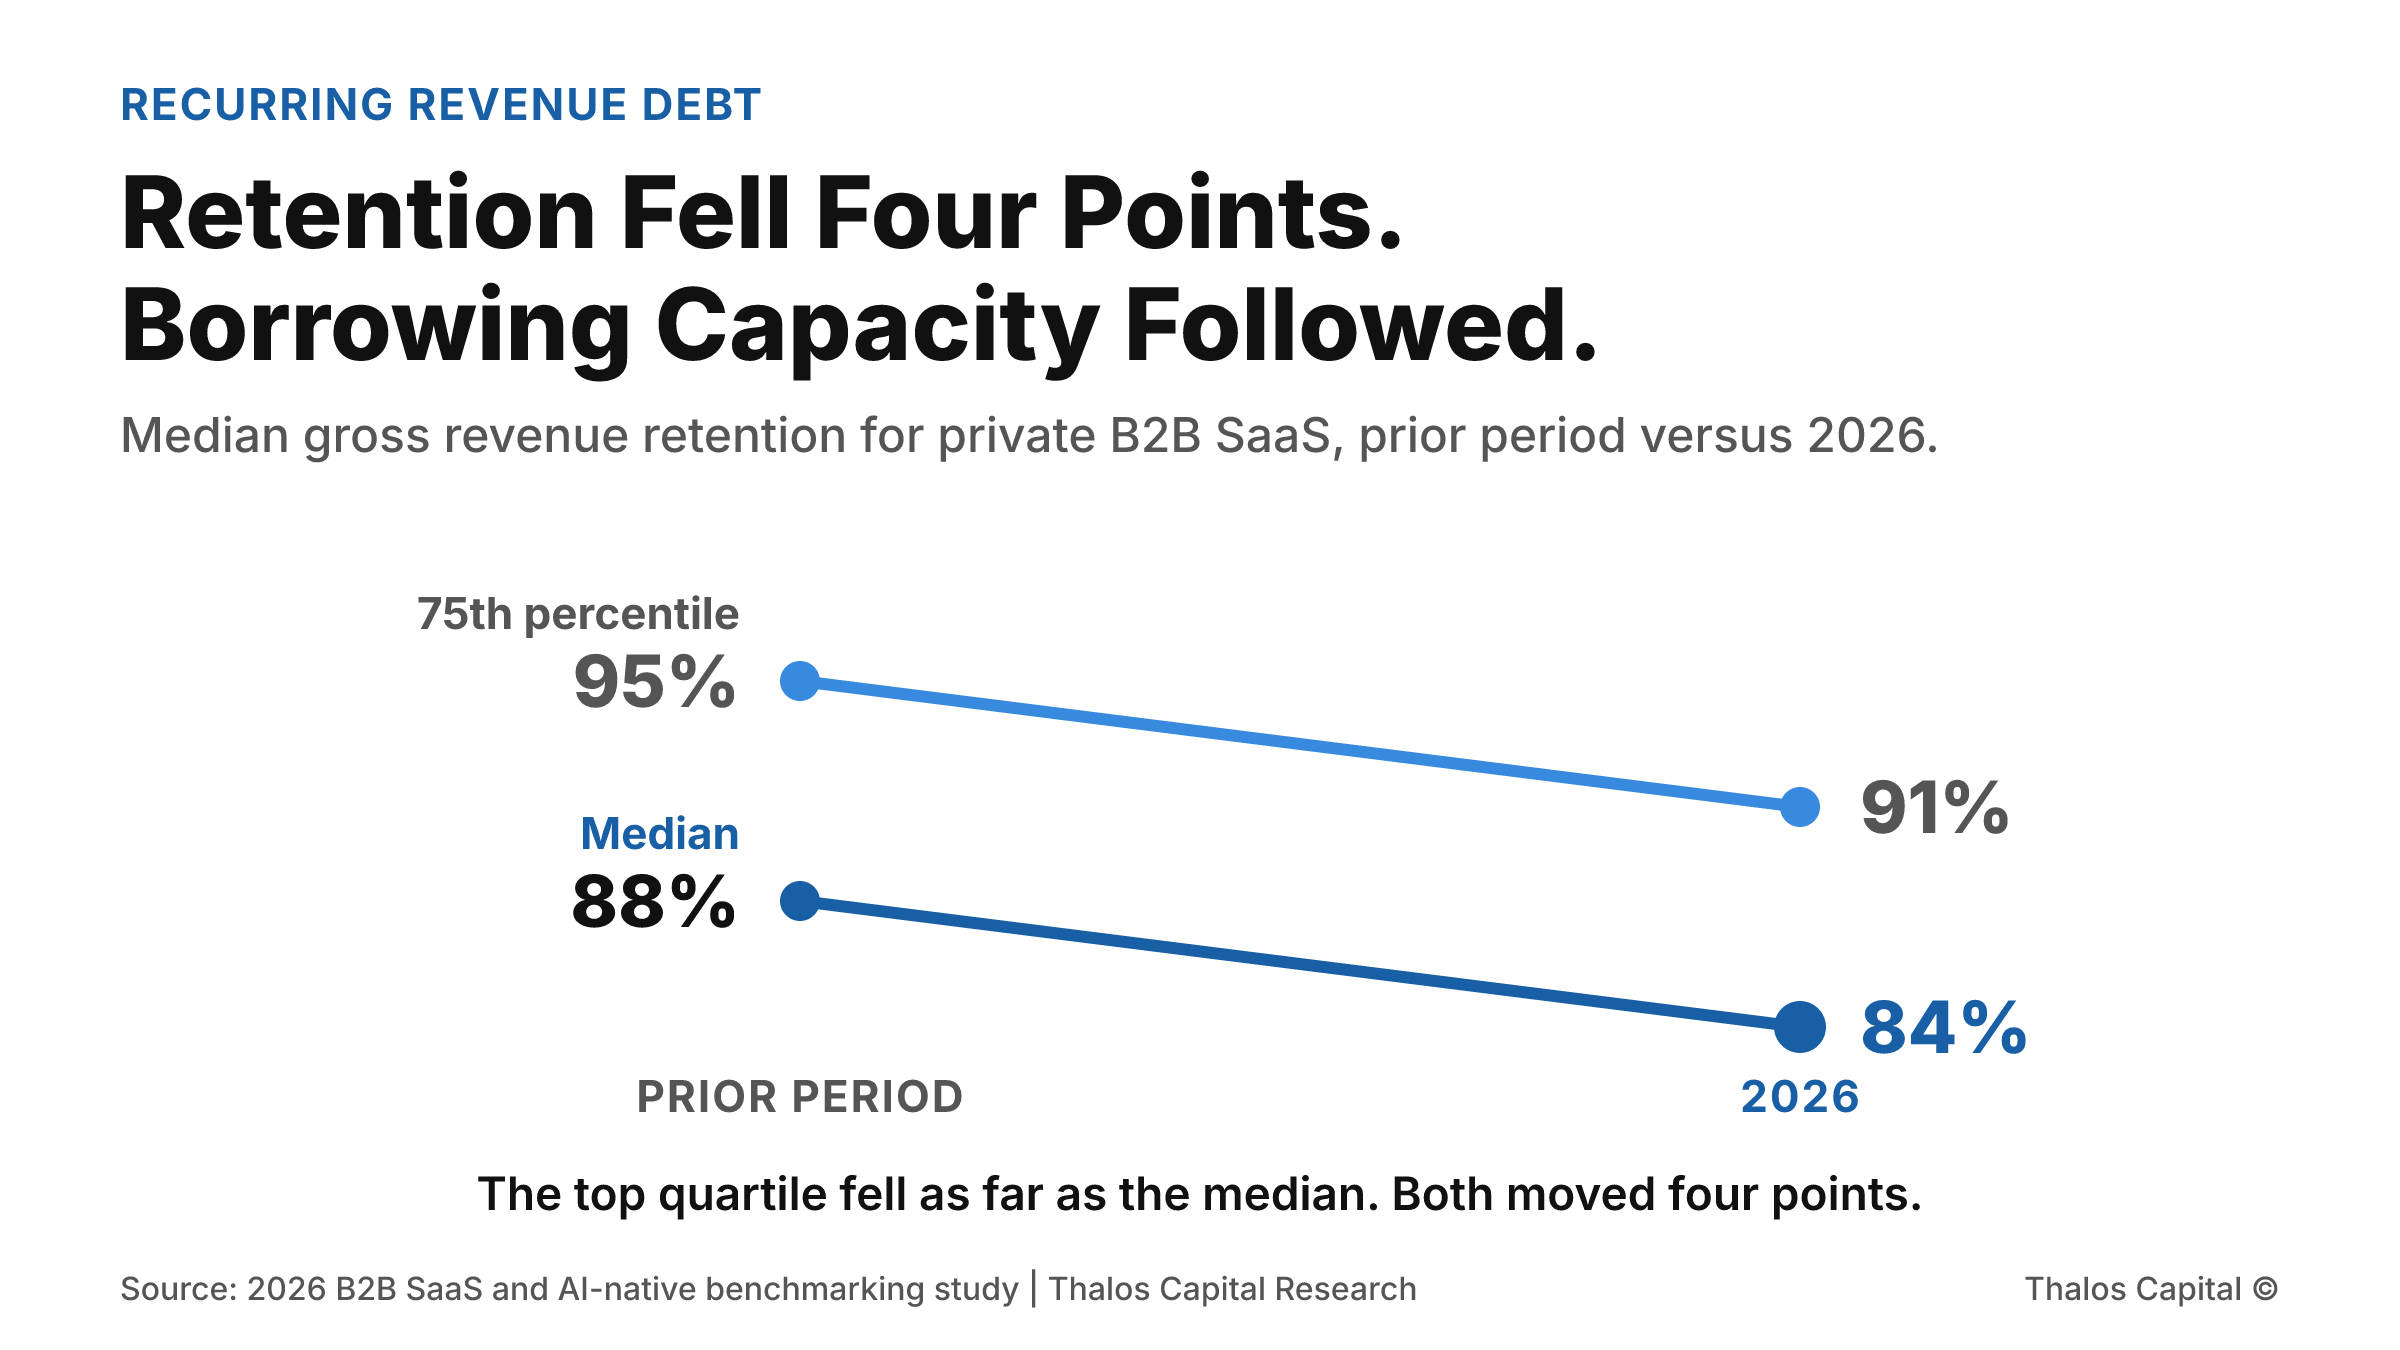
Slope chart comparing gross revenue retention for private B2B SaaS between the prior period and 2026, showing the median falling from 88 percent to 84 percent and the 75th percentile falling from 95 percent to 91 percent, both lines down four points.

Retention Fell Four Points. Your Borrowing Capacity Followed.

Median gross revenue retention for private B2B SaaS fell from 88 to 84 percent in 2026, and the top quartile fell just as far. For a company planning to borrow against contracted revenue, that four point move is a borrowing base question.
Read More
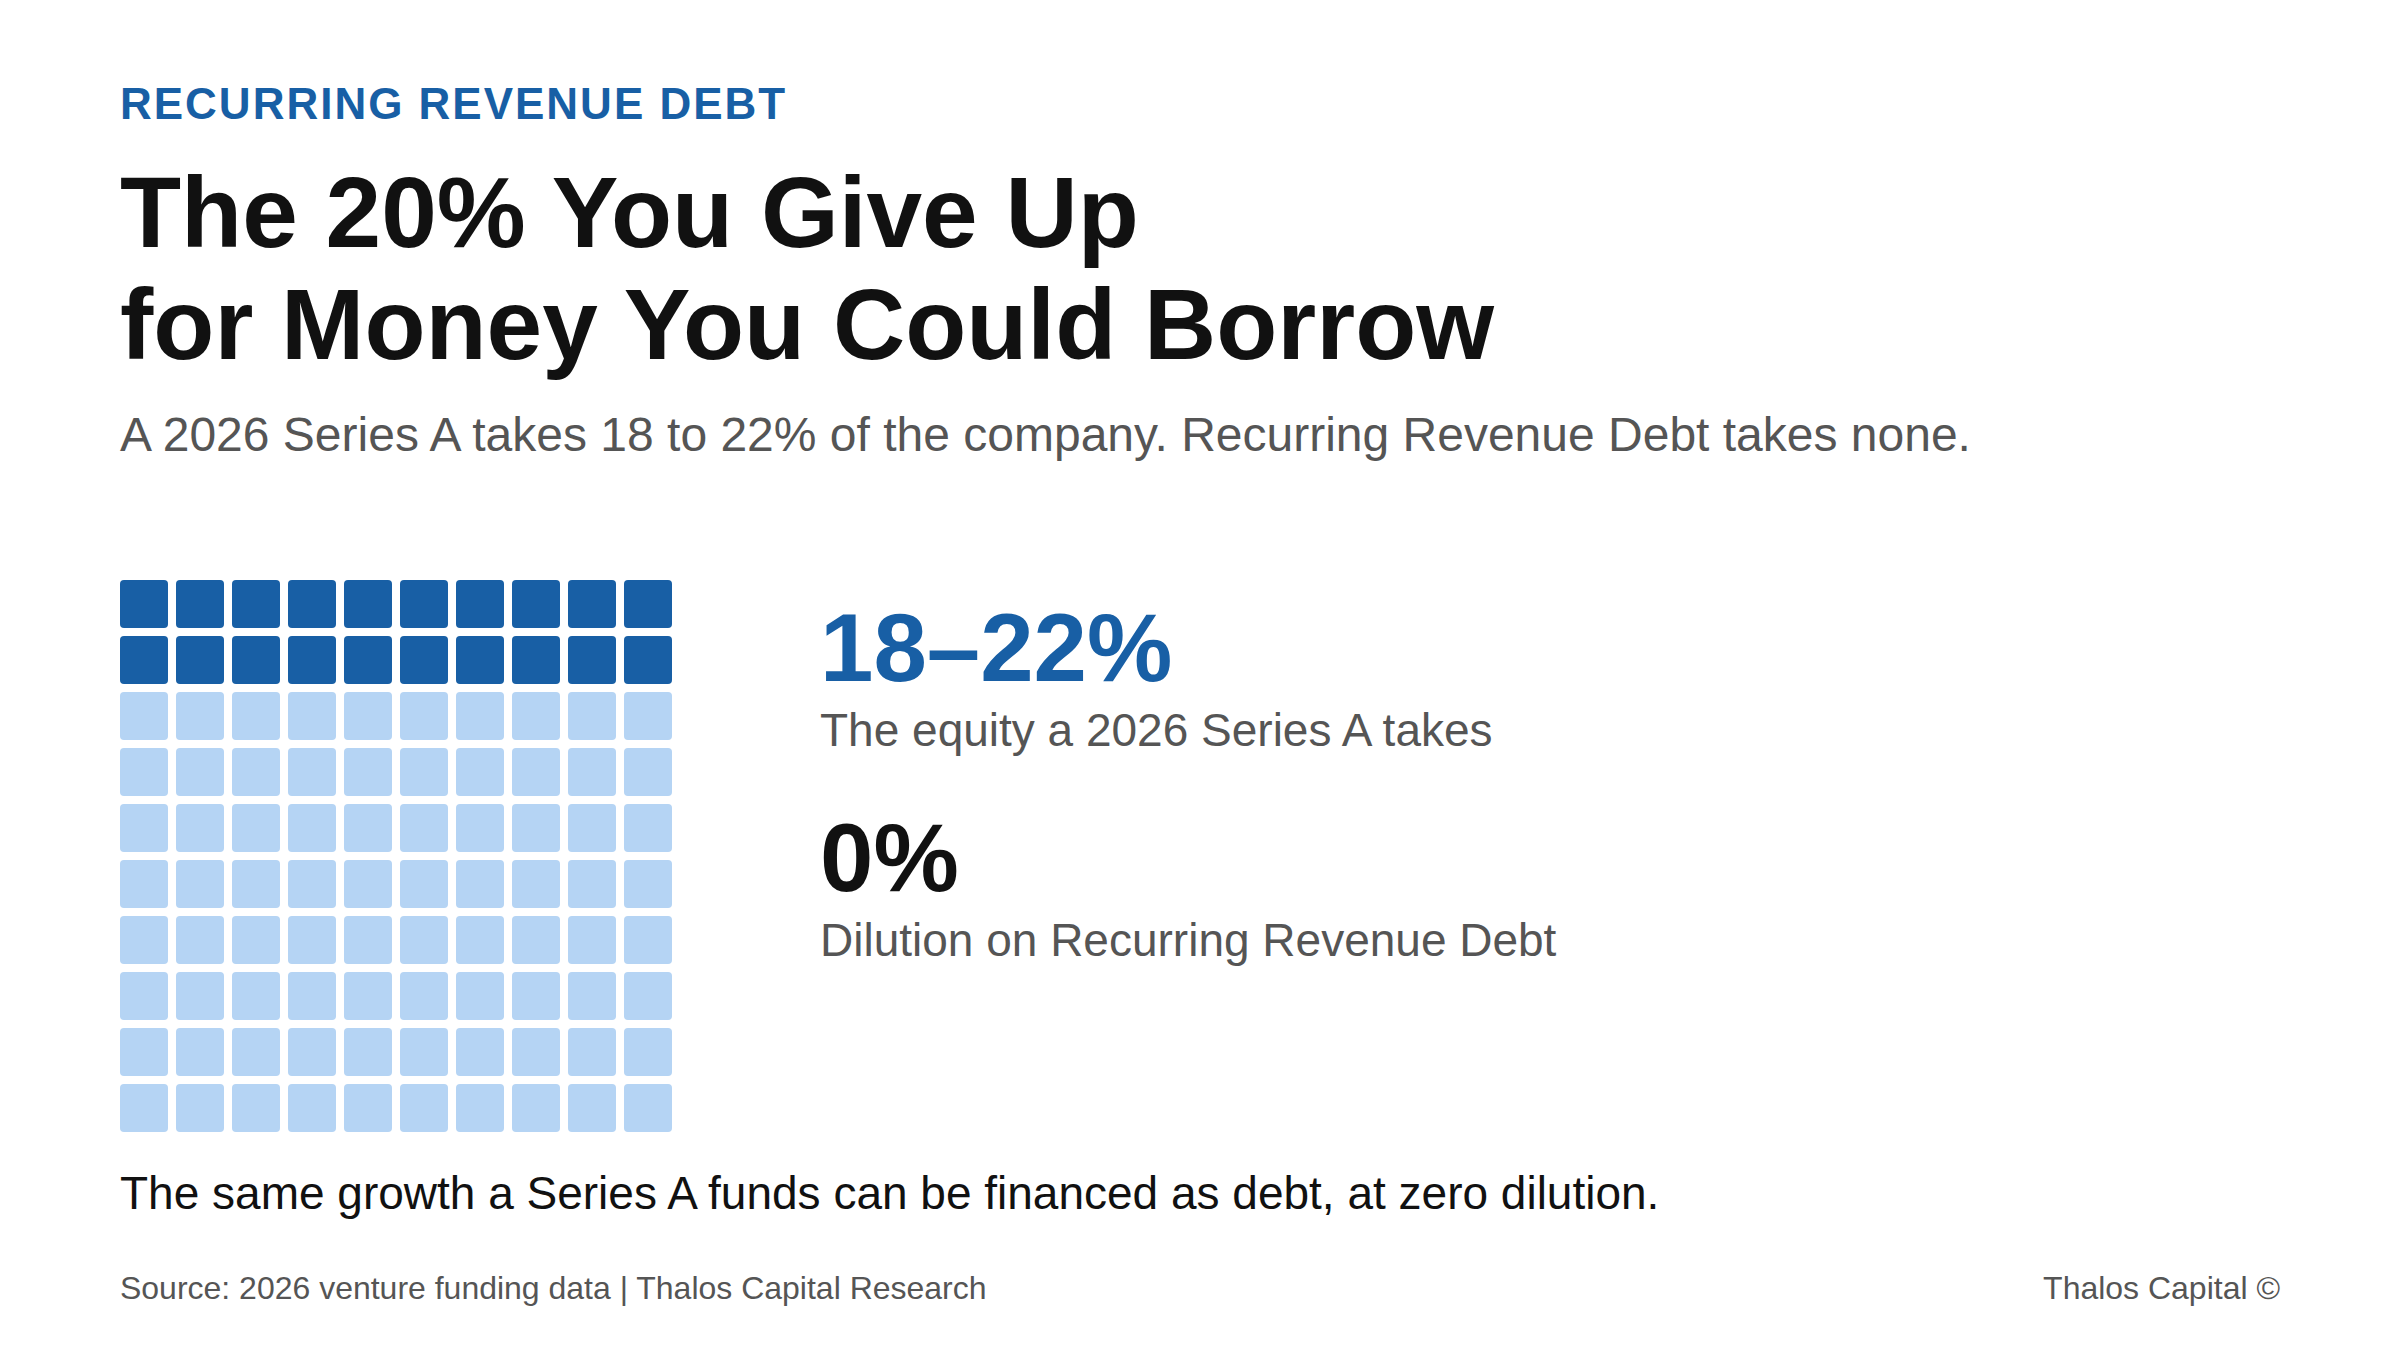
Waffle grid of 100 squares with 20 shaded navy, showing the 18 to 22 percent equity a 2026 Series A takes versus 0 percent dilution on Recurring Revenue Debt.

The 20% You Give Up for Money You Could Borrow: The Series A Math Founders Skip

A 2026 Series A takes 18 to 22% of the company at a reset valuation. For a recurring-revenue business that already clears the revenue bar, that dilution is a choice, not a requirement.
Read More
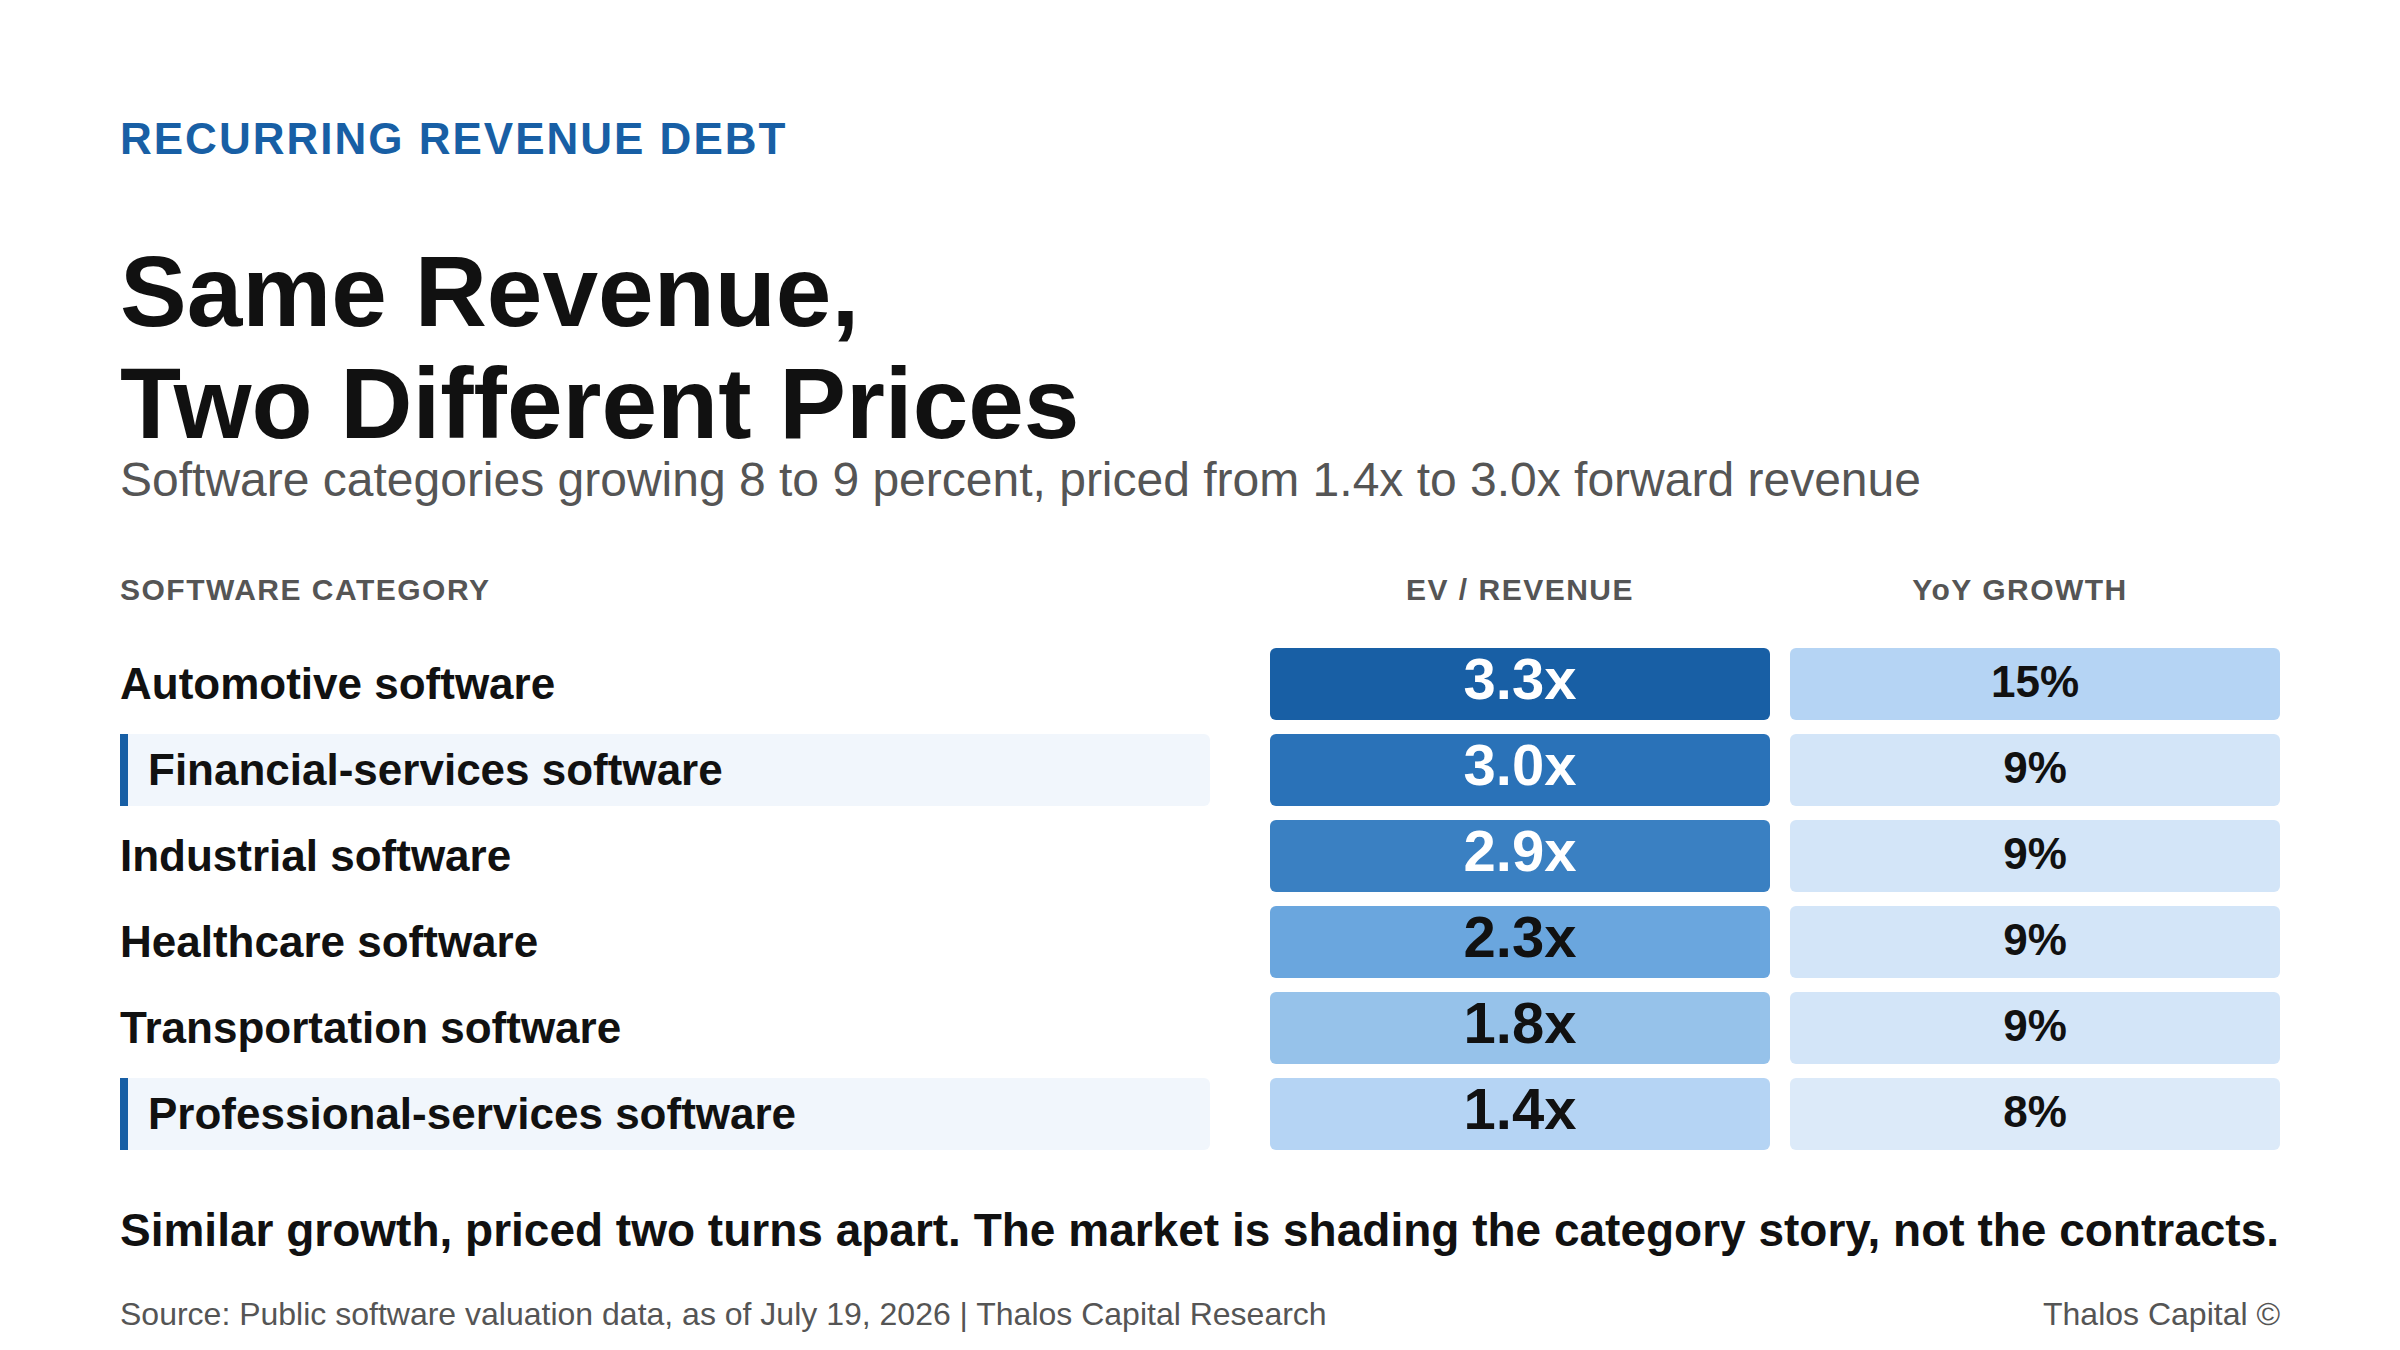
Shaded grid of software categories showing similar 8 to 9 percent revenue growth priced from 1.4x to 3.0x forward revenue as of July 19, 2026.

Two Companies, the Same $6M ARR, Priced Two Turns Apart: The Gap Is Narrative, Not Revenue

Two software companies at the same $6M ARR can be priced two turns of revenue apart on category narrative alone. Here is what that gap costs in dilution, and the non-dilutive debt alternative.
Read More
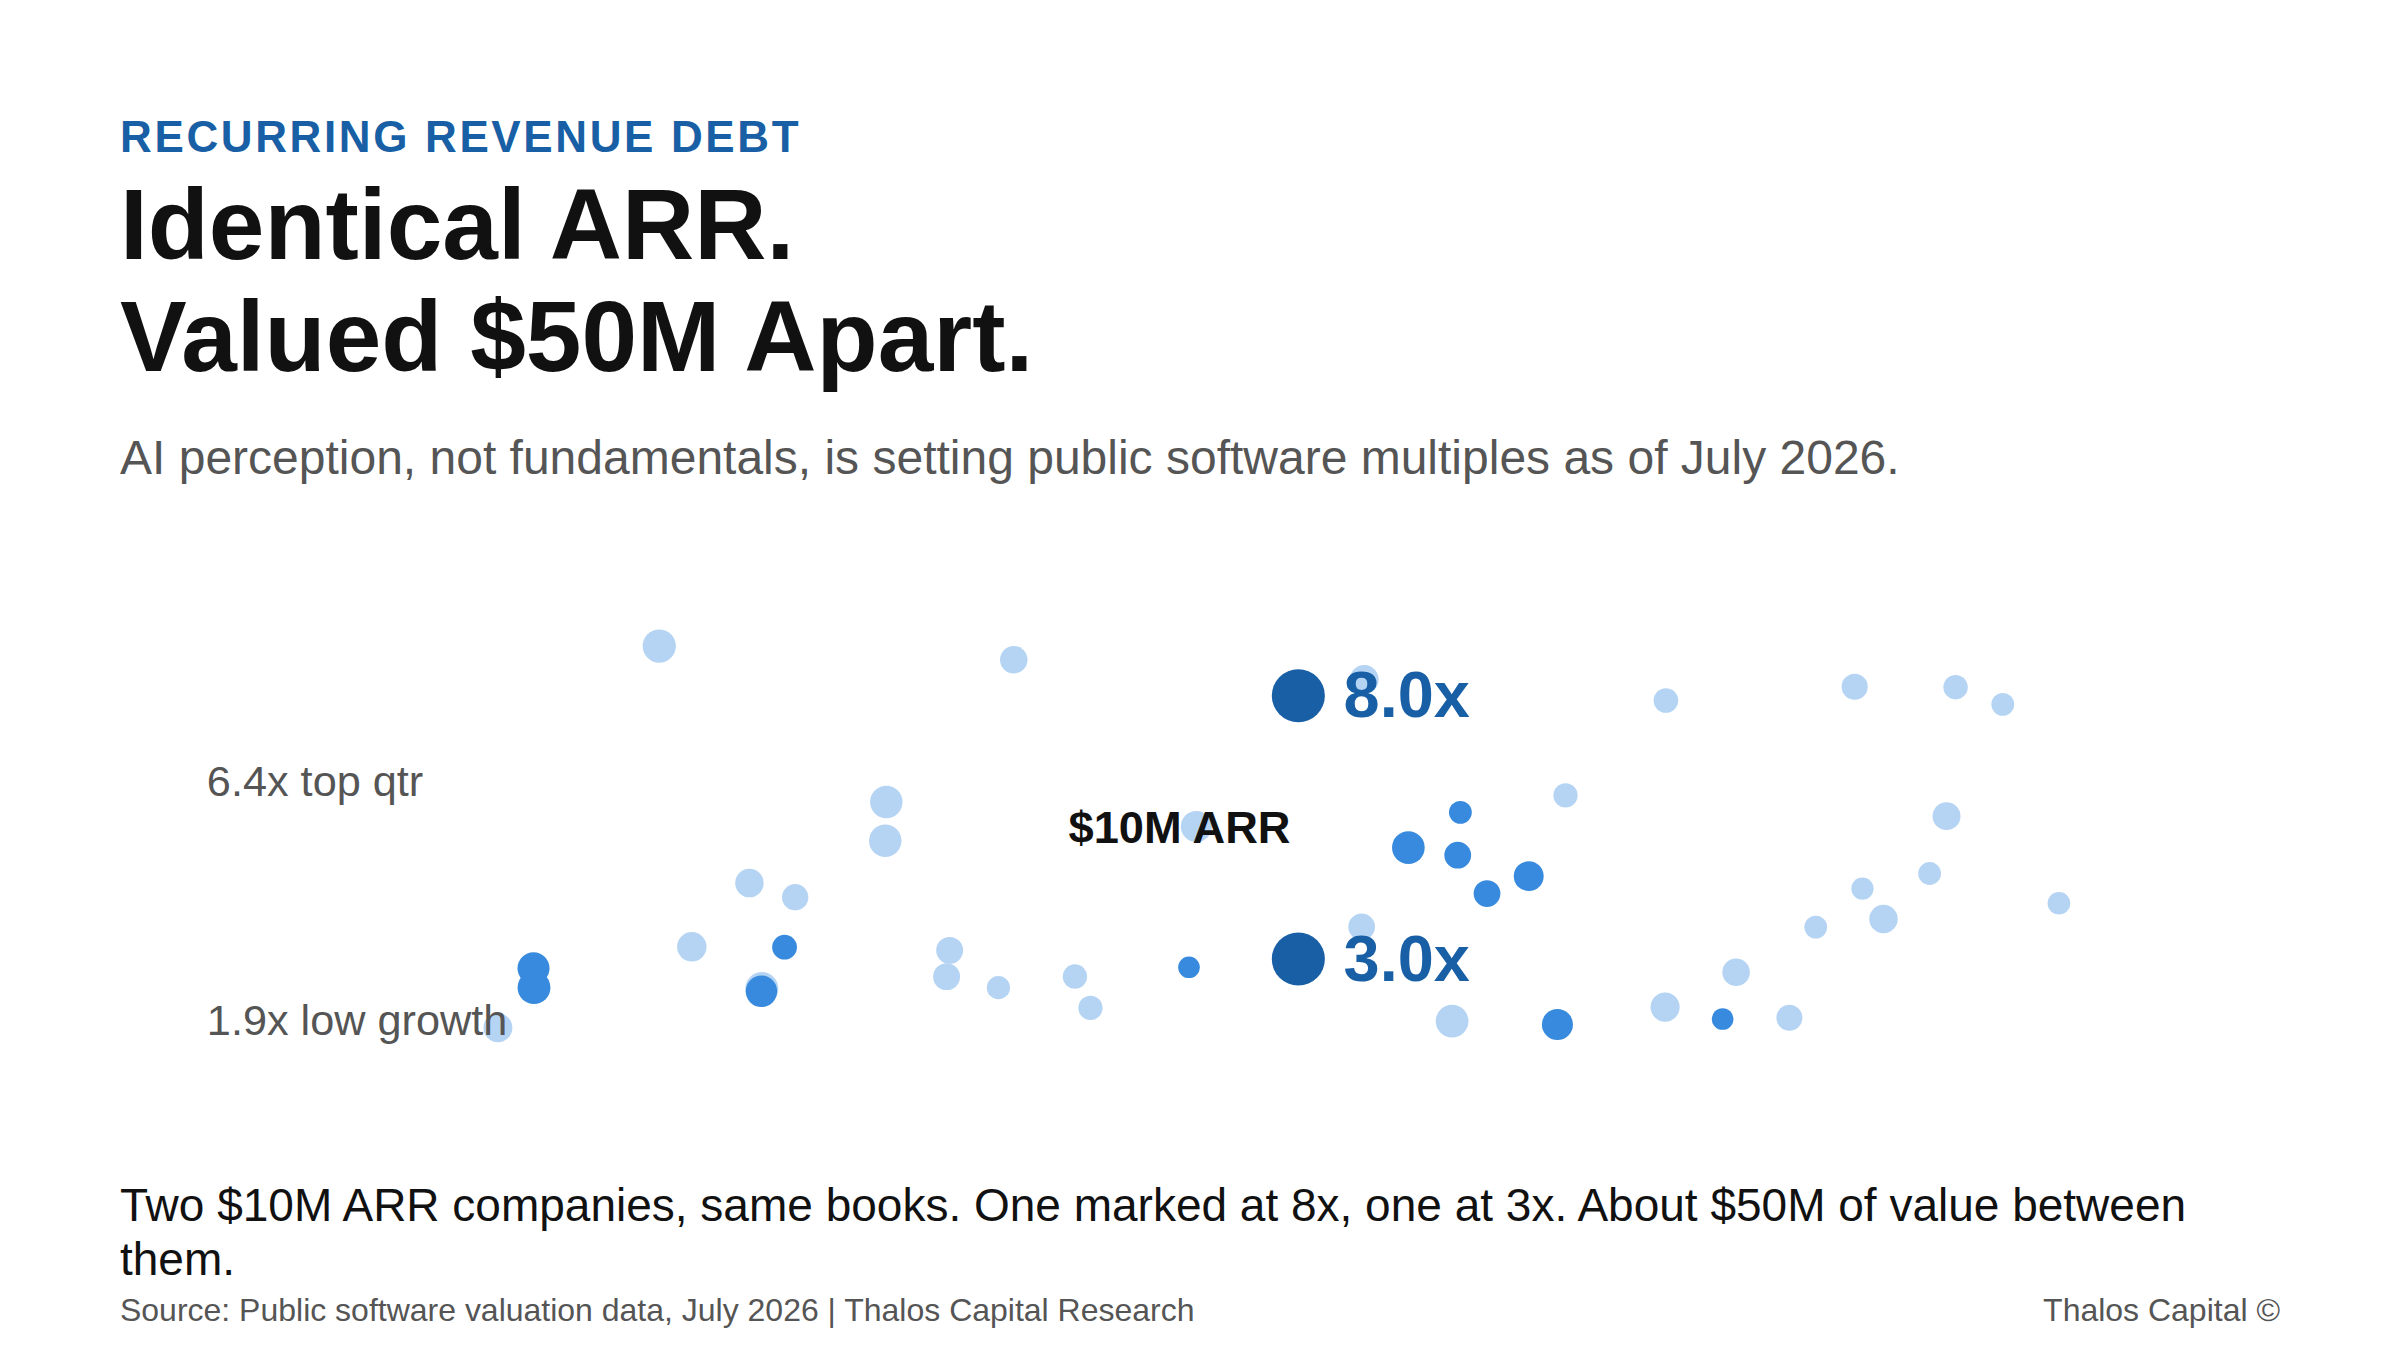
Scatter plot of public SaaS revenue multiples as of July 2026, highlighting two companies with identical $10M ARR marked at 8x and 3x revenue.

AI Perception Is Setting Software Valuations. It Is Not Setting Your Credit.

As of July 2026, AI perception sets software valuations more than fundamentals do. Two identical-ARR companies can be marked $50M apart. A lender reads your contracts, not your narrative.
Read More
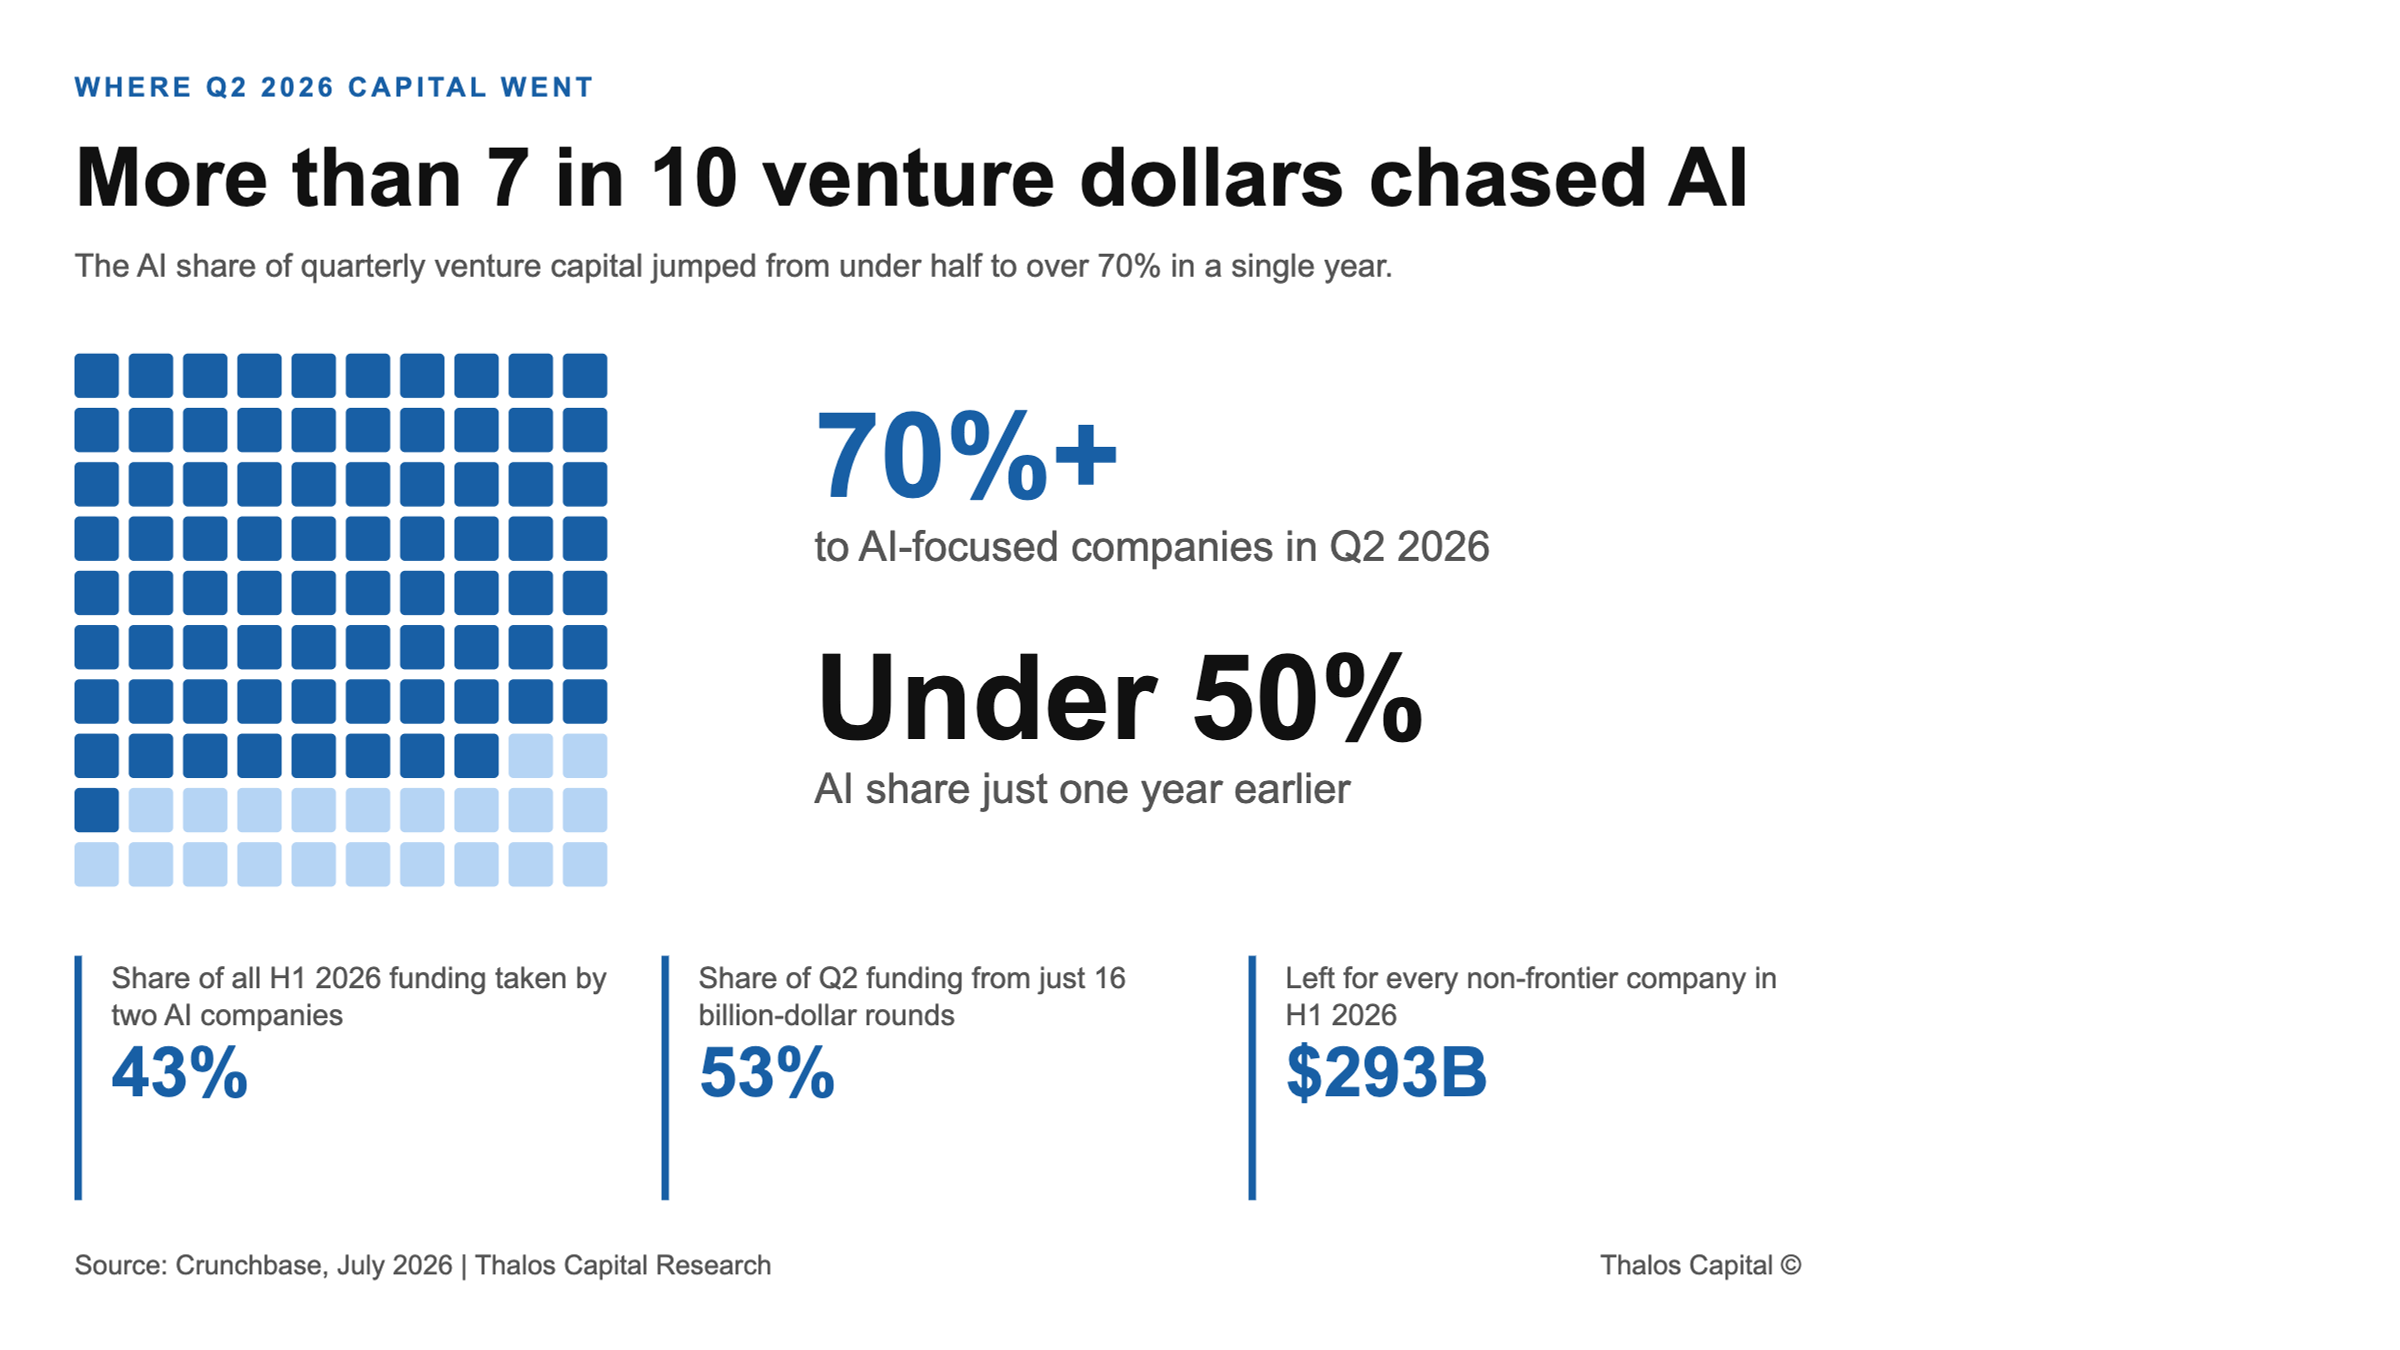
Waffle chart of 100 squares showing more than 70% of Q2 2026 venture capital going to AI-focused companies, up from under 50% a year earlier, with 43% of all H1 2026 funding taken by two AI companies and $293B left for every other company.

The Record Funding Year Is Not Funding You

Venture funding hit a record $510B in H1 2026, but 43% went to two AI companies. Why recurring-revenue tech founders are misreading the headline, and the non-dilutive alternative.
Read More
Working through a financing decision?
Insights are a starting point. A conversation maps your actual options.
Tell us what you are financing and we will map the structures and sources that fit.
Submit your financing request →
Explore our financing solutions
Equipment FinancingWorking CapitalAsset-Based LendingStrategic Debt