Tag

non-dilutive debt

6 insights

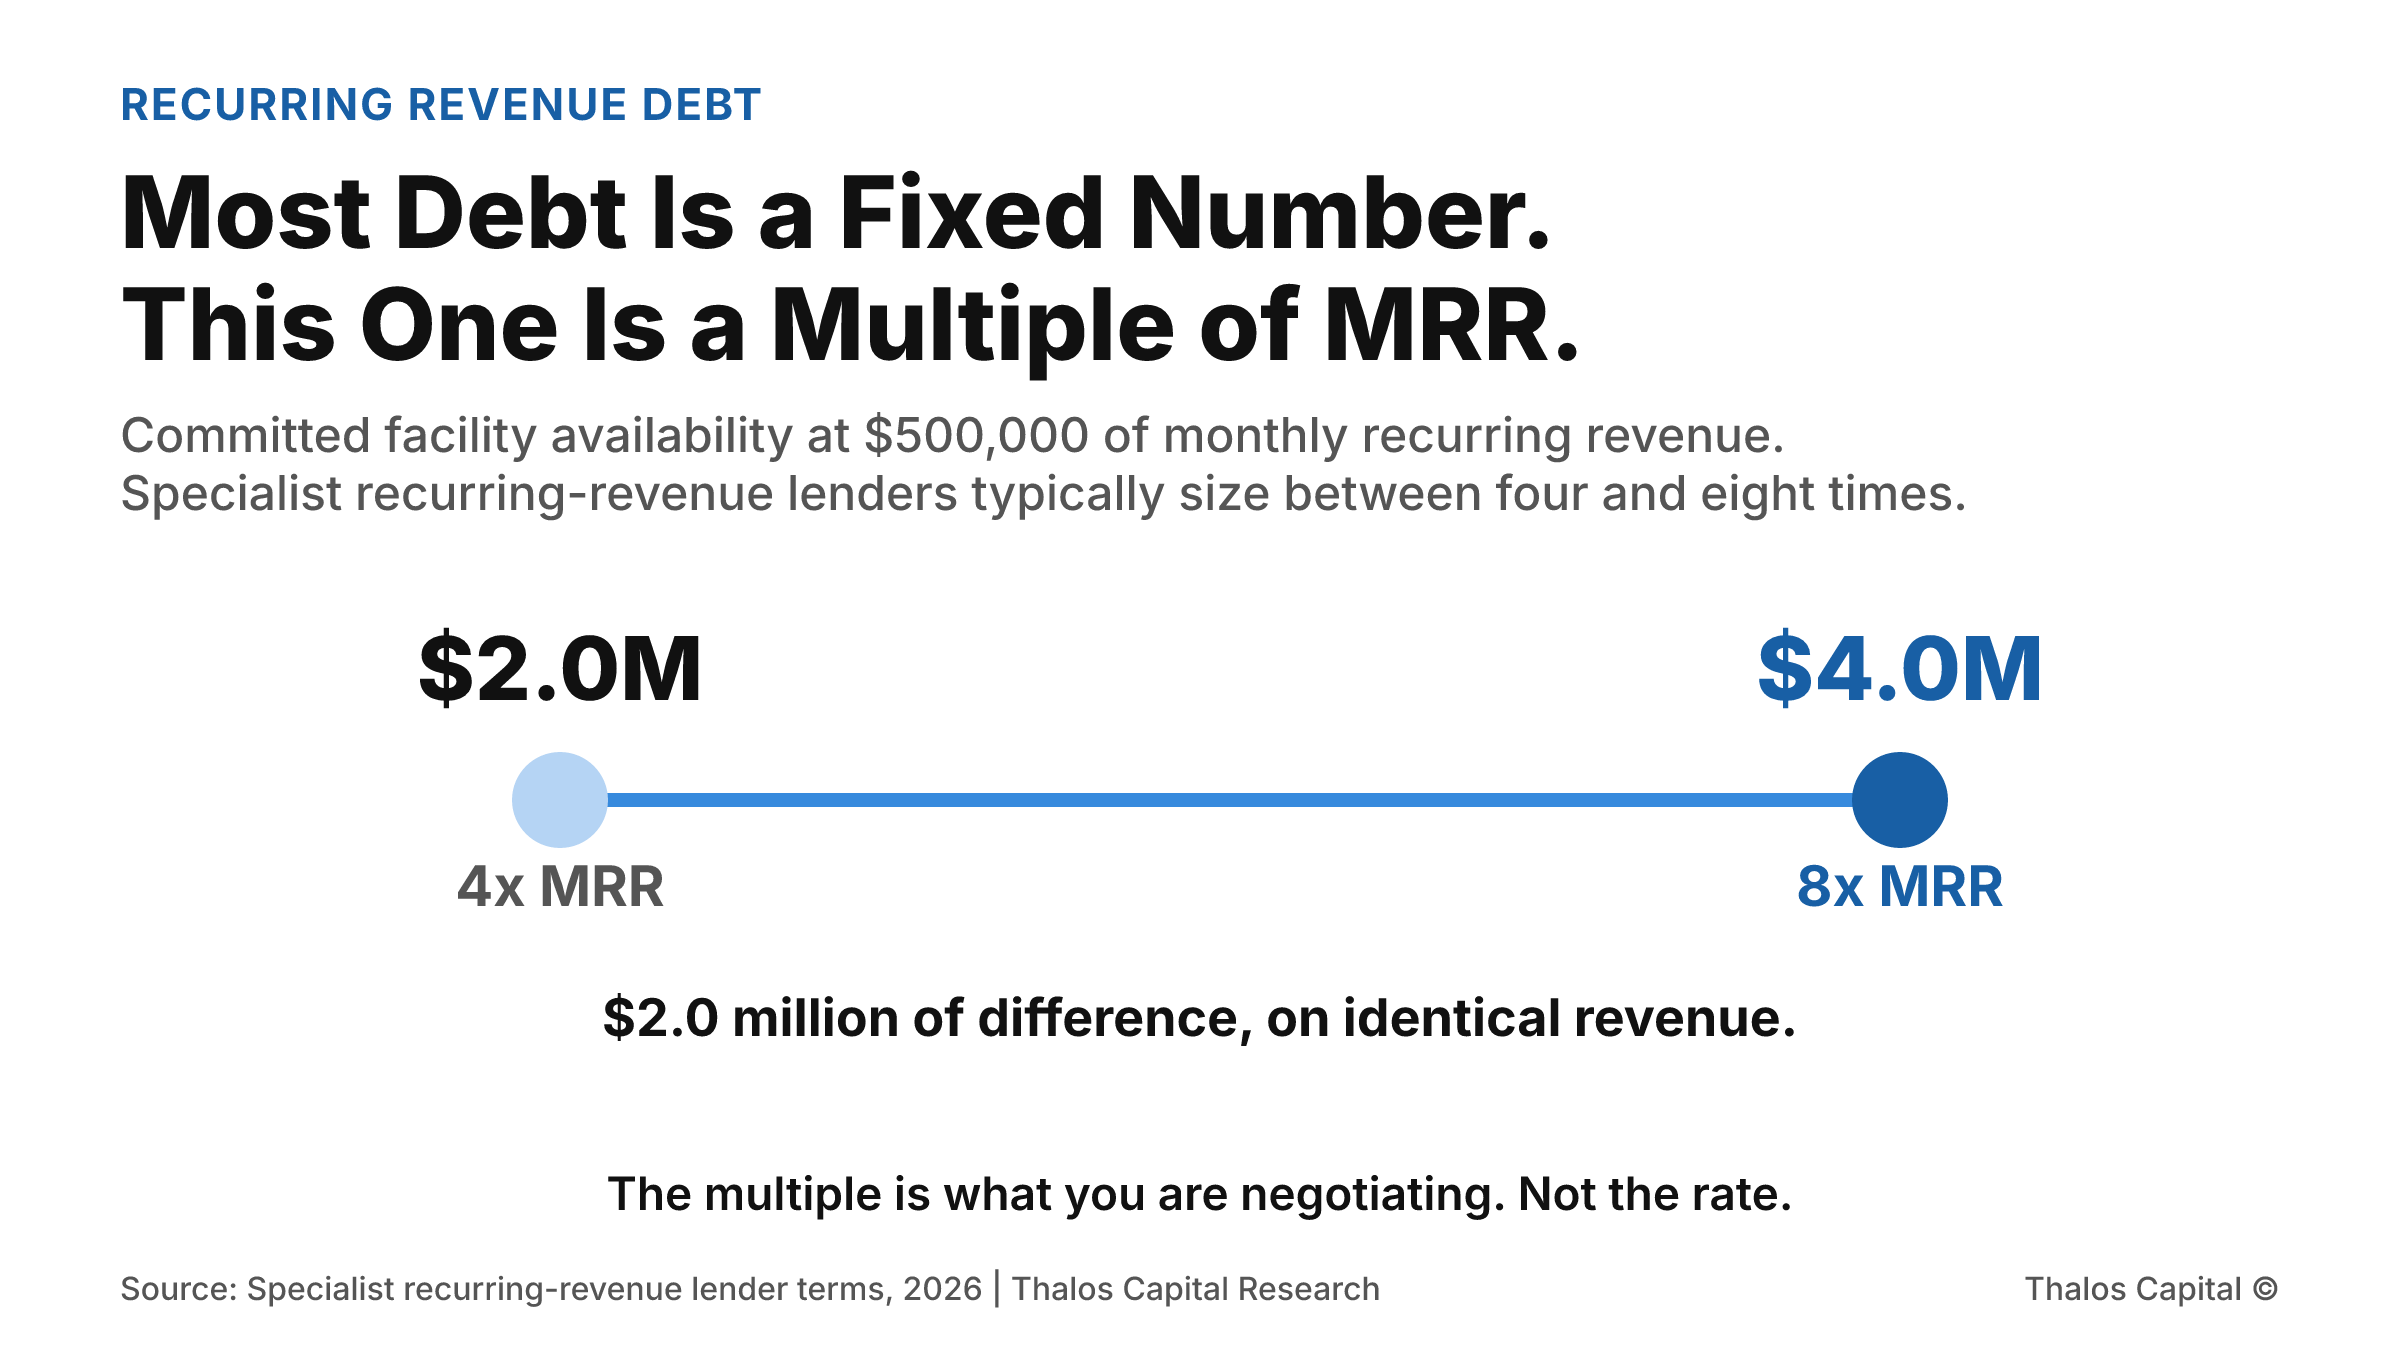
A two-point range showing that a company at $500,000 of monthly recurring revenue can access $2.0 million at a four times multiple or $4.0 million at eight times, a $2.0 million spread on identical revenue.

Most Debt Is a Fixed Number. This One Is a Multiple of MRR.

A term loan is sized once and never changes. A committed facility against recurring revenue is sized as a multiple of monthly revenue, and availability rises as that revenue rises, without a second underwriting.
Read More
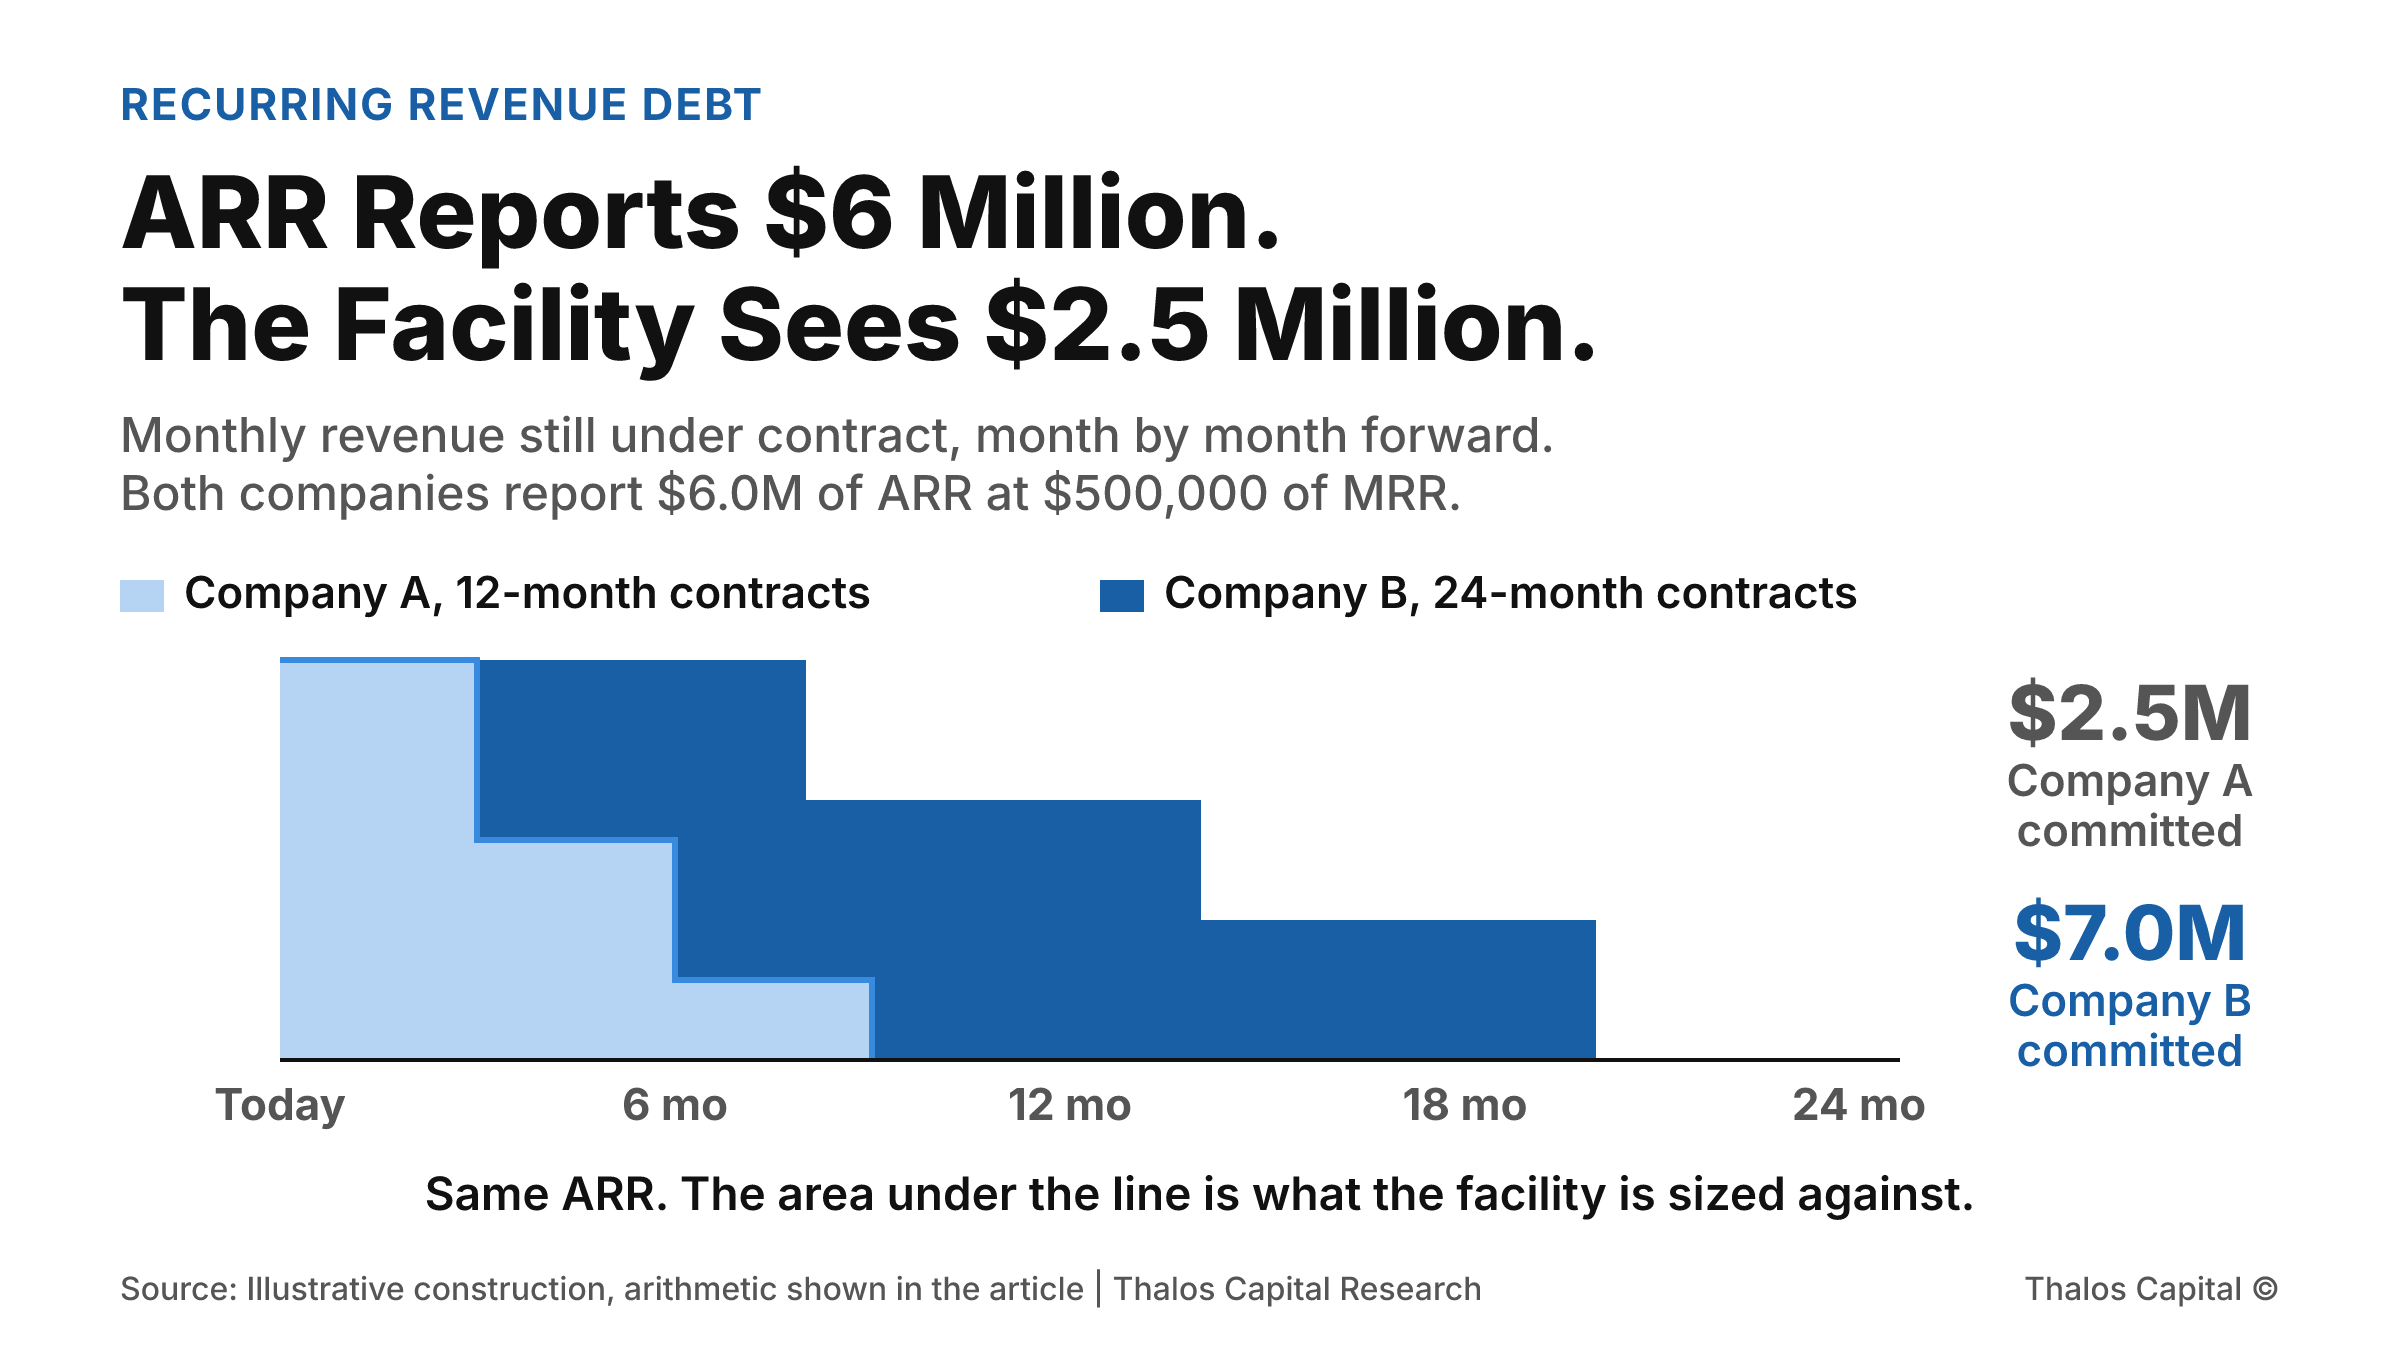
Two stepped areas showing monthly revenue still under contract over the next 24 months for two companies with identical $6.0 million ARR: a 12-month contract book holding $2.5 million of remaining contracted value and a 24-month contract book holding $7.0 million.

ARR Reports $6 Million. The Facility Sees $2.5 Million.

Two recurring-revenue companies each report $6.0 million of ARR. One is offered a $2.0 million facility and the other $1.0 million. The difference is contract length, and it does not appear in any metric either company reports.
Read More
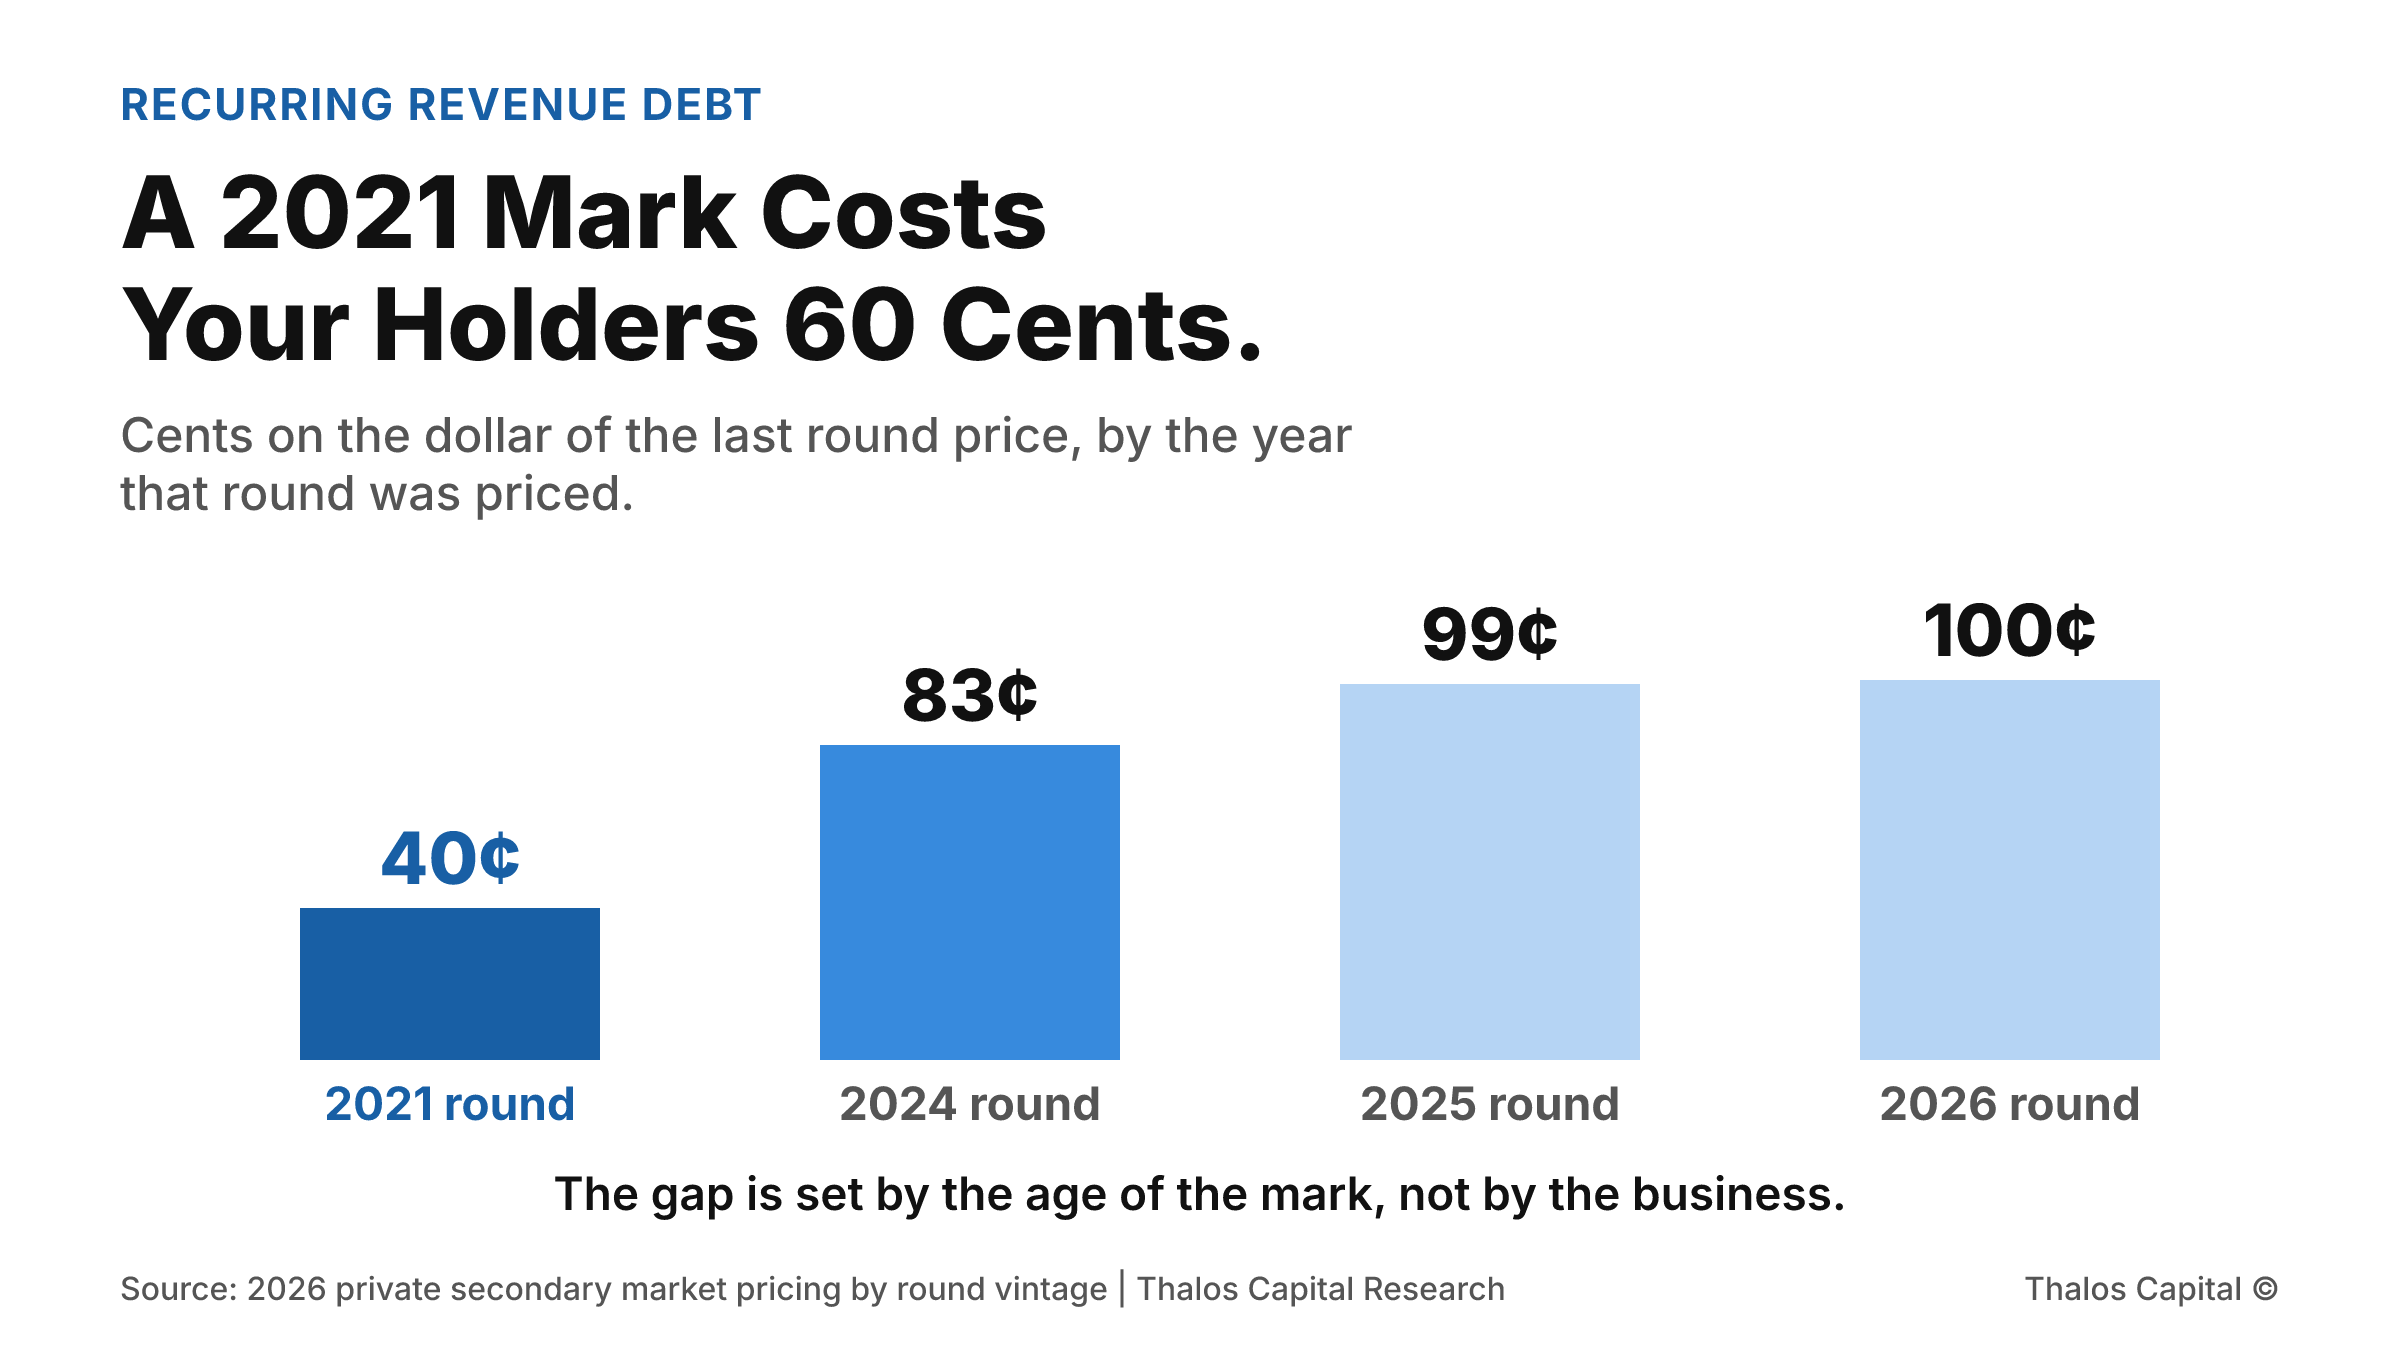
Column chart of what private shares fetch as cents on the dollar of the last round price, by the year that round was priced: about 40 cents for a 2021 mark shown in the darkest navy, 83 cents for 2024, 99 cents for 2025 and 100 cents for 2026.

A 2021 Mark Costs Your Holders 60 Cents.

Private shares trade below the last round price, and how far below depends on when that round was priced. A 2021 mark trades around 60 percent under. A 2025 mark trades around 1 percent under. What that costs an early holder.
Read More
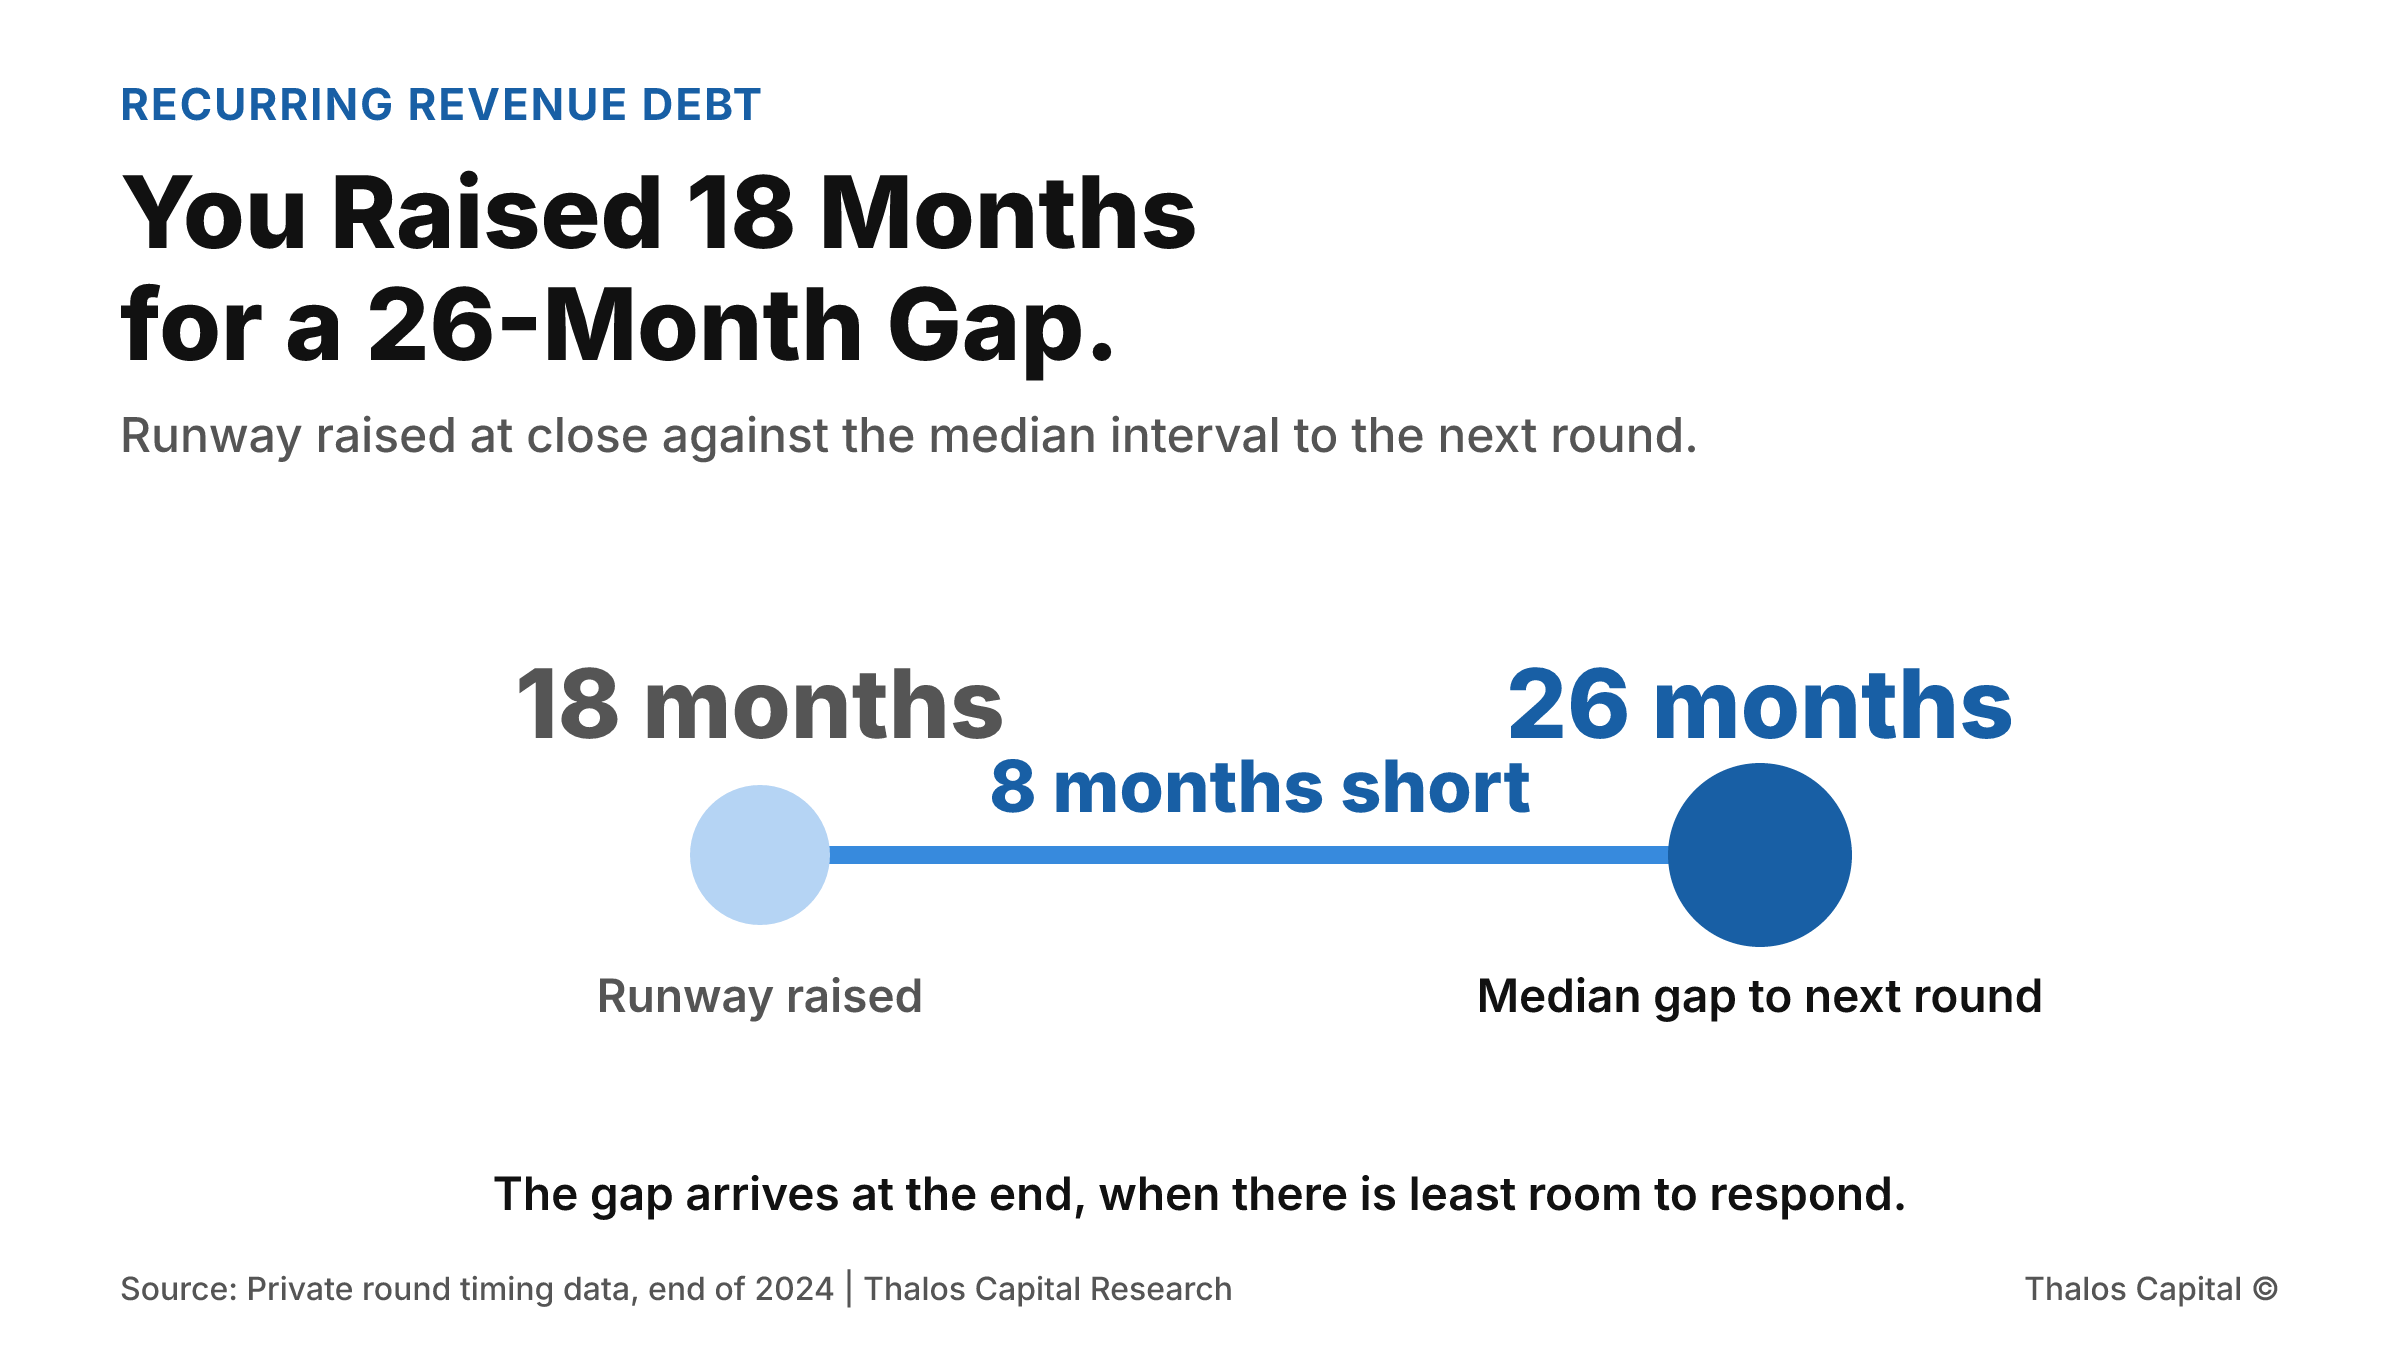
Two point range chart contrasting 18 months of runway raised at close against a median 26 month interval to the next round, with the eight month shortfall marked in navy.

You Raised 18 Months of Runway for a 26-Month Gap.

The median interval from seed to Series A has stretched to roughly 2.2 years. A company that closed with 18 months of cash is eight months short before it does anything wrong. What the decision looks like at month 10 against month 16.
Read More
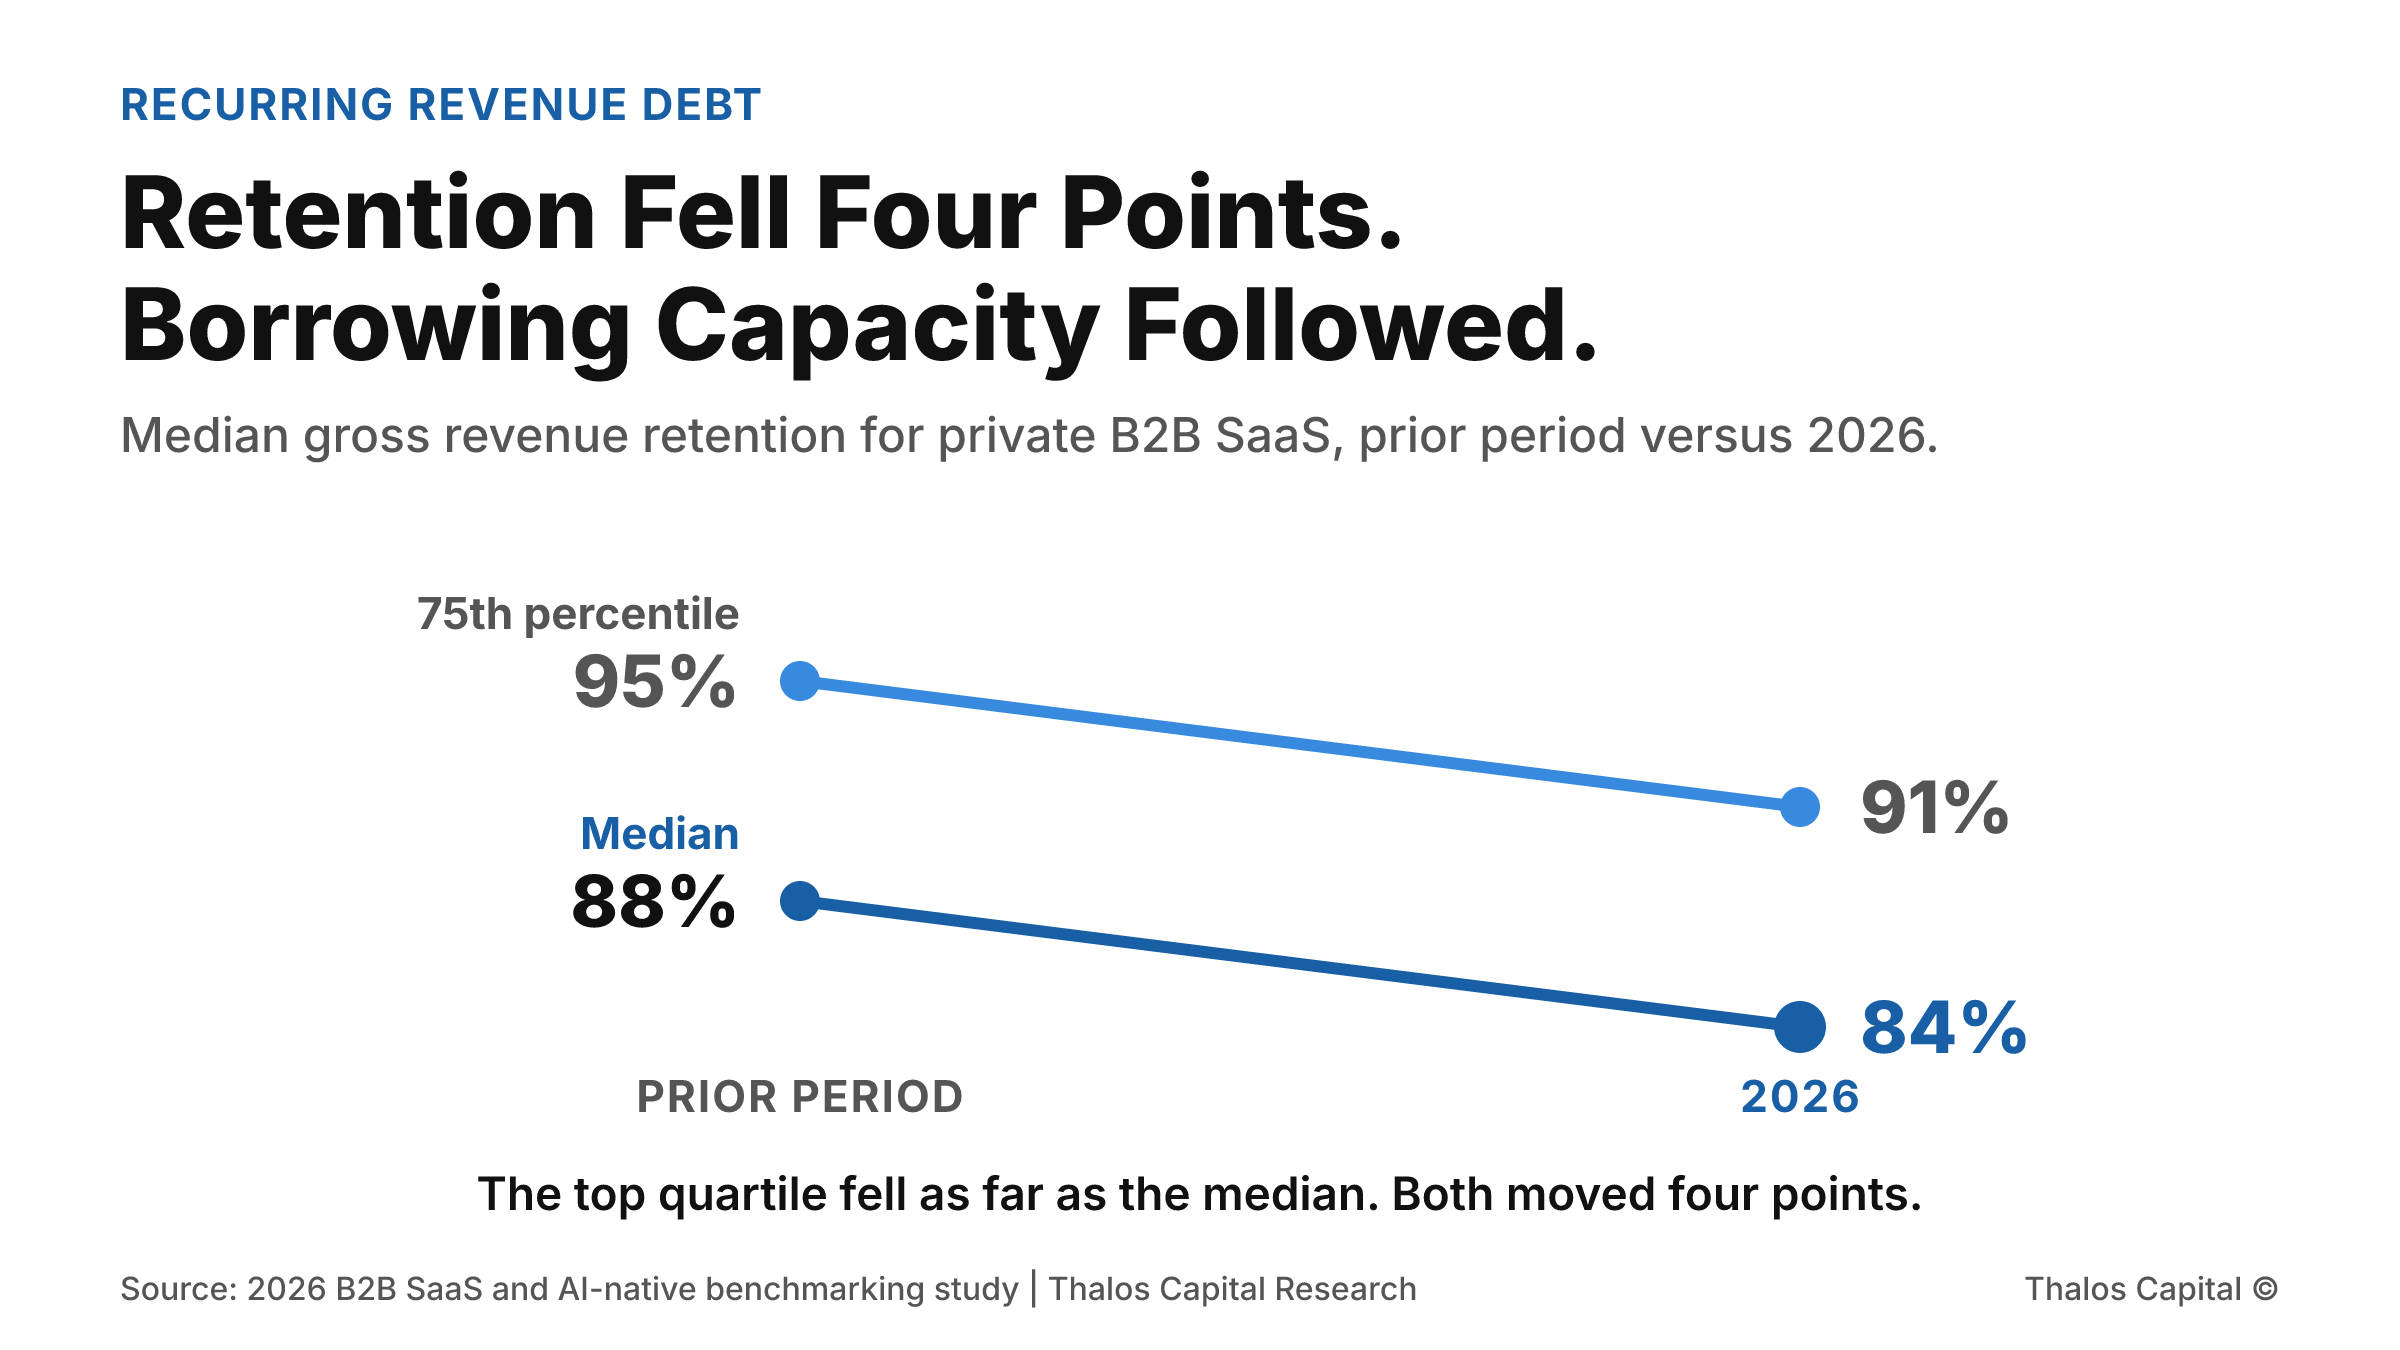
Slope chart comparing gross revenue retention for private B2B SaaS between the prior period and 2026, showing the median falling from 88 percent to 84 percent and the 75th percentile falling from 95 percent to 91 percent, both lines down four points.

Retention Fell Four Points. Your Borrowing Capacity Followed.

Median gross revenue retention for private B2B SaaS fell from 88 to 84 percent in 2026, and the top quartile fell just as far. For a company planning to borrow against contracted revenue, that four point move is a borrowing base question.
Read More
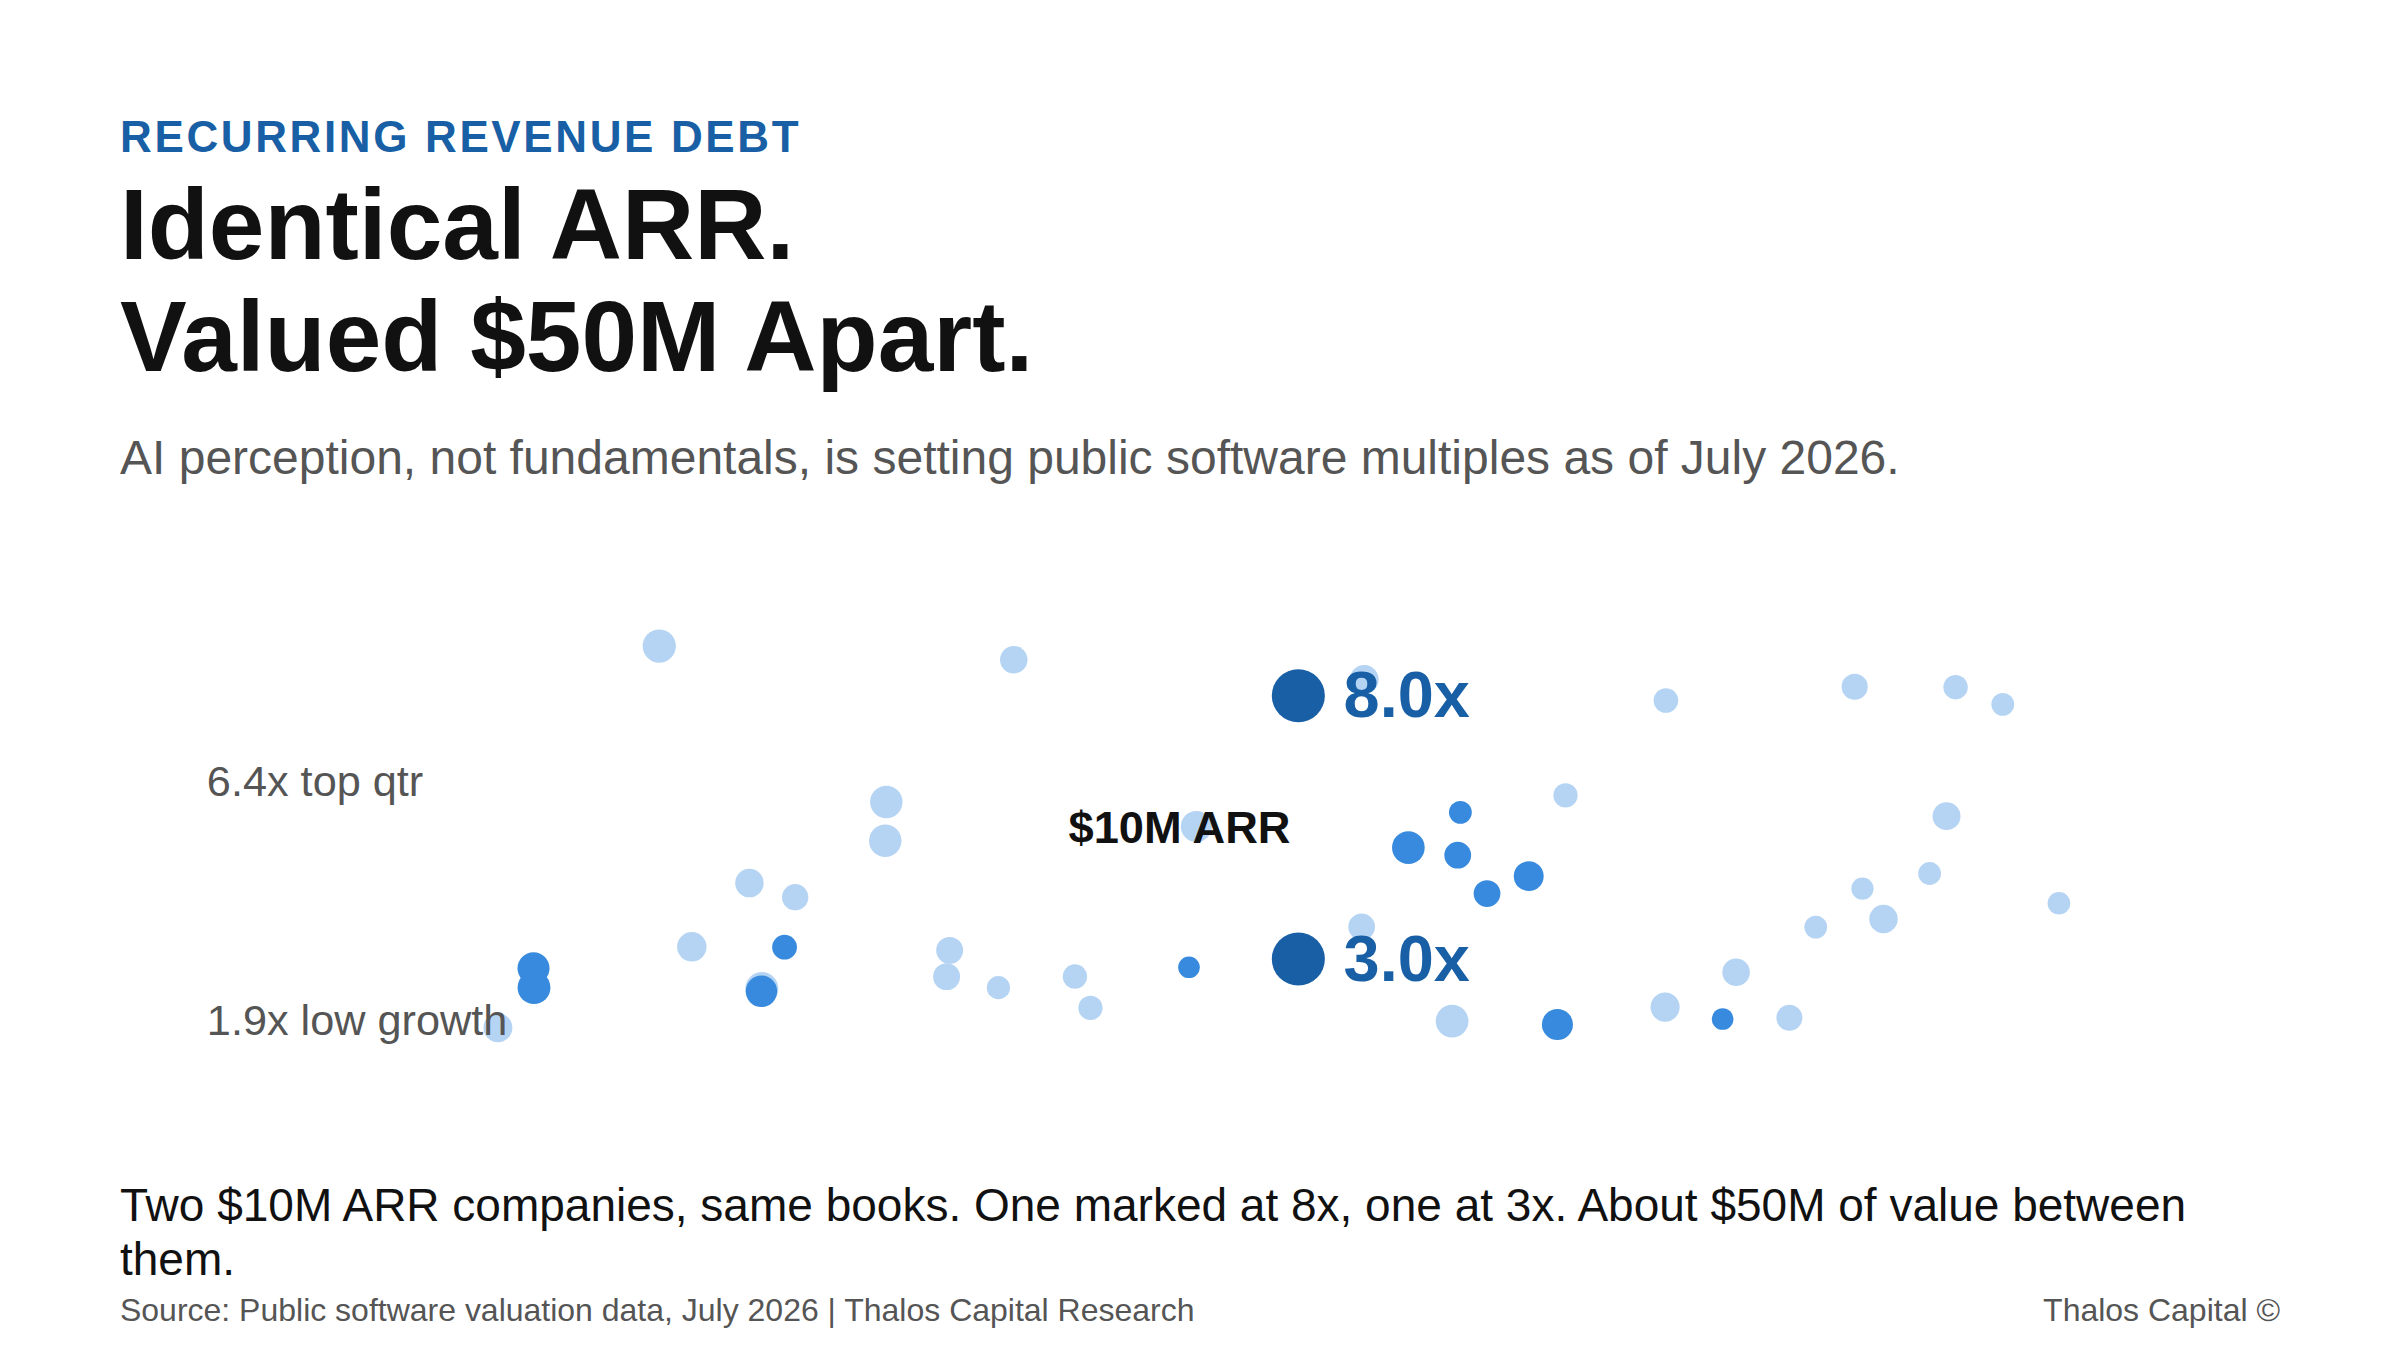
Scatter plot of public SaaS revenue multiples as of July 2026, highlighting two companies with identical $10M ARR marked at 8x and 3x revenue.

AI Perception Is Setting Software Valuations. It Is Not Setting Your Credit.

As of July 2026, AI perception sets software valuations more than fundamentals do. Two identical-ARR companies can be marked $50M apart. A lender reads your contracts, not your narrative.
Read More
Working through a financing decision?
Insights are a starting point. A conversation maps your actual options.
Tell us what you are financing and we will map the structures and sources that fit.
Submit your financing request →
Explore our financing solutions
Equipment FinancingWorking CapitalAsset-Based LendingStrategic Debt