Tag

credit conditions

7 insights

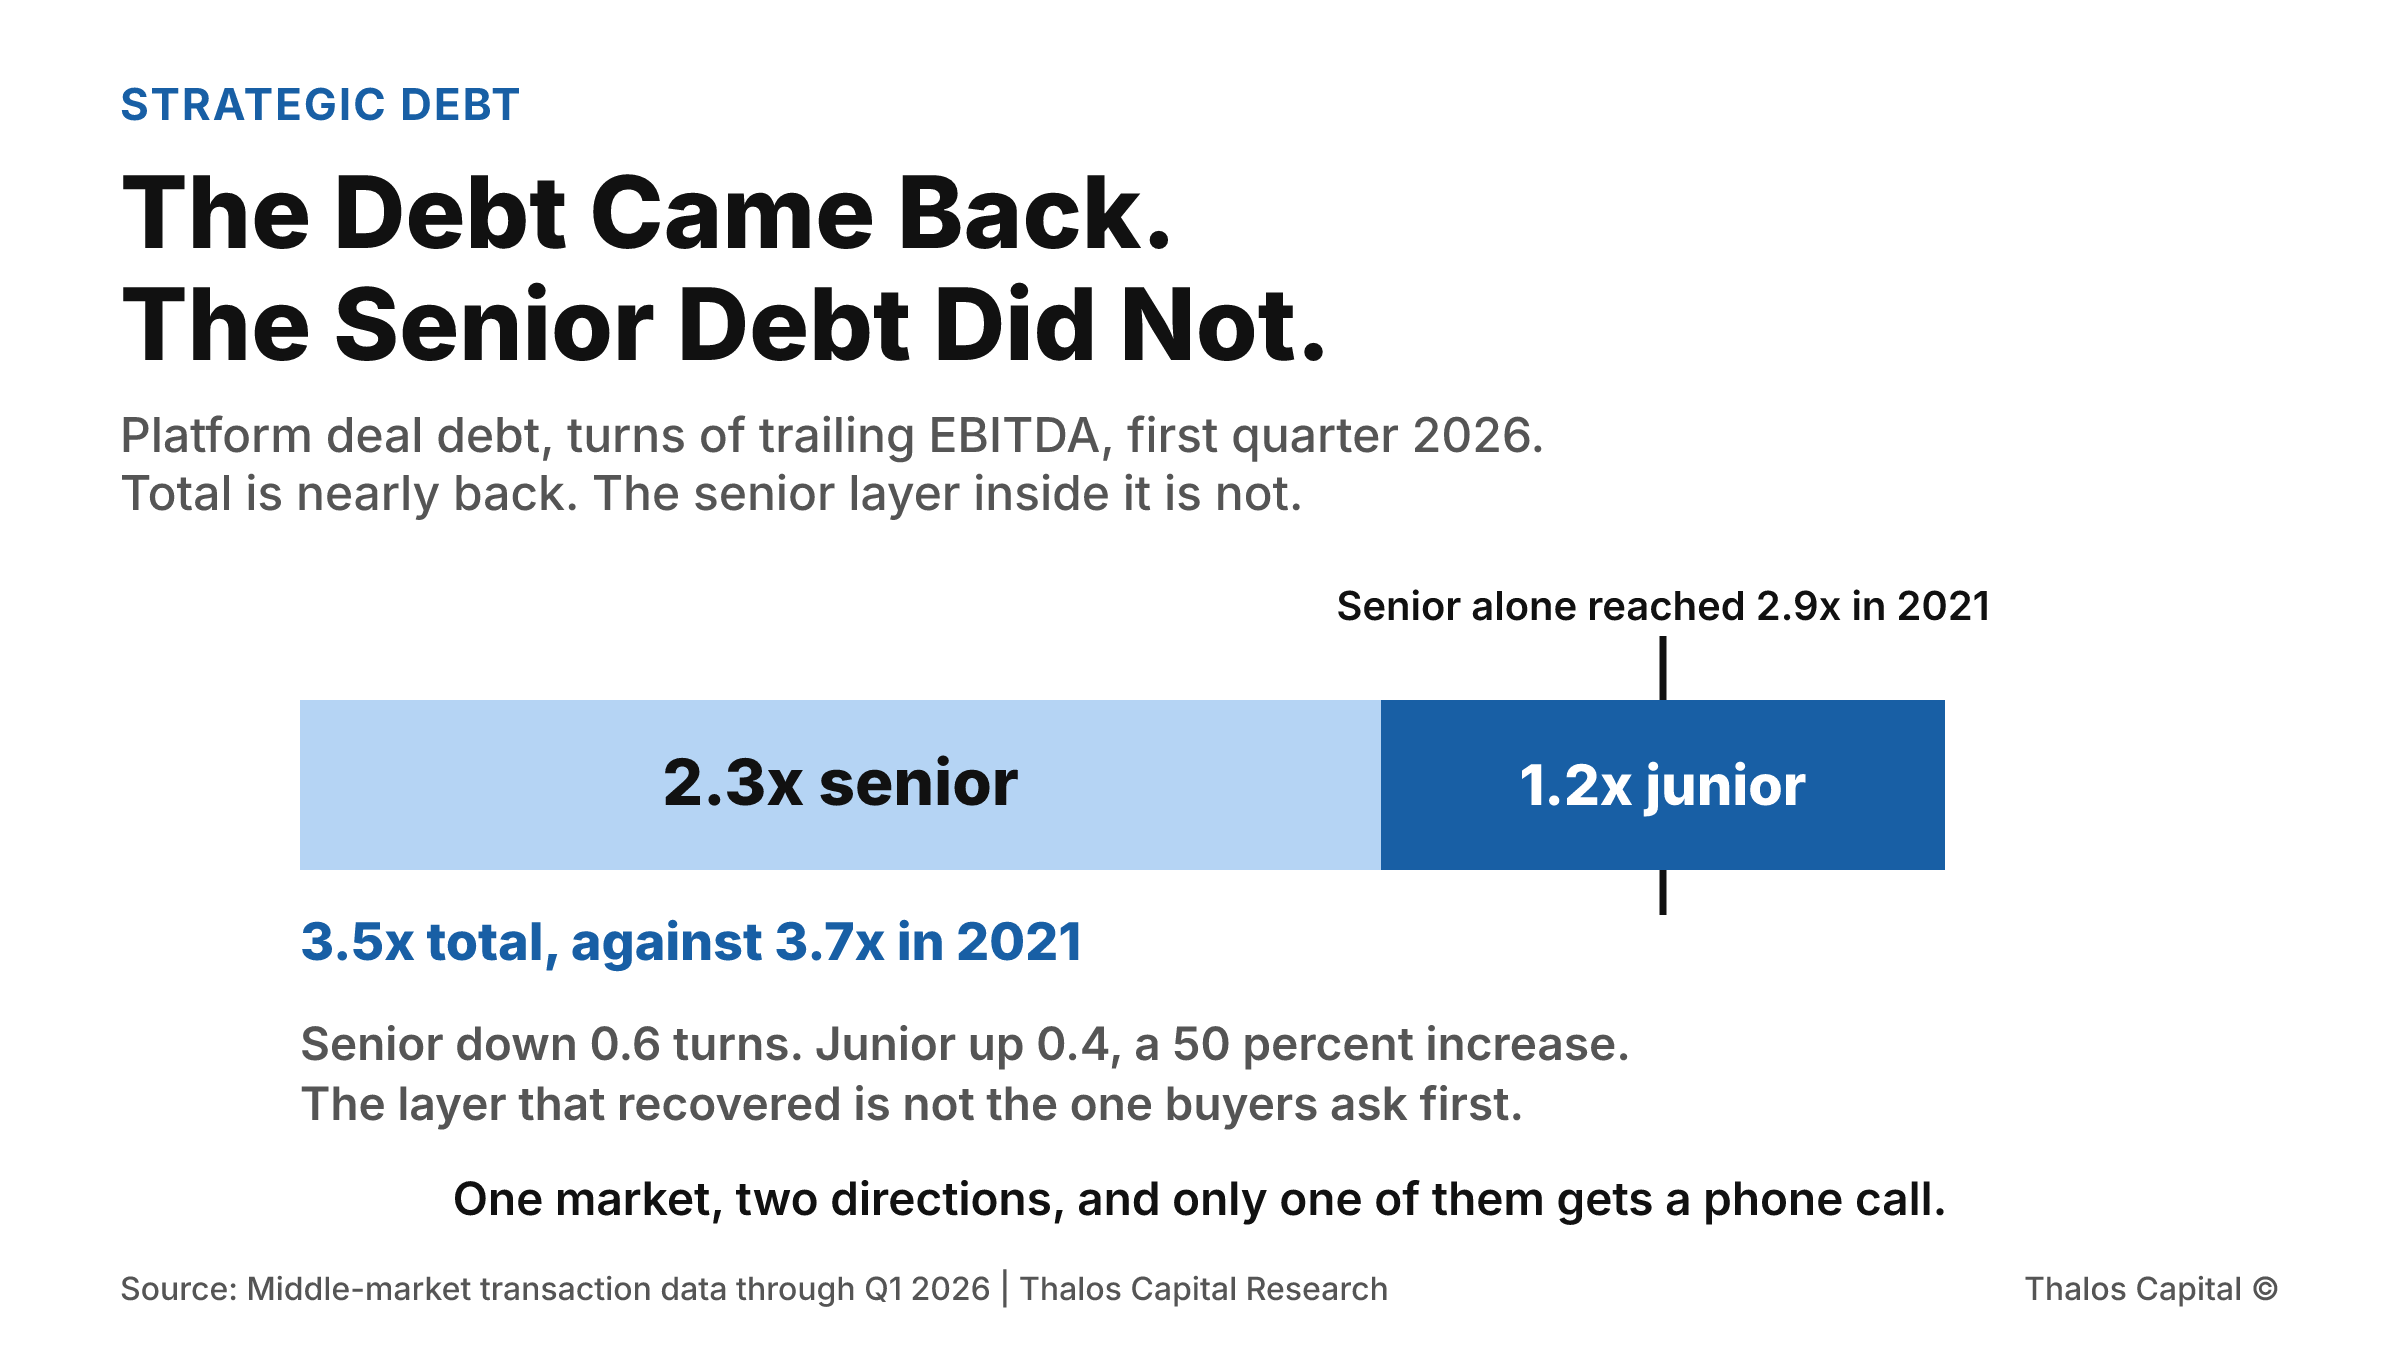
A single stacked bar showing platform deal debt at 3.5 times EBITDA in Q1 2026, split between 2.3 times of senior debt and 1.2 times of junior capital, with a marker showing that senior debt alone reached 2.9 times in 2021.

The Debt Came Back. The Senior Debt Did Not.

Acquisition leverage has recovered to roughly where it stood at the 2021 peak. On platform deals the senior layer has not, and the gap was filled by junior capital, which is not the pool most buyers approach first.
Read More
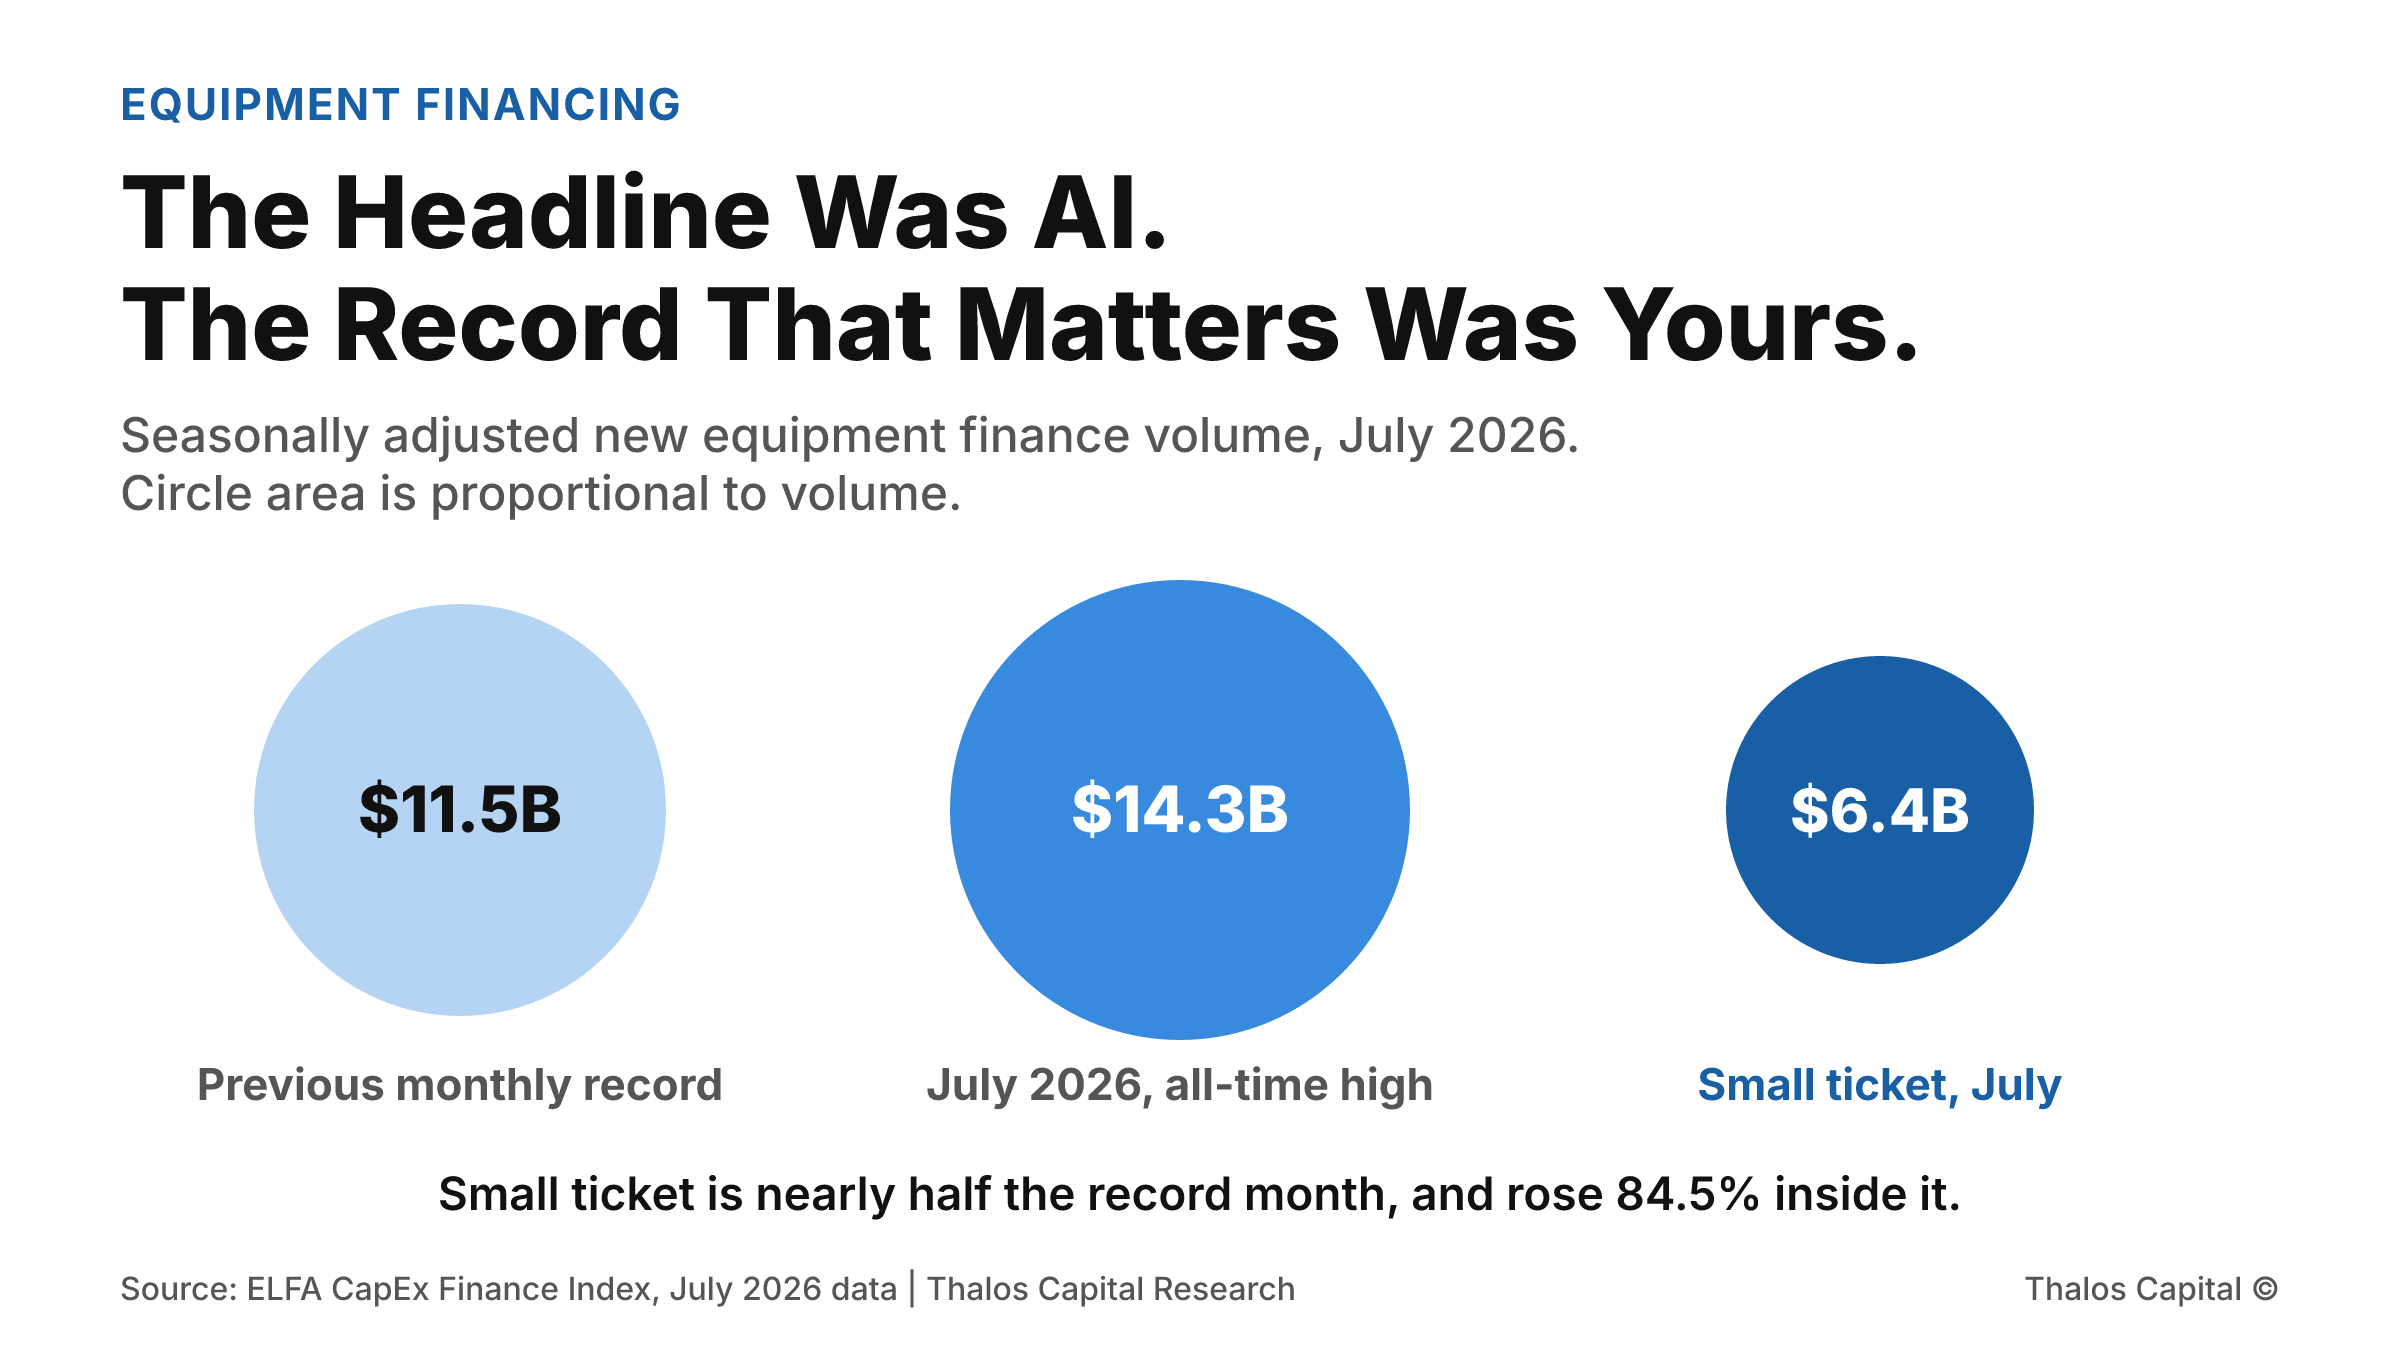
Three proportional circles comparing July 2026 equipment finance volume of $14.3 billion against the previous all-time monthly high of $11.5 billion, with small-ticket volume of $6.4 billion shown as nearly half of the record month.

The Headline Was AI. The Record That Matters Was Yours.

July set an all-time monthly record in equipment finance, and the coverage credited AI capital expenditure. Small-ticket volume set its own record in the same month, up 84.5 percent, and that is the segment mid-market borrowers actually borrow in.
Read More
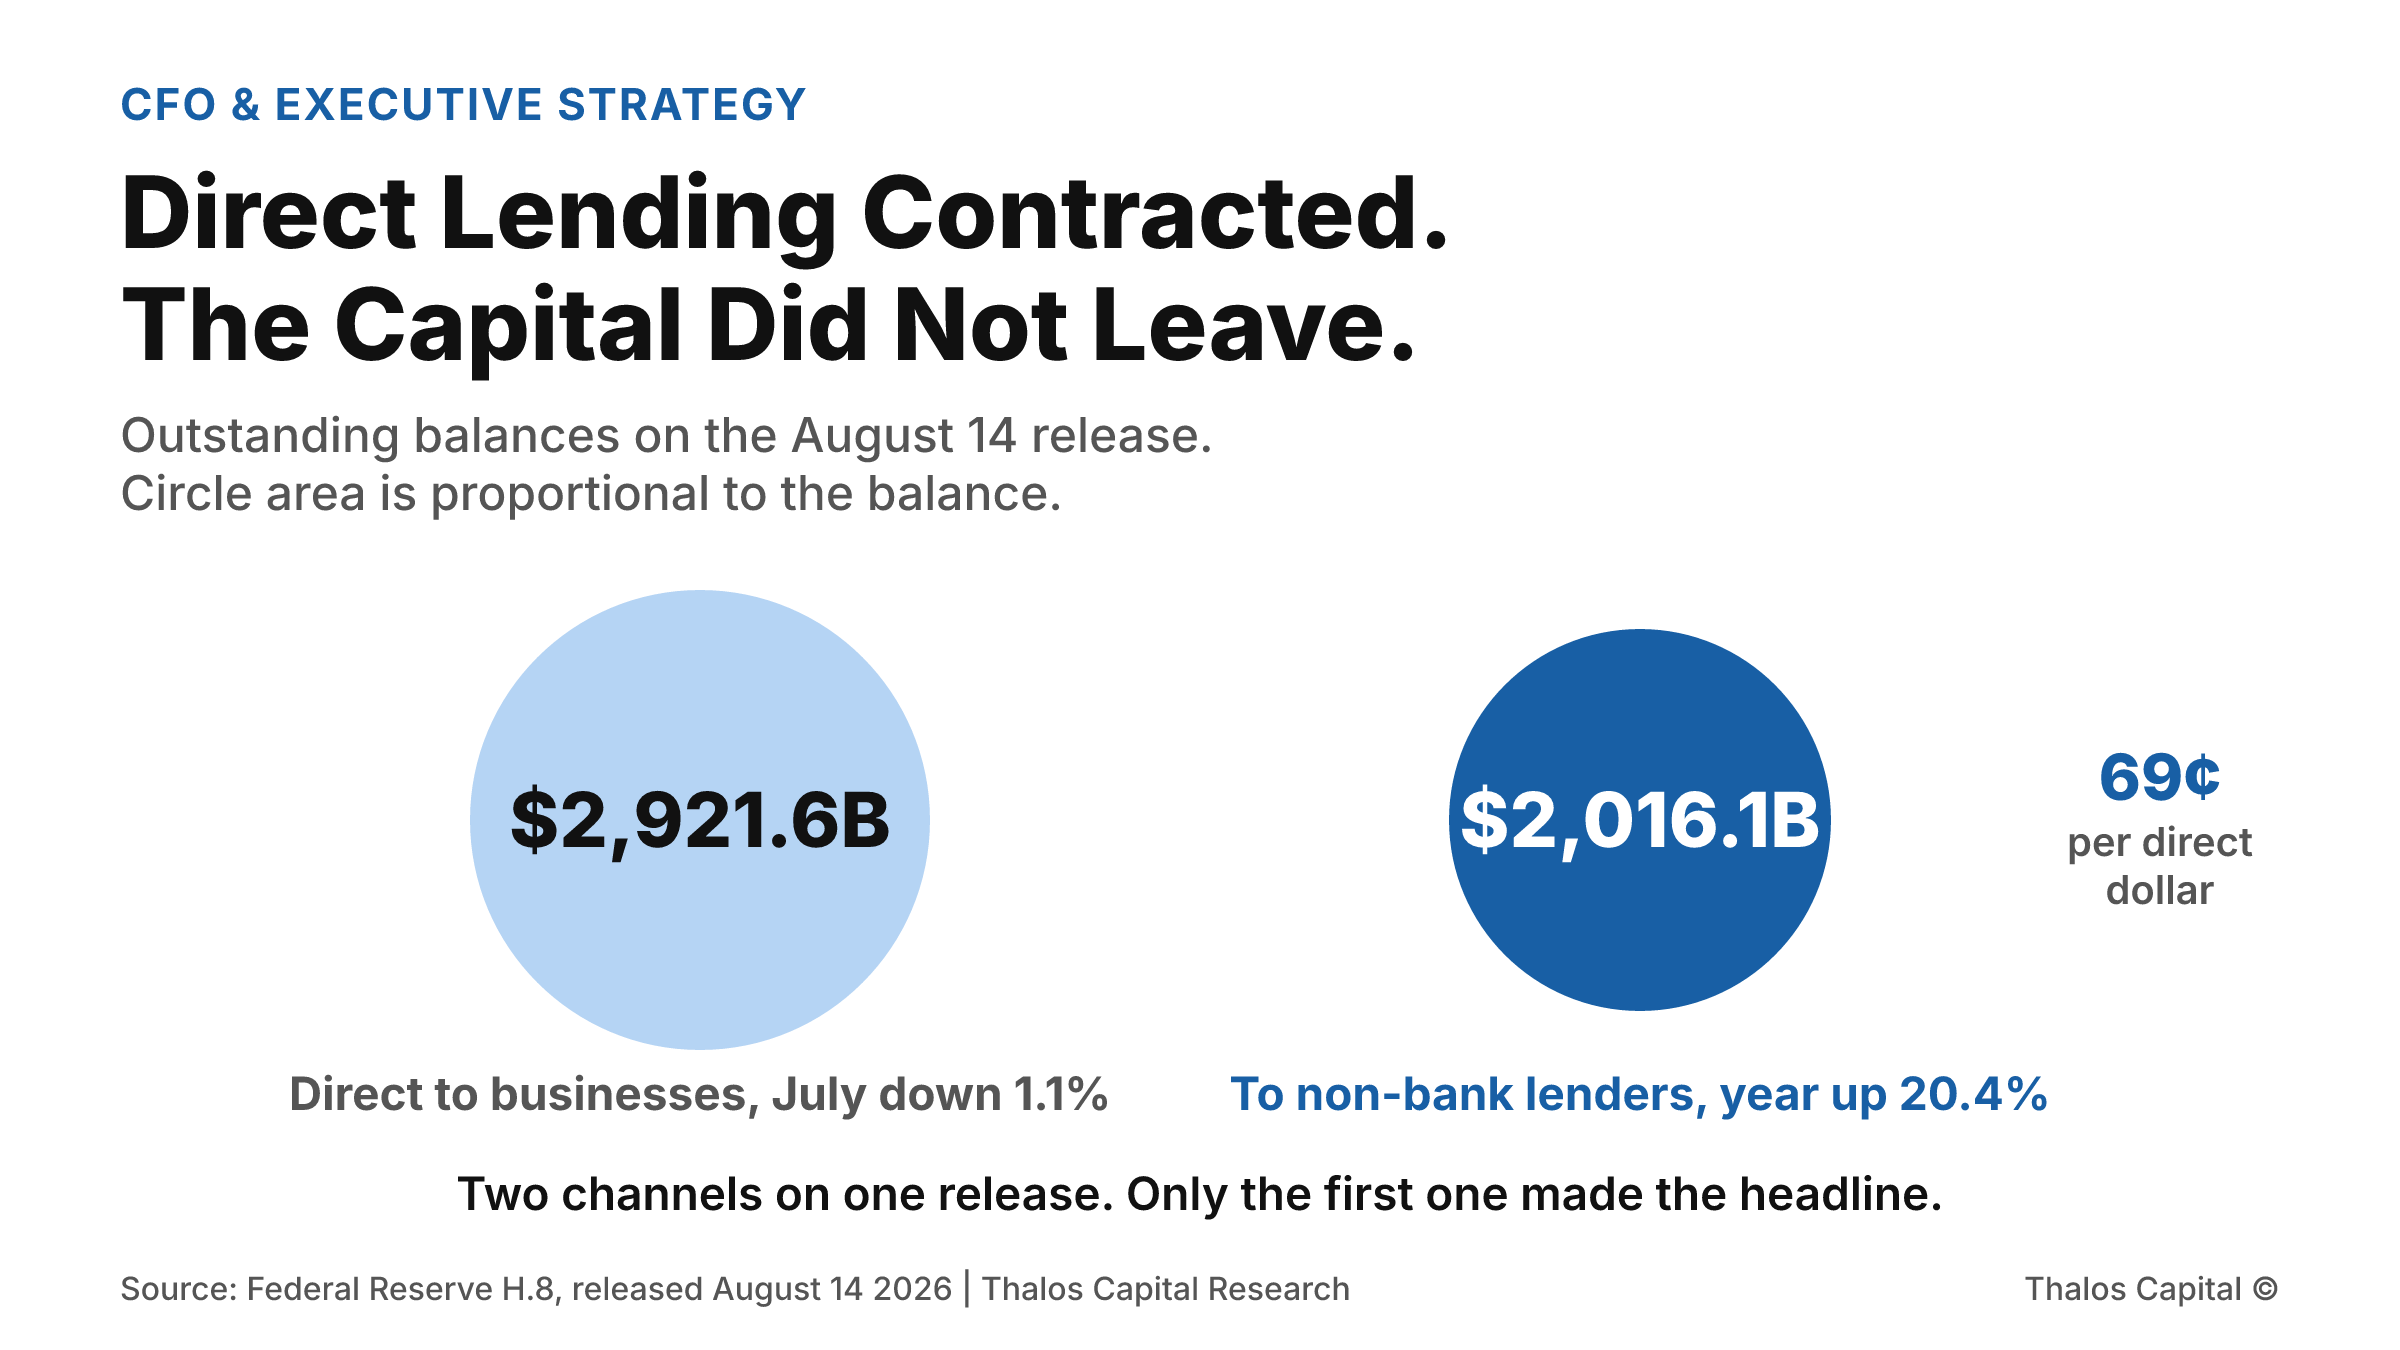
Two proportional circles comparing commercial and industrial loan balances of $2,921.6 billion, which contracted 1.1 percent annualized in July, against lending to non-depository financial institutions of $2,016.1 billion, up 20.4 percent on the year.

Direct Lending Contracted. The Capital Did Not Leave.

July brought the first contraction in commercial and industrial balances all year, at minus 1.1 percent annualized. Over the same stretch, lending to non-bank financial institutions reached $2,016.1 billion, up 20.4 percent.
Read More
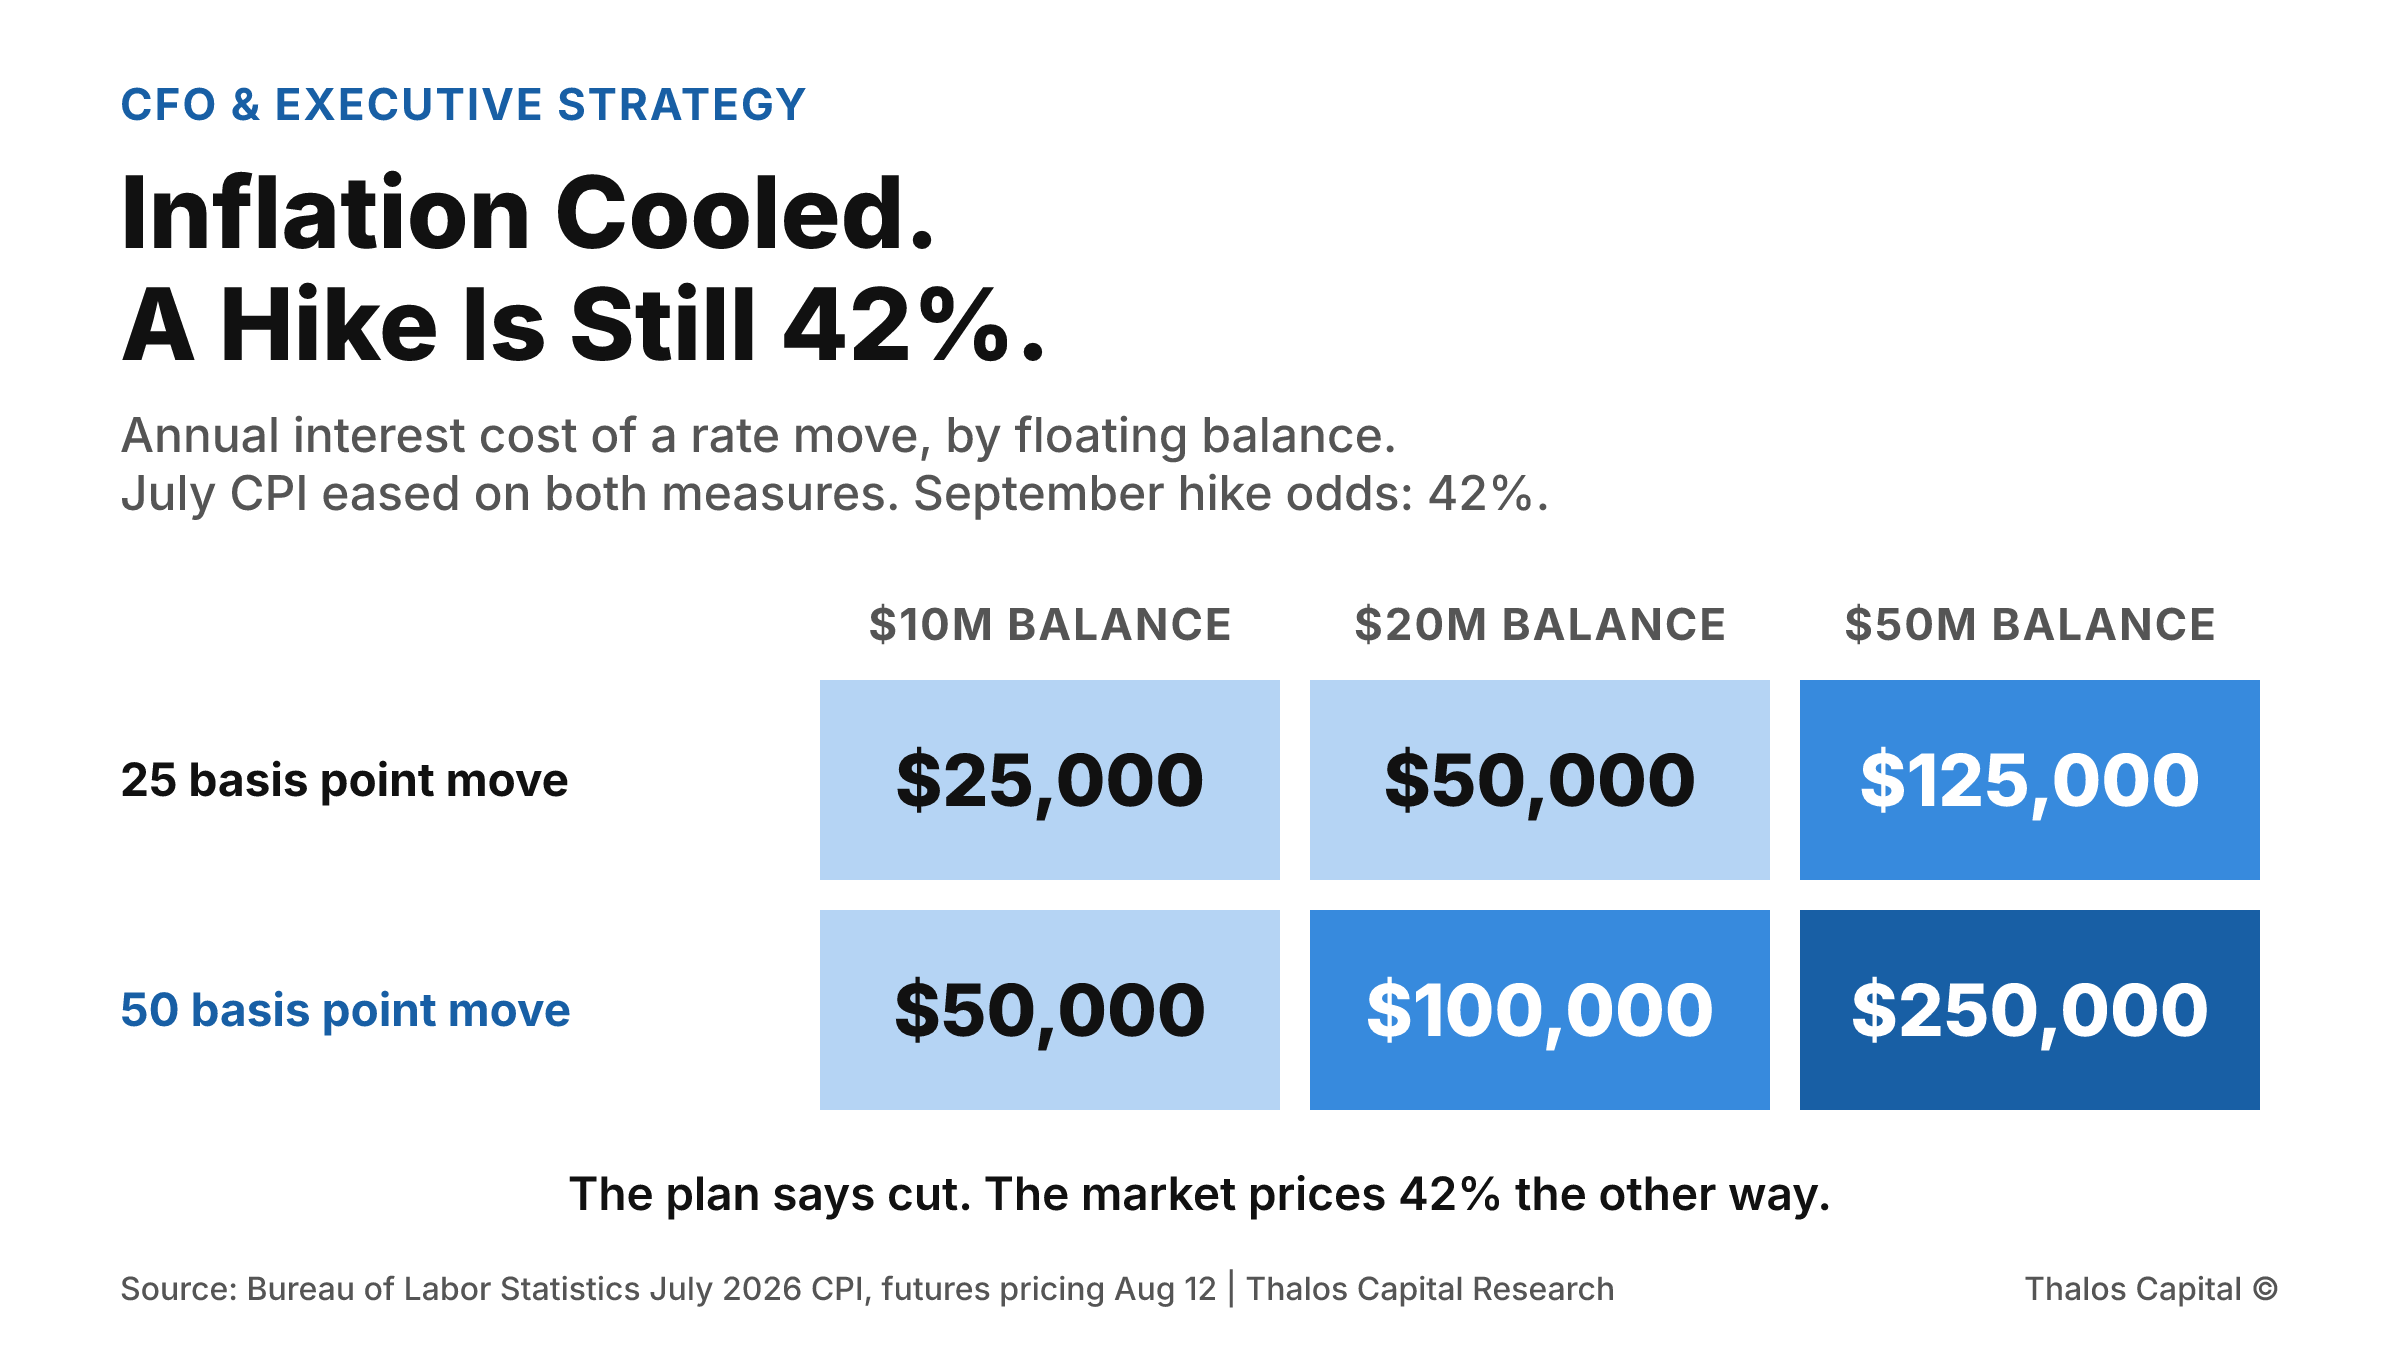
Shaded grid of the annual interest cost of a rate move across three floating balances: a 25 basis point move costs $25,000 on $10 million, $50,000 on $20 million and $125,000 on $50 million, and a 50 basis point move costs $50,000, $100,000 and $250,000 respectively.

Inflation Cooled. A Hike Is Still a 42 Percent Bet.

July CPI came in exactly as forecast, both measures eased, and Treasury yields fell across the board. Futures still priced a 42 percent chance of a September hike. What that asymmetry is worth on a floating balance.
Read More
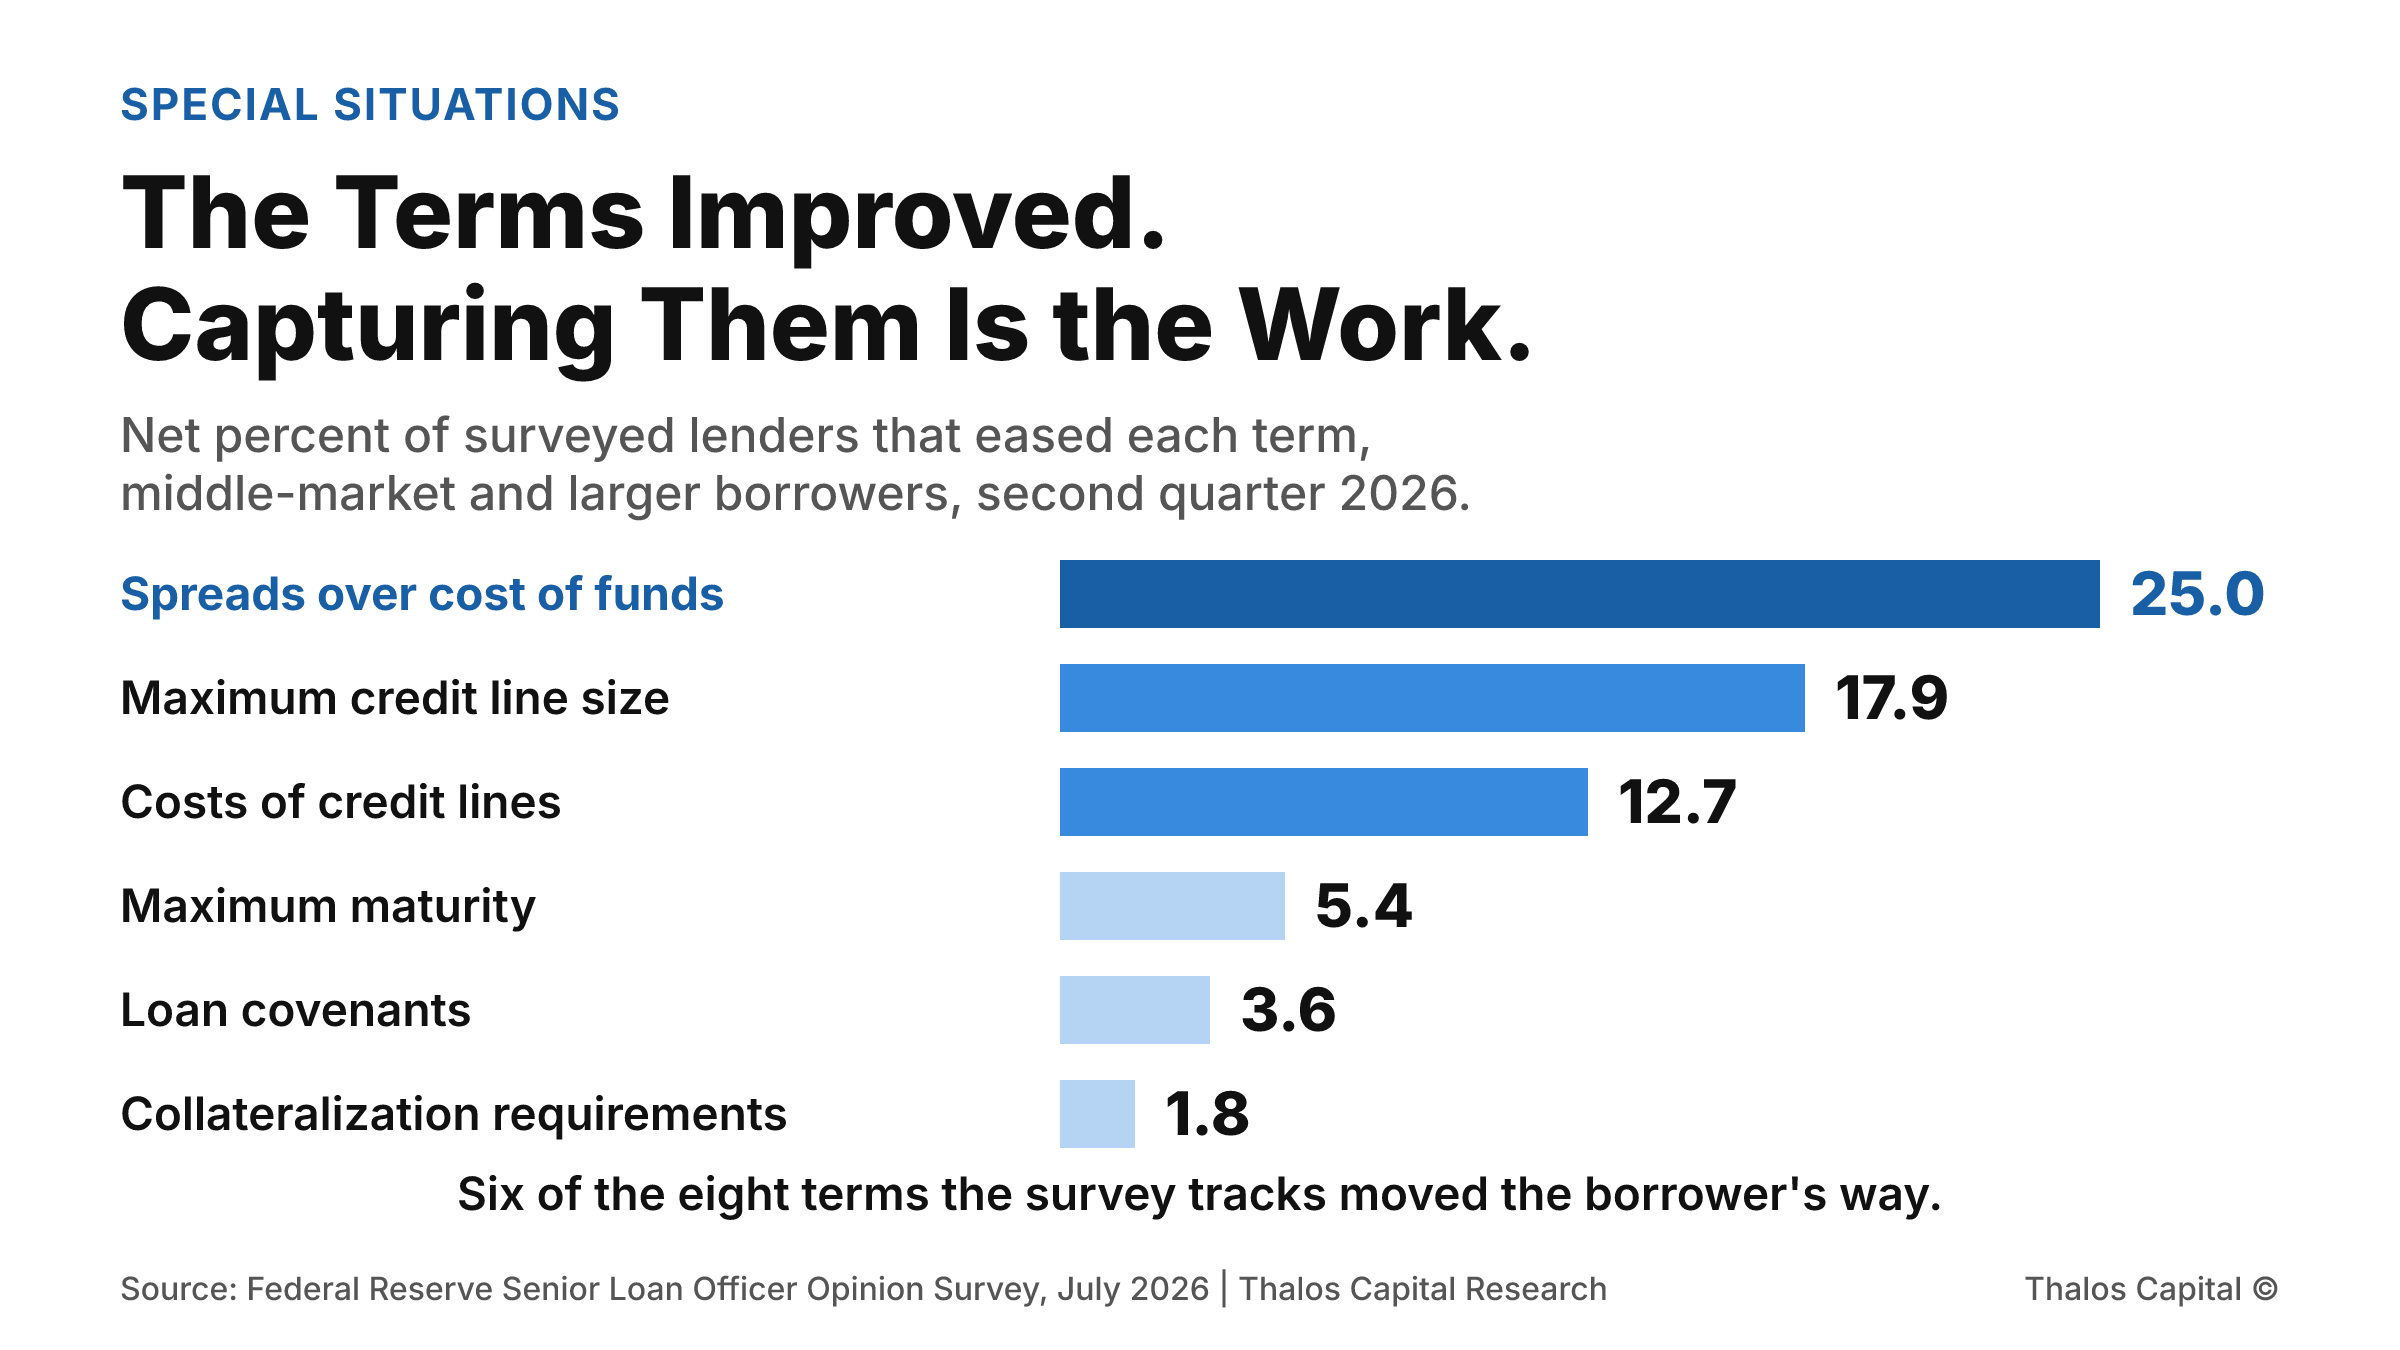
Ordered horizontal bars showing the net percent of surveyed lenders that eased each commercial and industrial loan term in the second quarter of 2026, led by spreads over cost of funds at 25.0 percent, then credit line size at 17.9, cost of credit lines at 12.7, maturity at 5.4, covenants at 3.6, and collateralization at 1.8.

The Terms Improved. Capturing Them Is the Work.

A net 25 percent of surveyed lenders narrowed spreads on middle-market loans last quarter, and six of eight tracked terms moved the borrower's way. Complex, regulated, and non-sponsor situations capture that only if the file fits the mandate.
Read More
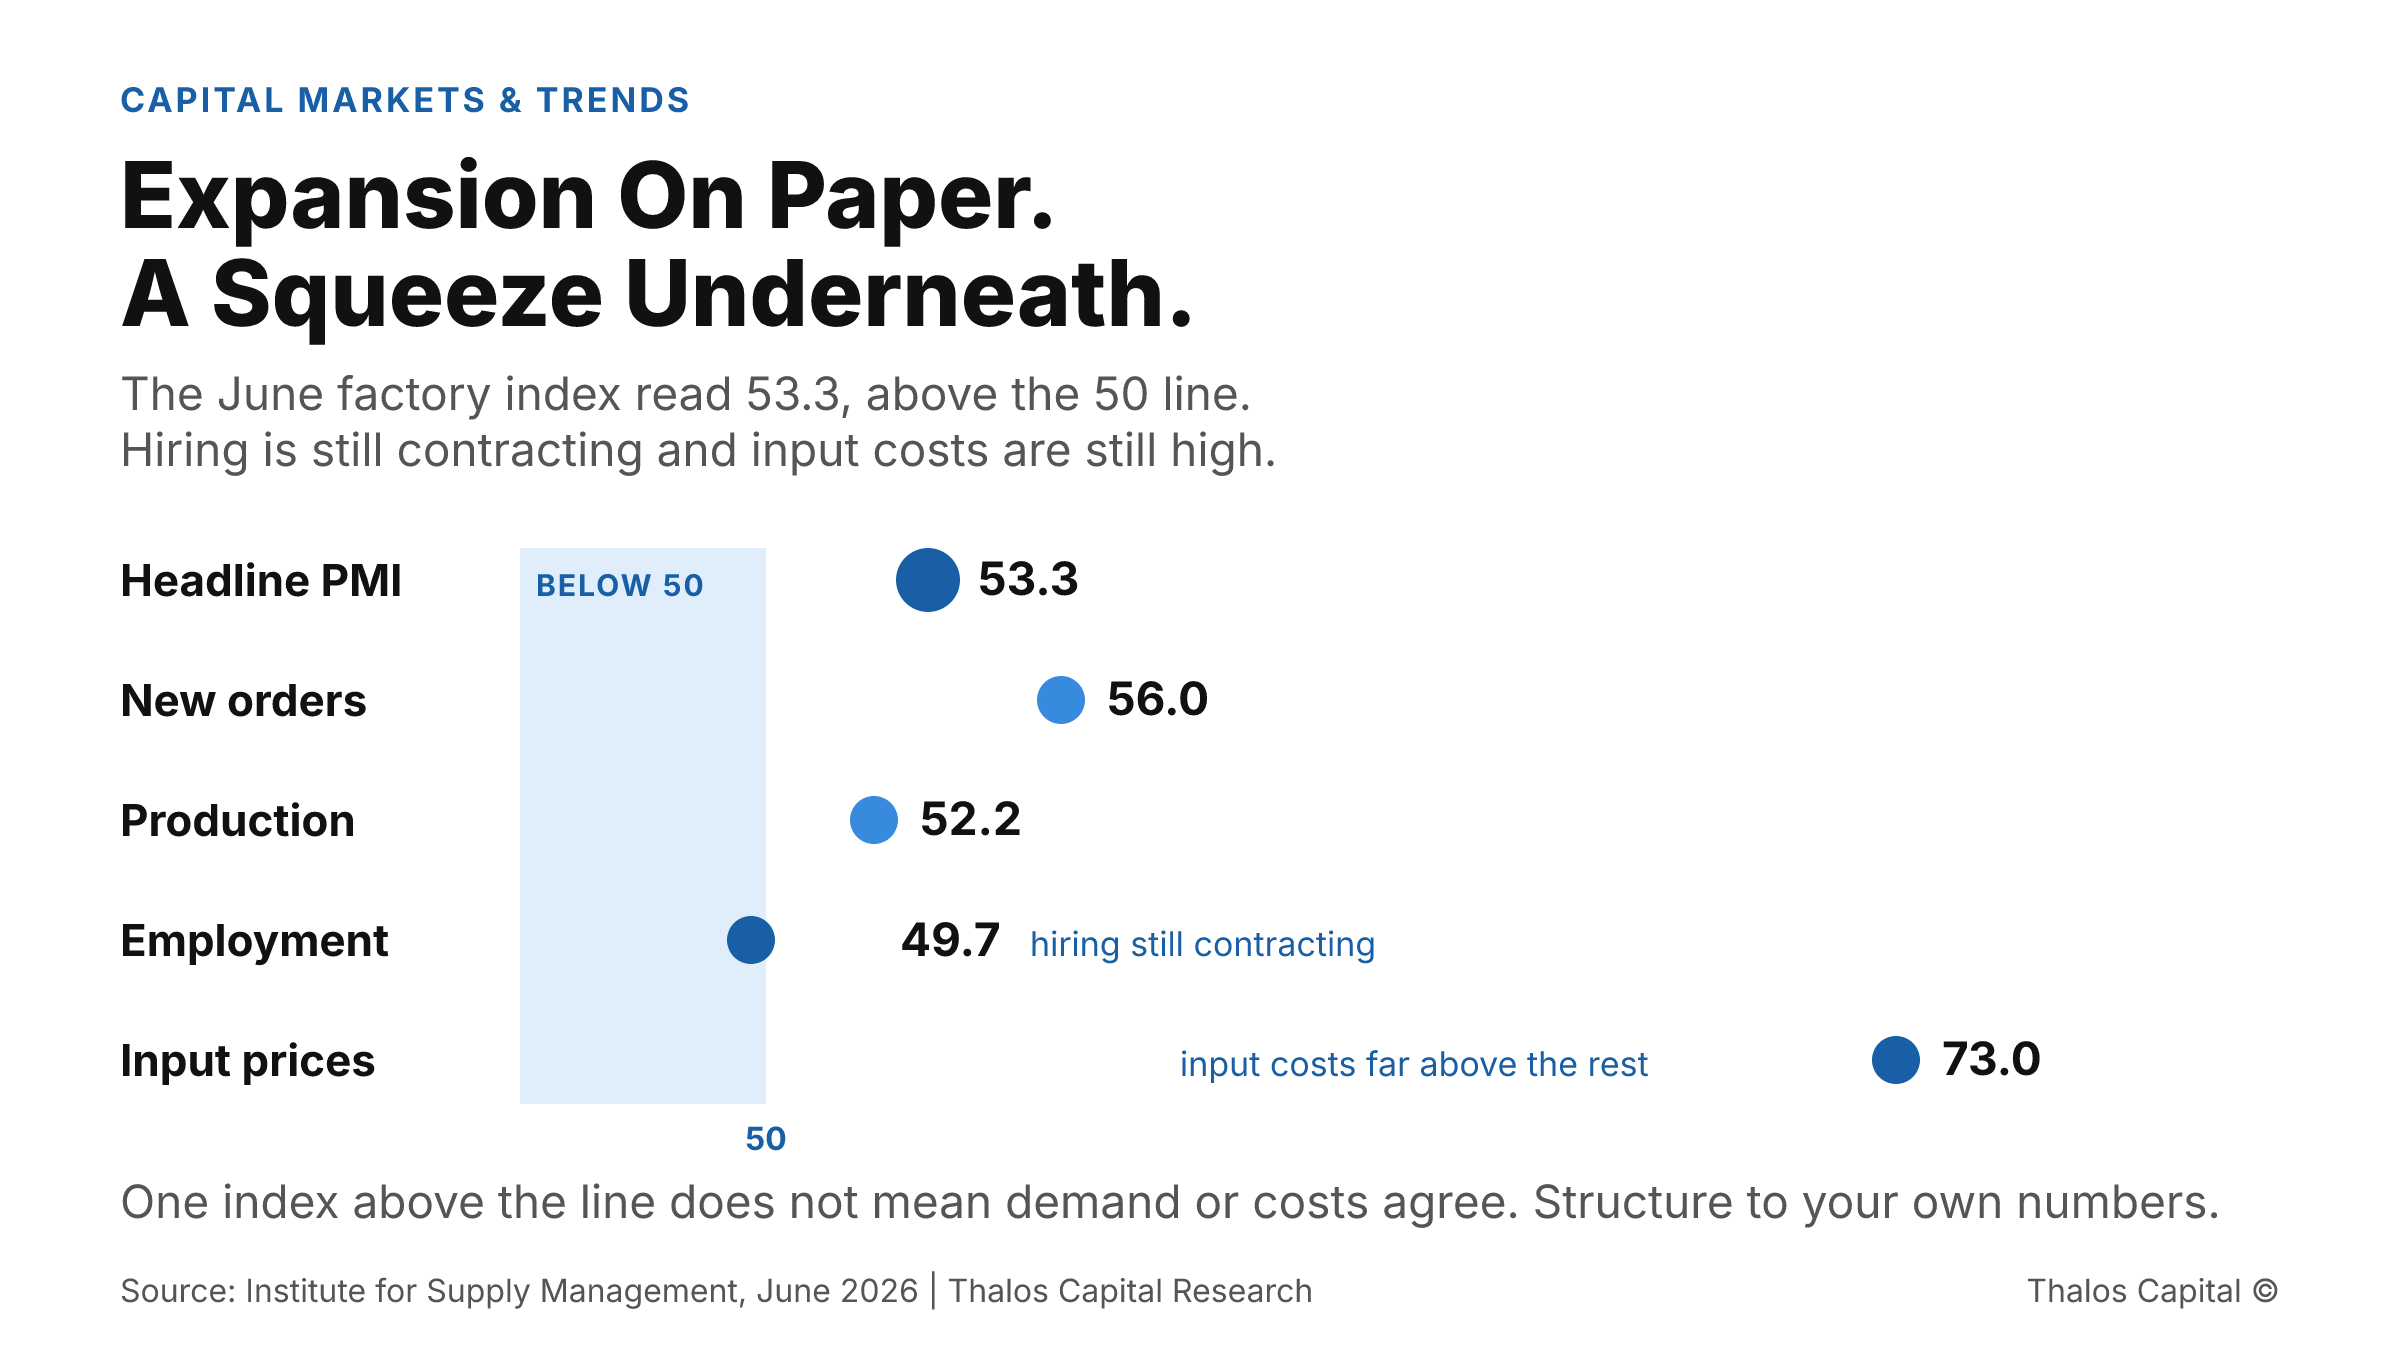
Dot plot of June 2026 factory index components showing headline PMI at 53.3 above the 50 line while employment sits at 49.7 in contraction and input prices at 73.0 remain elevated.

Expansion On Paper. A Squeeze Underneath.

A factory index above 50 reads as a growth signal, but hiring is still contracting and input costs are still high. Why financing sized to the headline misreads a margin story as a volume story.
Read More
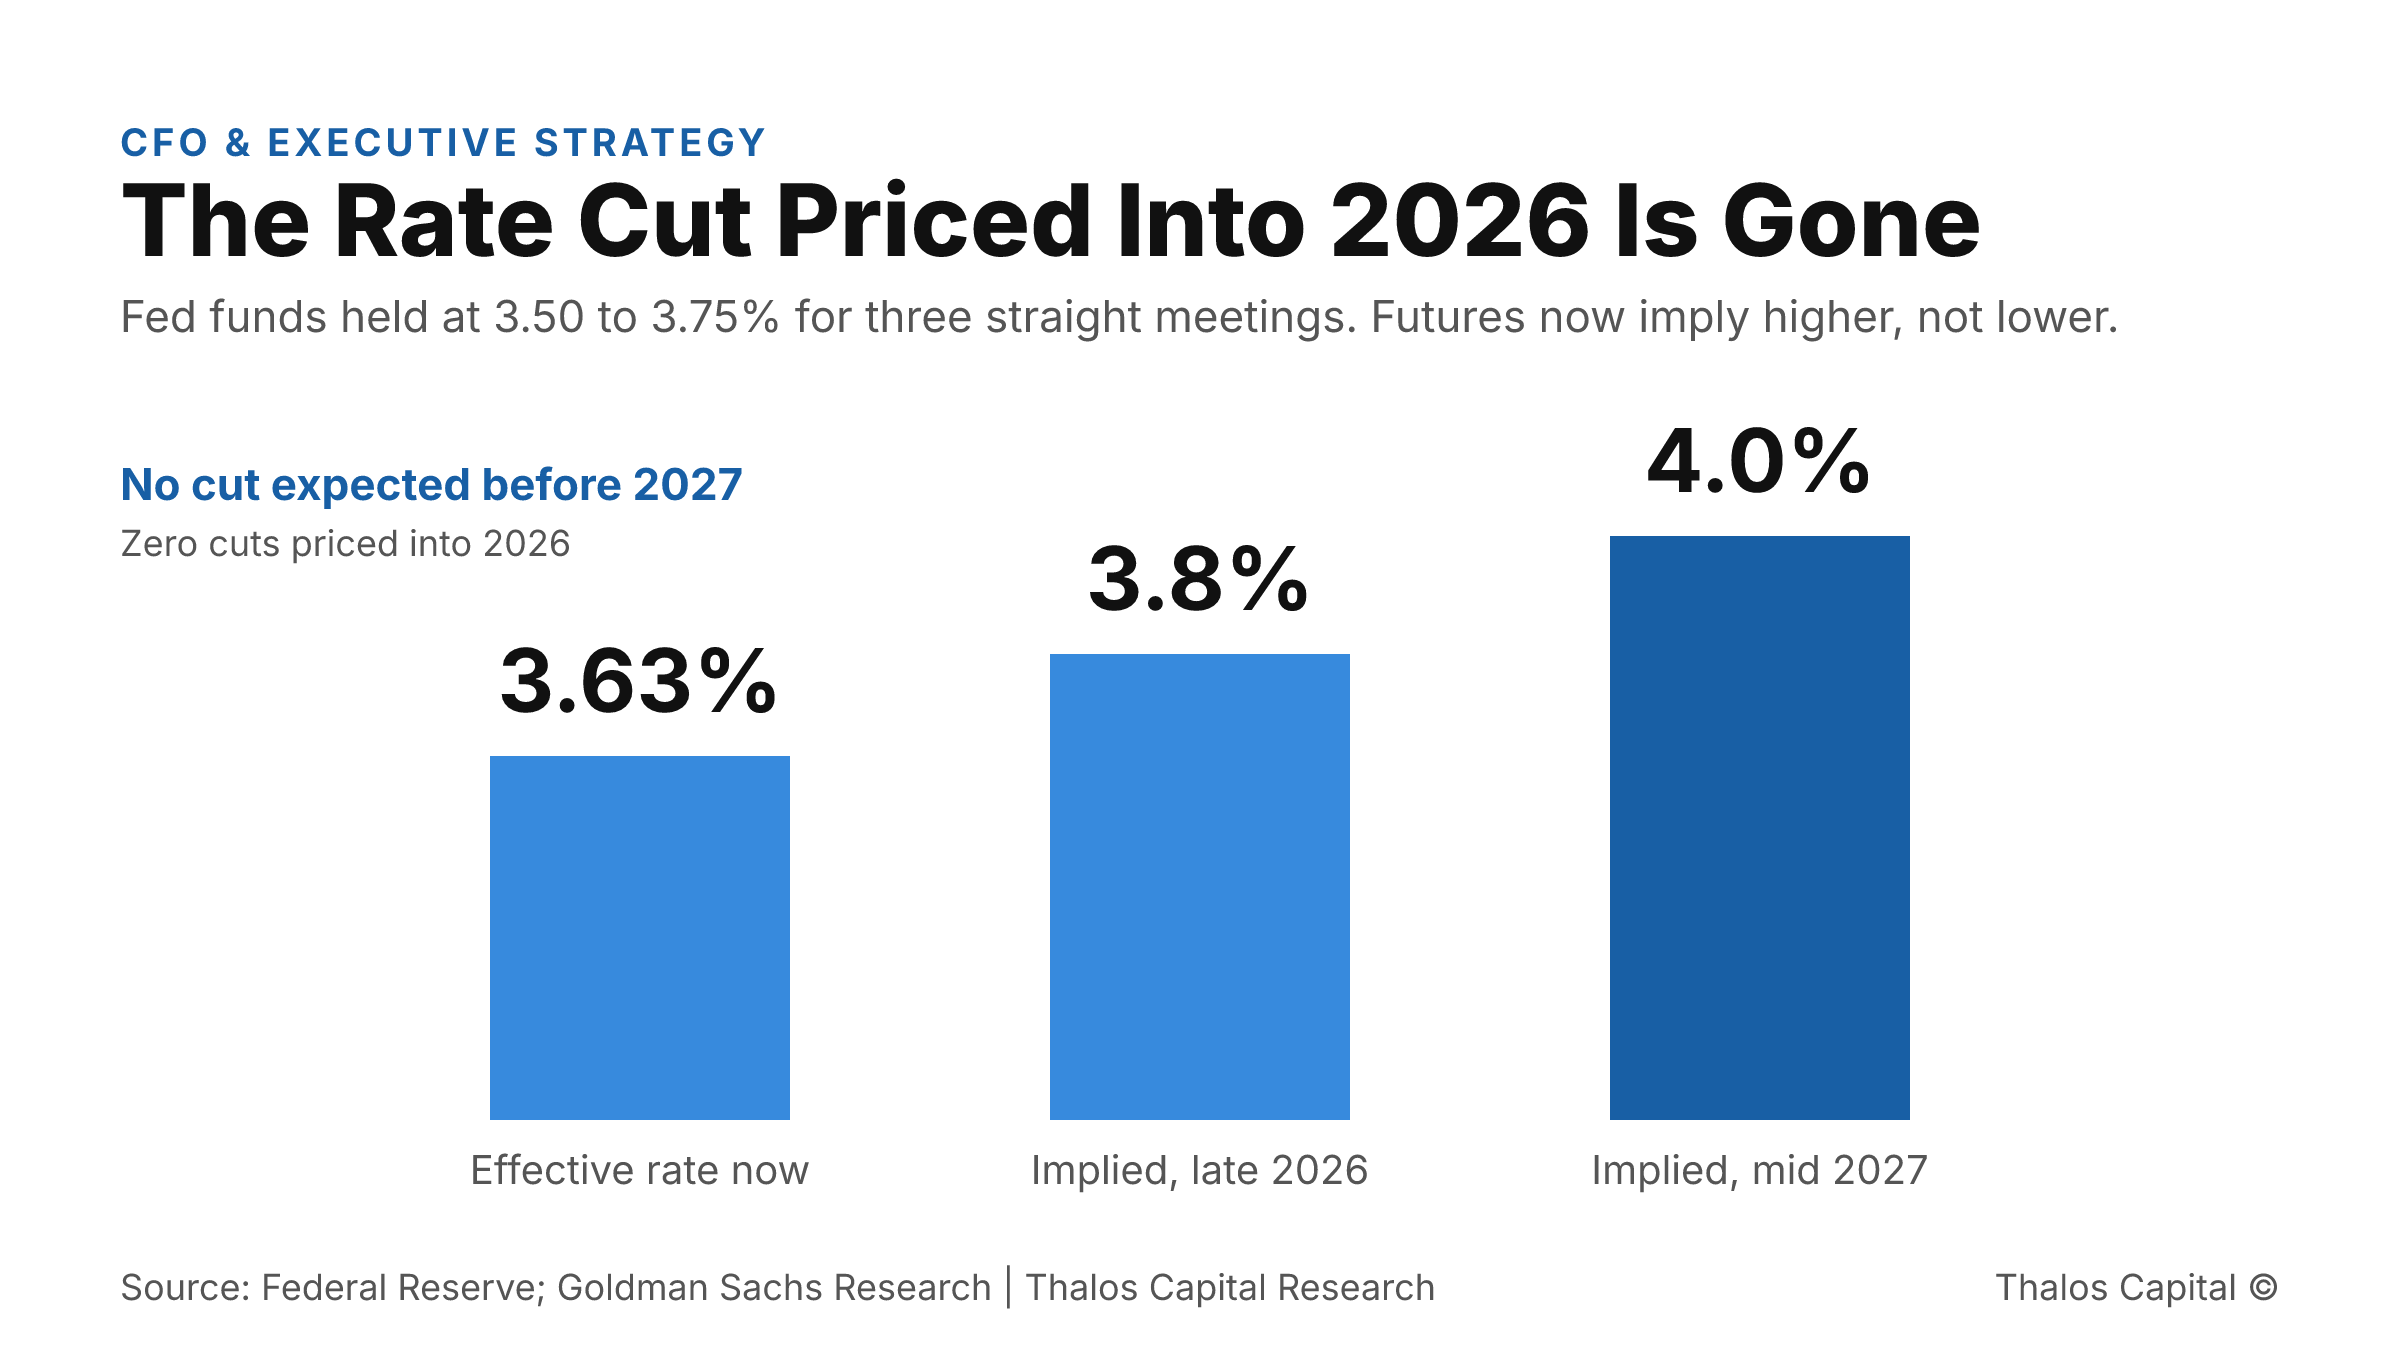
Bar chart showing the federal funds rate at 3.63% today, rising to an implied 3.8% by late 2026 and 4.0% by mid 2027, with no rate cut expected before 2027 according to futures pricing.

The Rate Cut Your Capital Plan Is Counting On Is Not Coming

The 2026 rate cuts your capital plan assumed are gone. The Fed is on hold, banks are tighter, and capital has shifted to private credit. How to structure financing for the rate environment that actually exists.
Read More
Working through a financing decision?
Insights are a starting point. A conversation maps your actual options.
Tell us what you are financing and we will map the structures and sources that fit.
Submit your financing request →
Explore our financing solutions
Equipment FinancingWorking CapitalAsset-Based LendingStrategic Debt