Tag

CFO strategy

6 insights

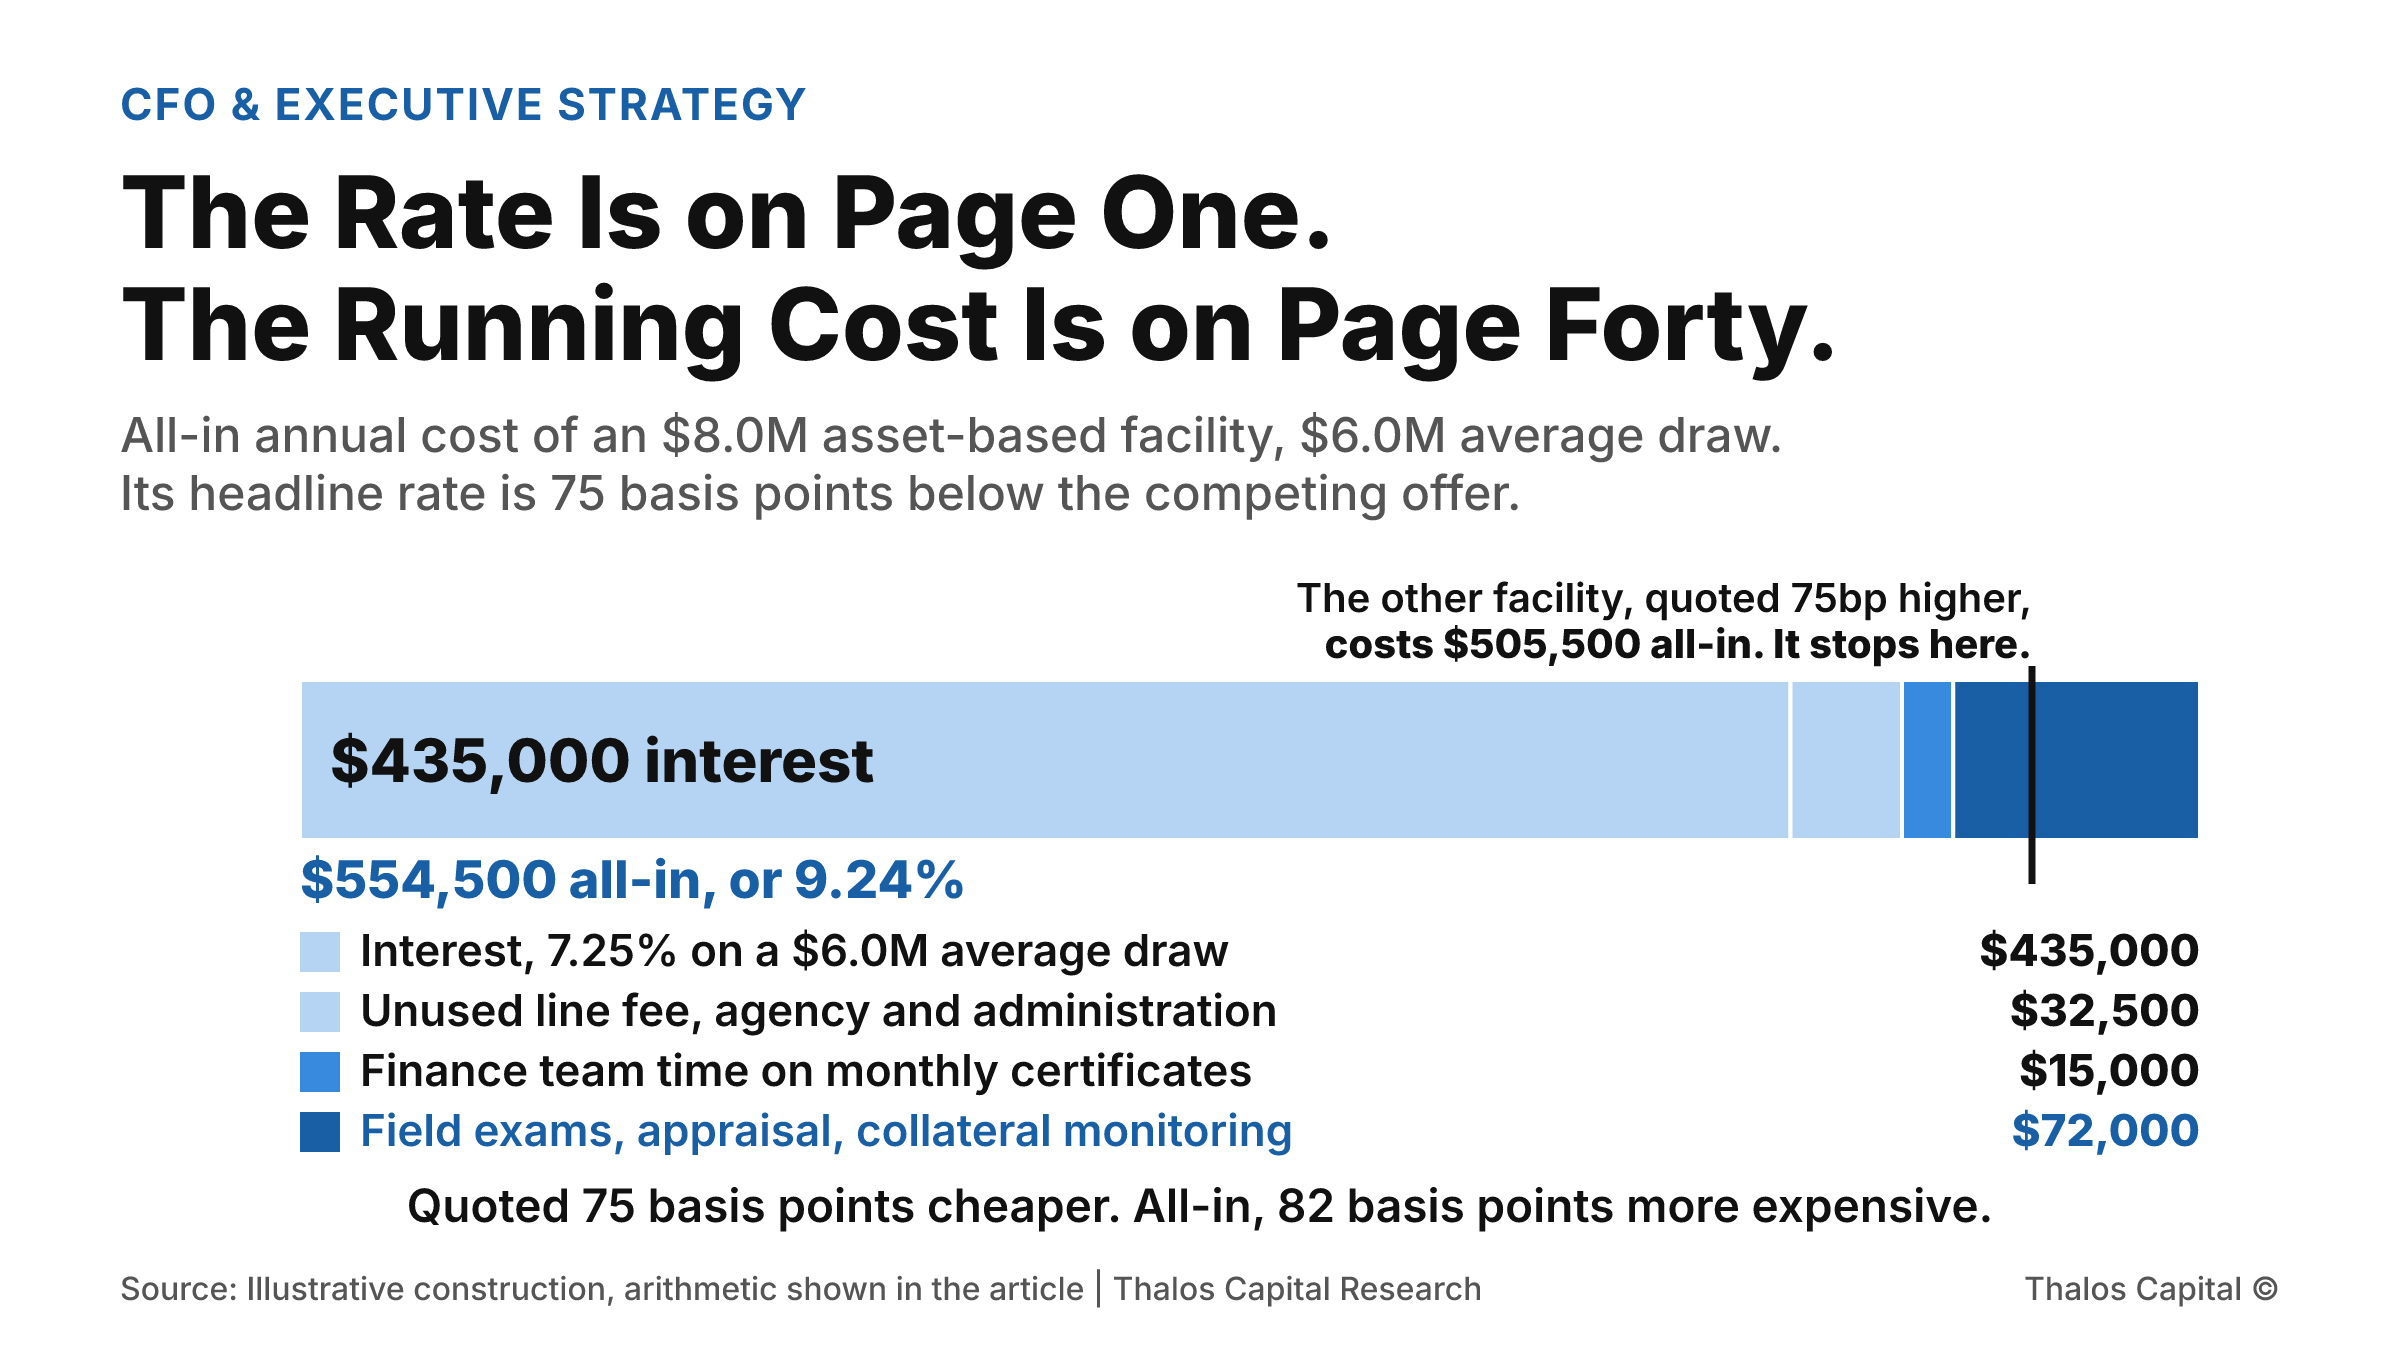
A single stacked bar of the all-in annual cost of an $8.0 million asset-based facility at a $6.0 million average draw, totalling $554,500, with a marker showing that a competing facility quoted 75 basis points higher costs $505,500 all-in.

The Rate Is on Page One. The Running Cost Is on Page Forty.

Two facilities quoted 75 basis points apart. Once field exams, appraisals, collateral monitoring and the finance team's own hours are counted, the cheaper-looking one costs 82 basis points more to run. The gap reverses entirely.
Read More
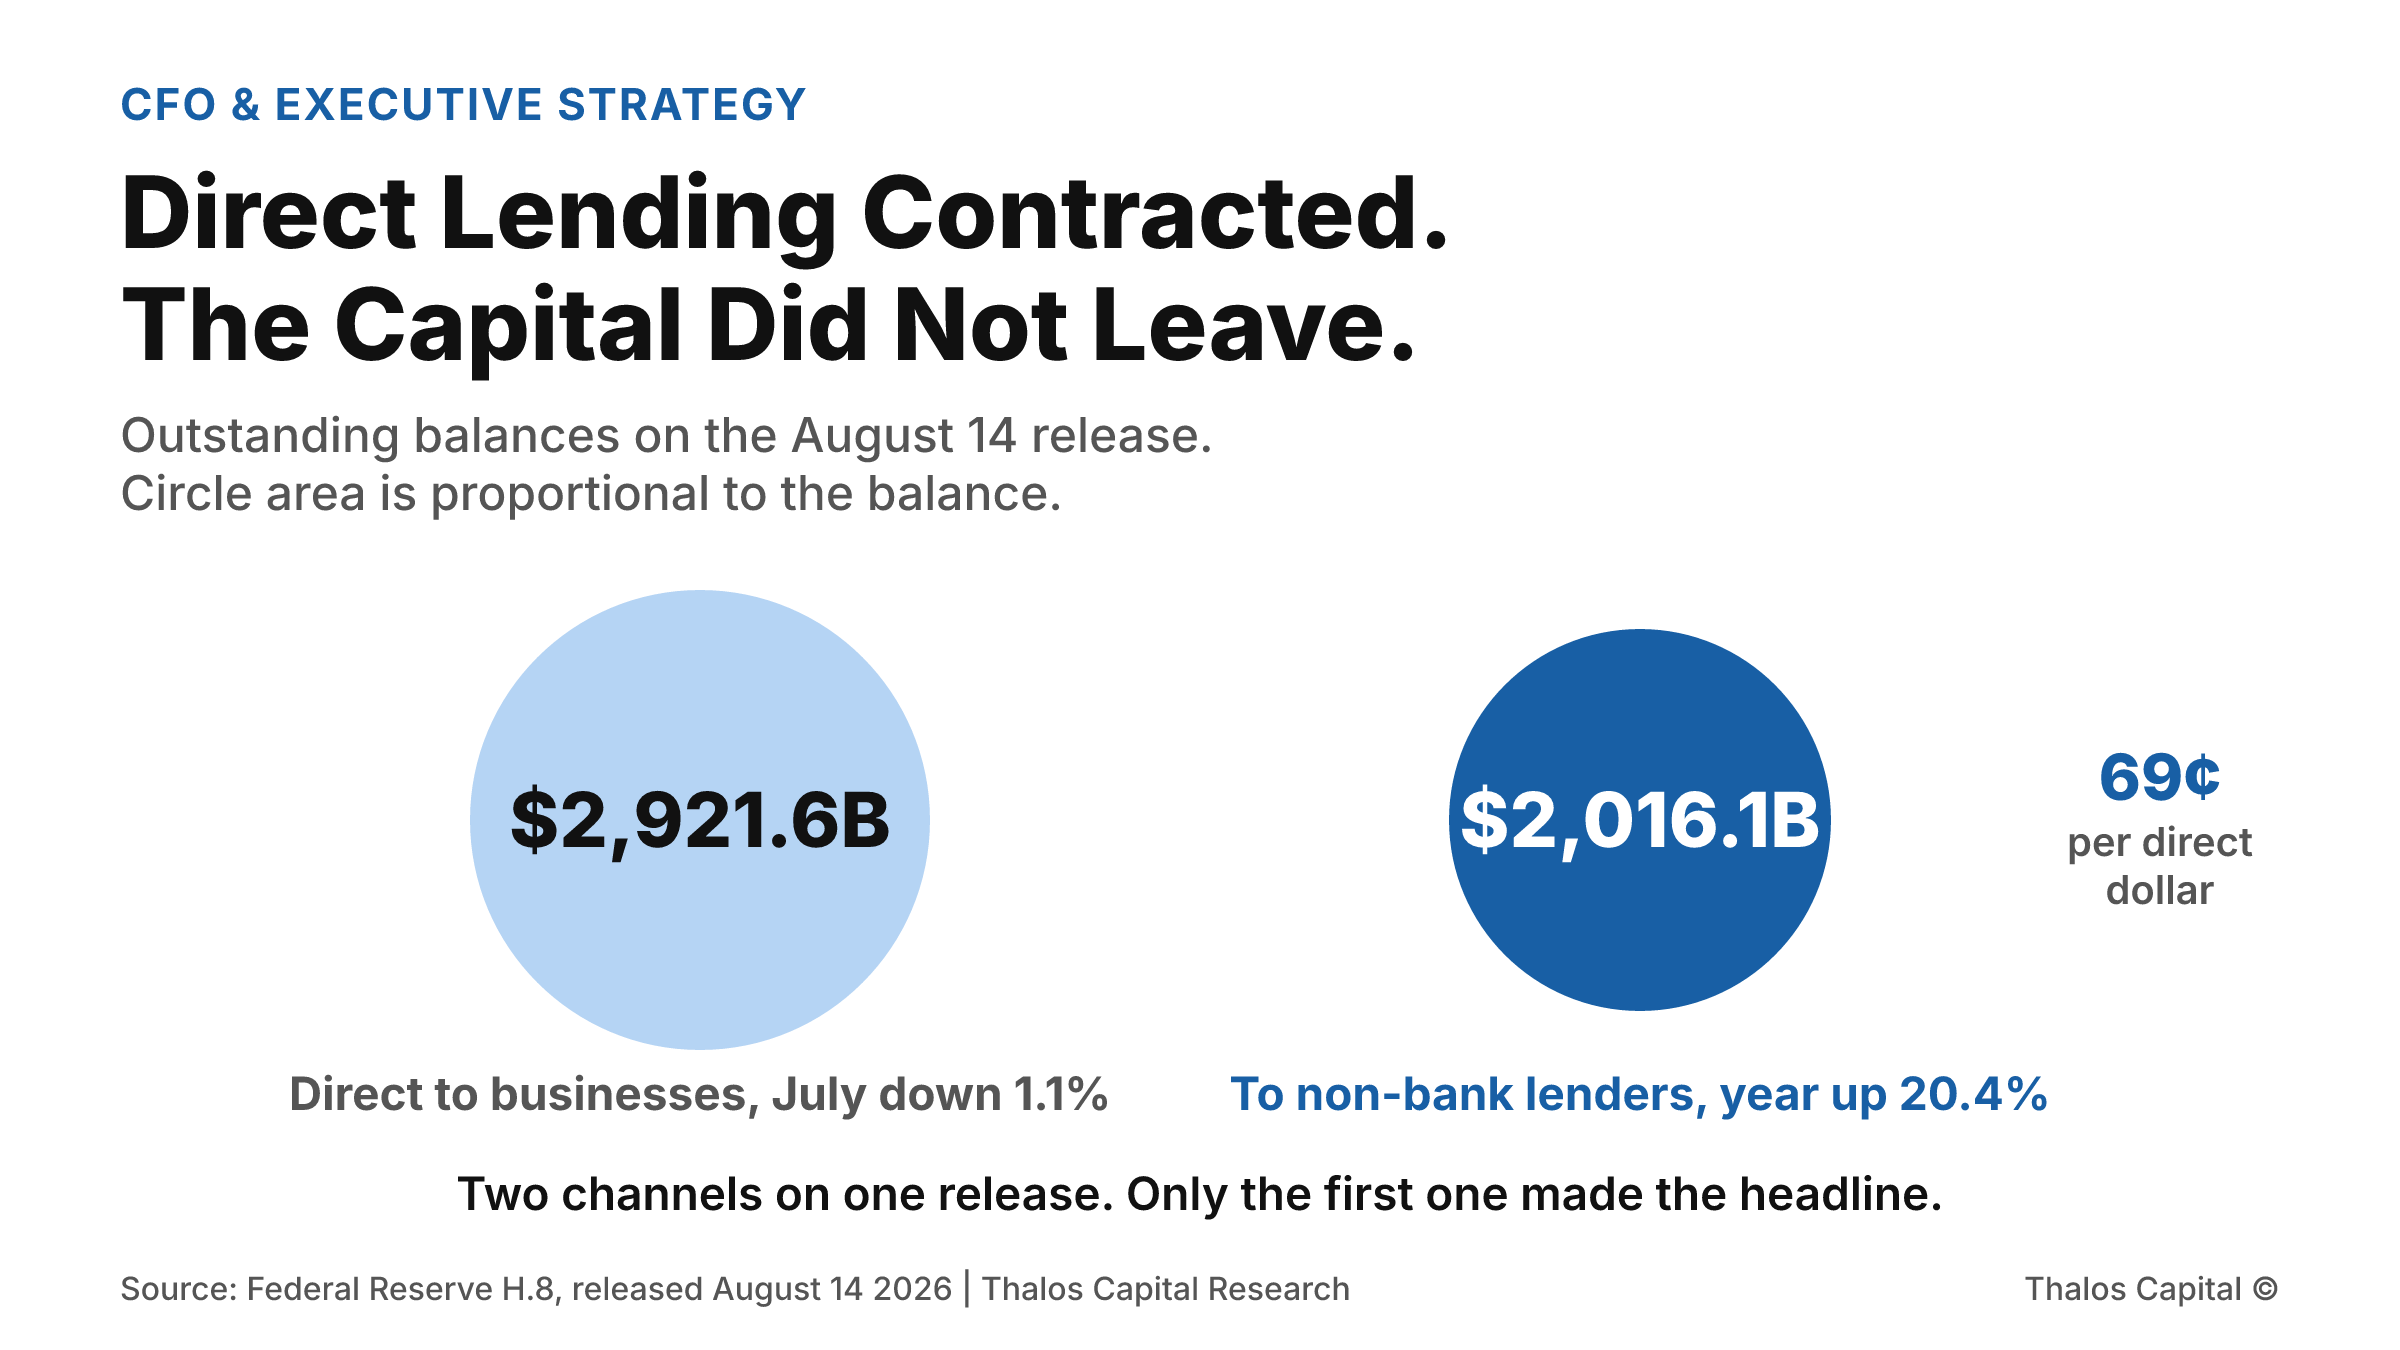
Two proportional circles comparing commercial and industrial loan balances of $2,921.6 billion, which contracted 1.1 percent annualized in July, against lending to non-depository financial institutions of $2,016.1 billion, up 20.4 percent on the year.

Direct Lending Contracted. The Capital Did Not Leave.

July brought the first contraction in commercial and industrial balances all year, at minus 1.1 percent annualized. Over the same stretch, lending to non-bank financial institutions reached $2,016.1 billion, up 20.4 percent.
Read More
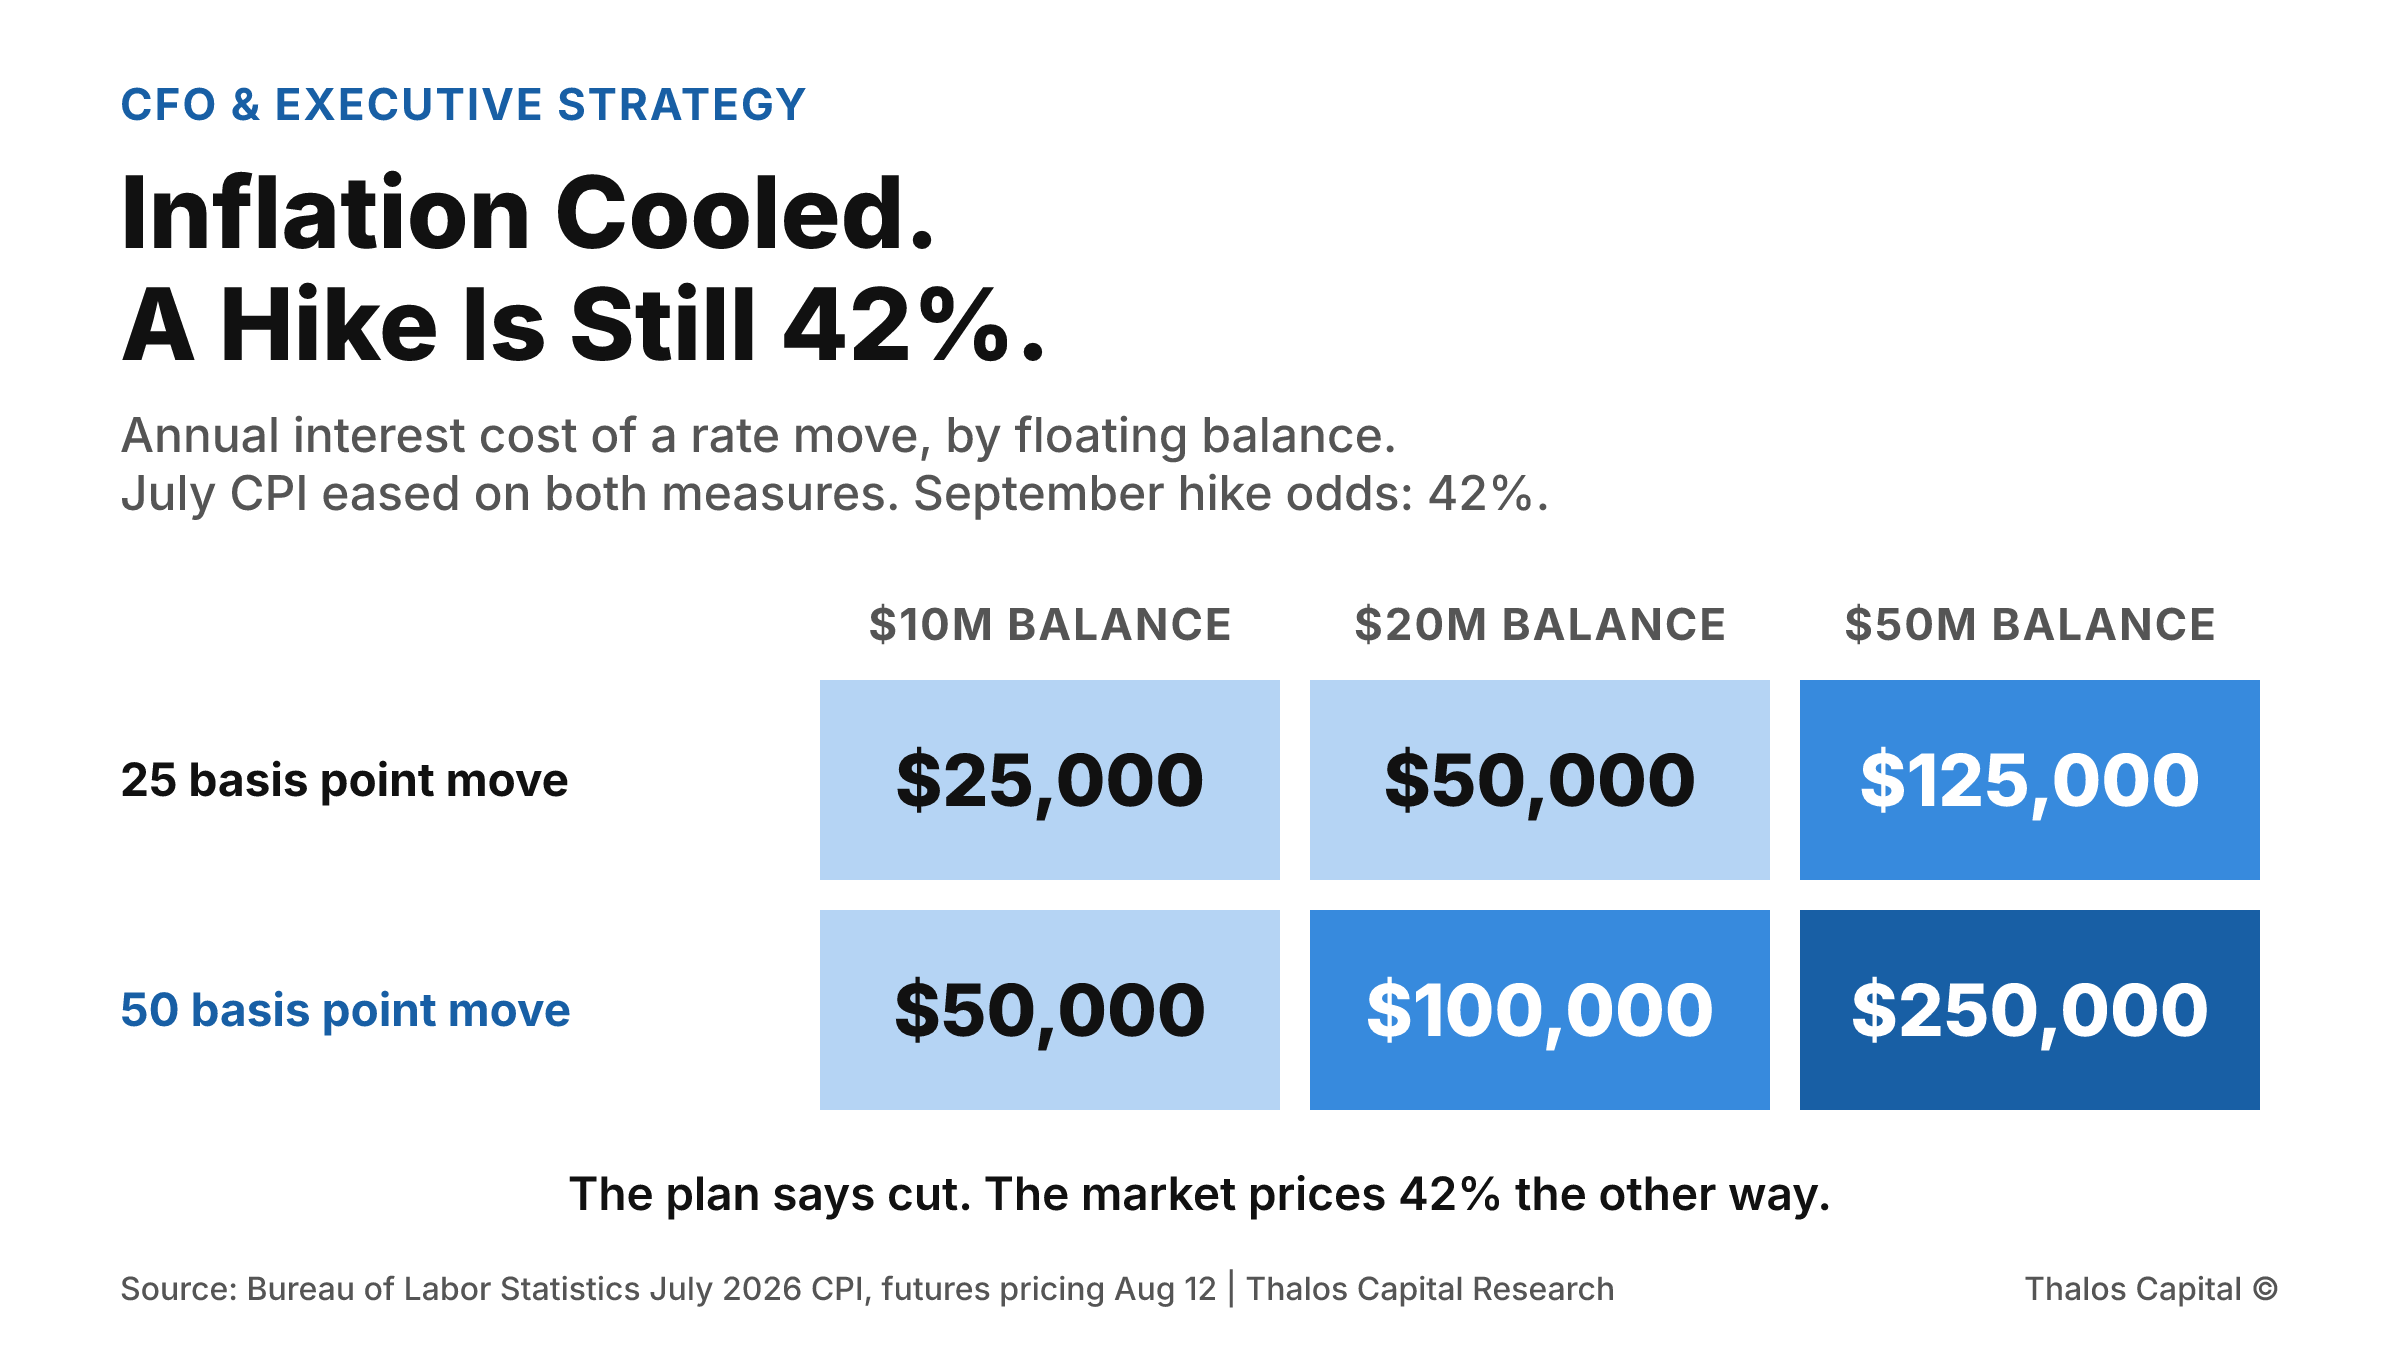
Shaded grid of the annual interest cost of a rate move across three floating balances: a 25 basis point move costs $25,000 on $10 million, $50,000 on $20 million and $125,000 on $50 million, and a 50 basis point move costs $50,000, $100,000 and $250,000 respectively.

Inflation Cooled. A Hike Is Still a 42 Percent Bet.

July CPI came in exactly as forecast, both measures eased, and Treasury yields fell across the board. Futures still priced a 42 percent chance of a September hike. What that asymmetry is worth on a floating balance.
Read More
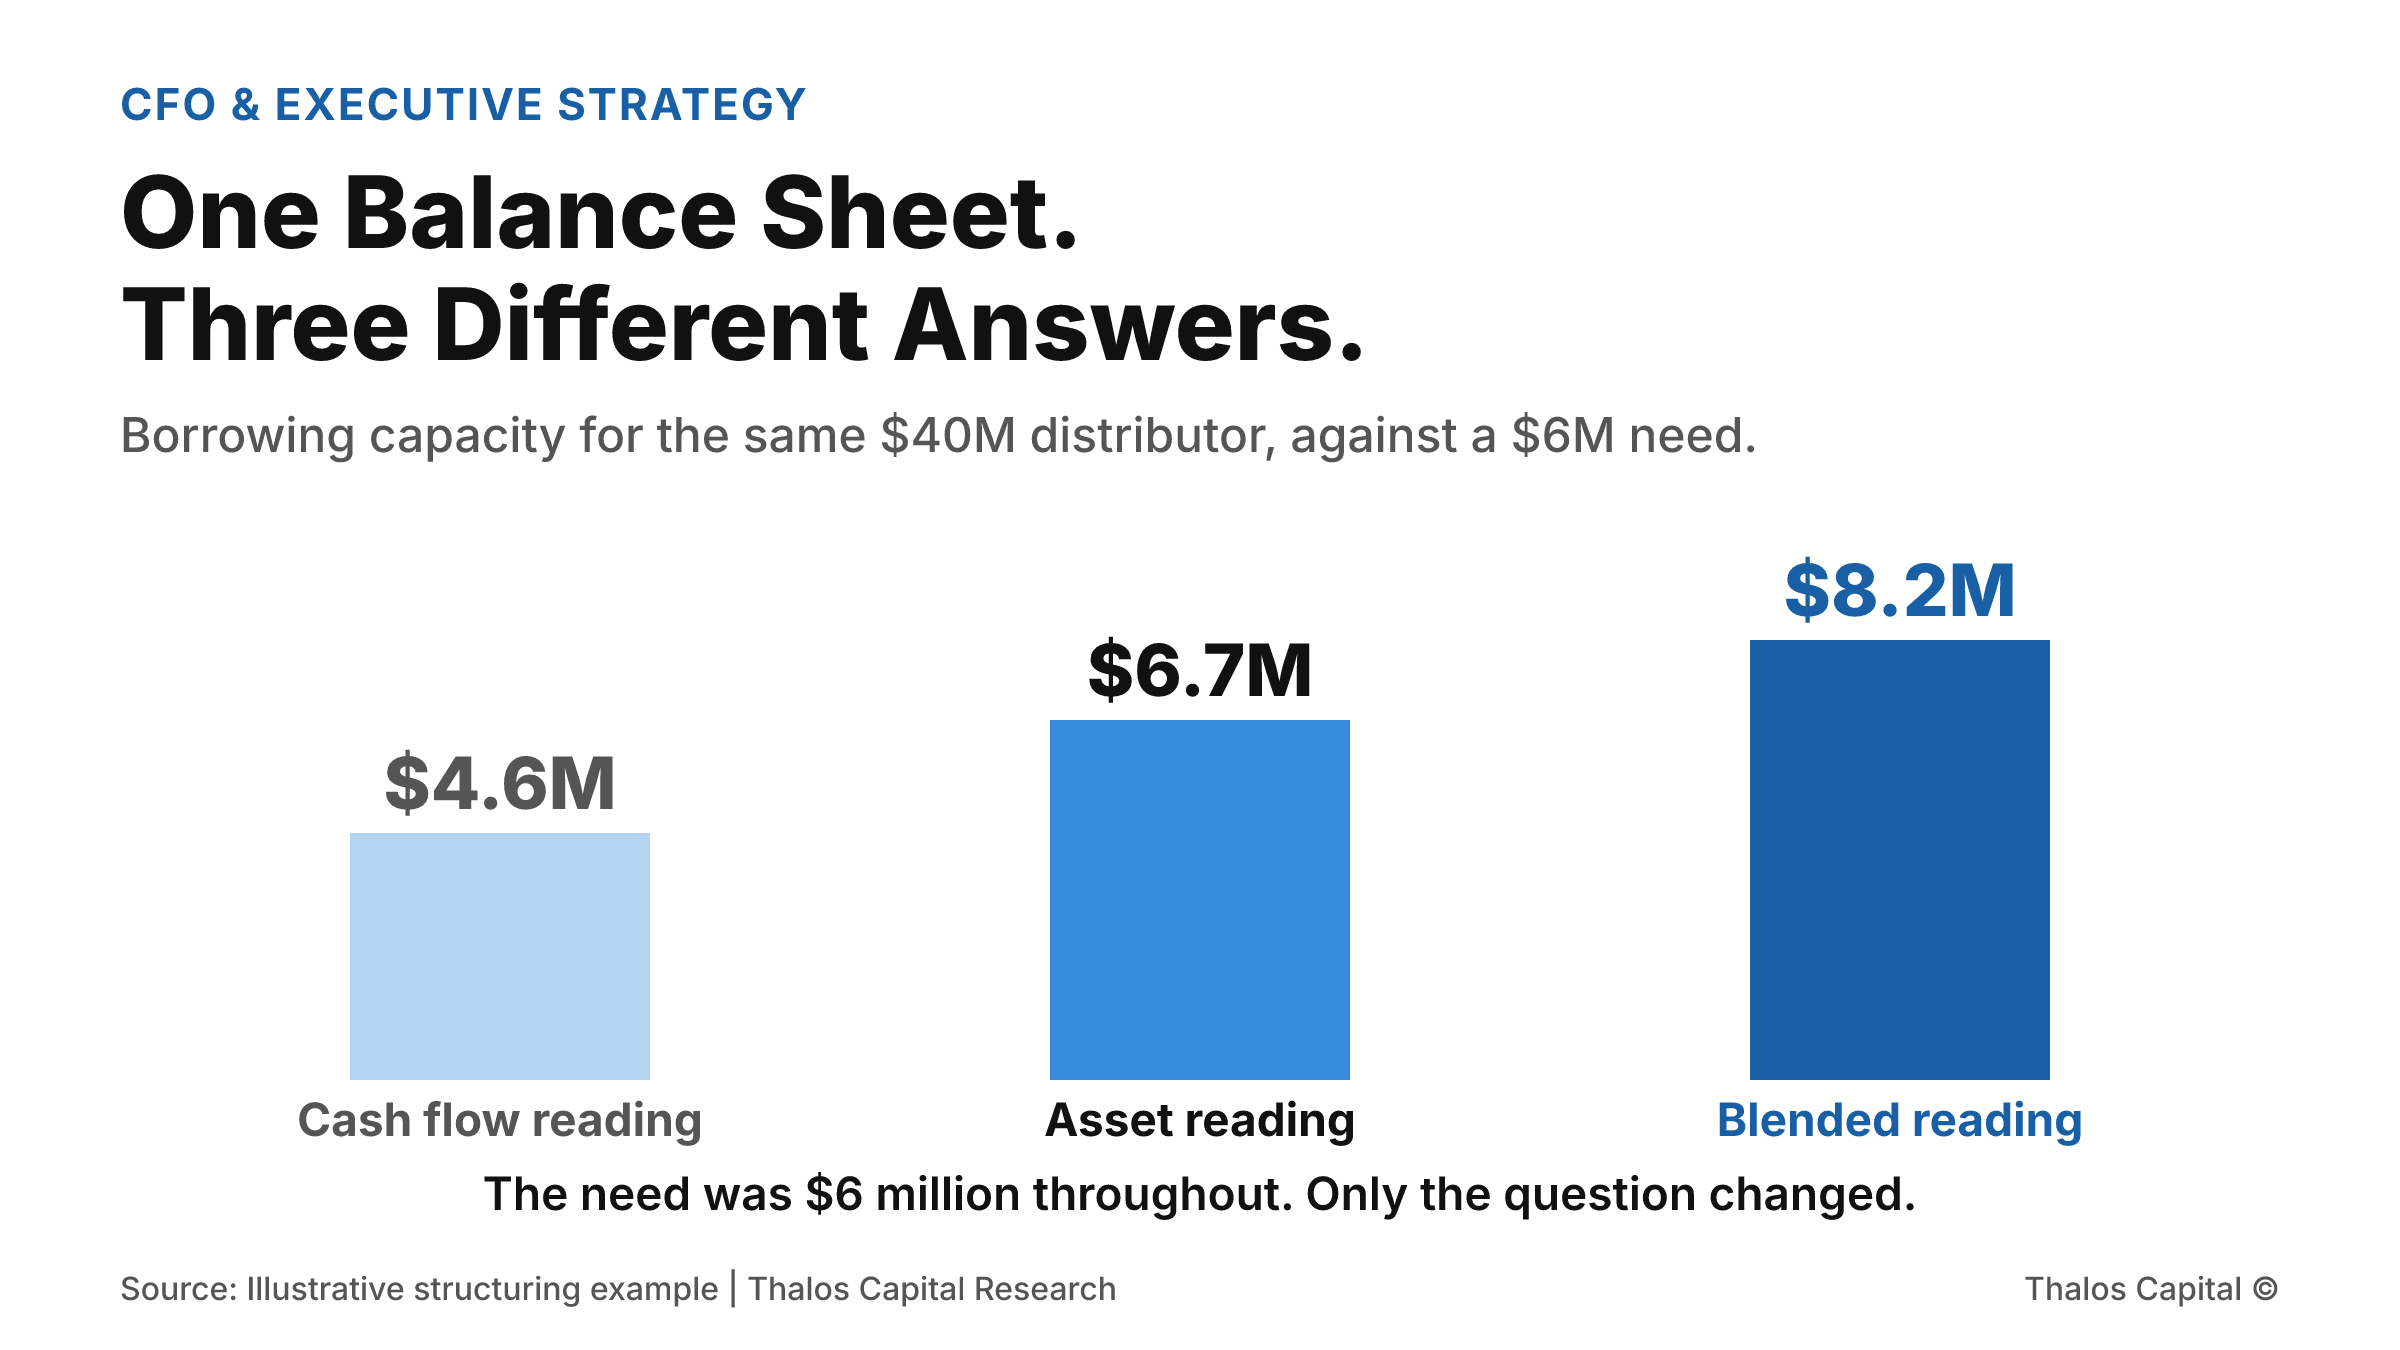
Column chart showing three borrowing capacity readings for the same distributor: $4.6 million on a cash flow reading, $6.7 million on an asset reading, and $8.2 million on a blended reading shown in the darkest navy, against a $6 million financing need.

One Balance Sheet. Three Different Answers.

A distributor doing $40 million in revenue needs $6 million. Read against cash flow it is short. Read against its assets it clears. Read as a blend it borrows $8.2 million. Same company, same week, three answers.
Read More
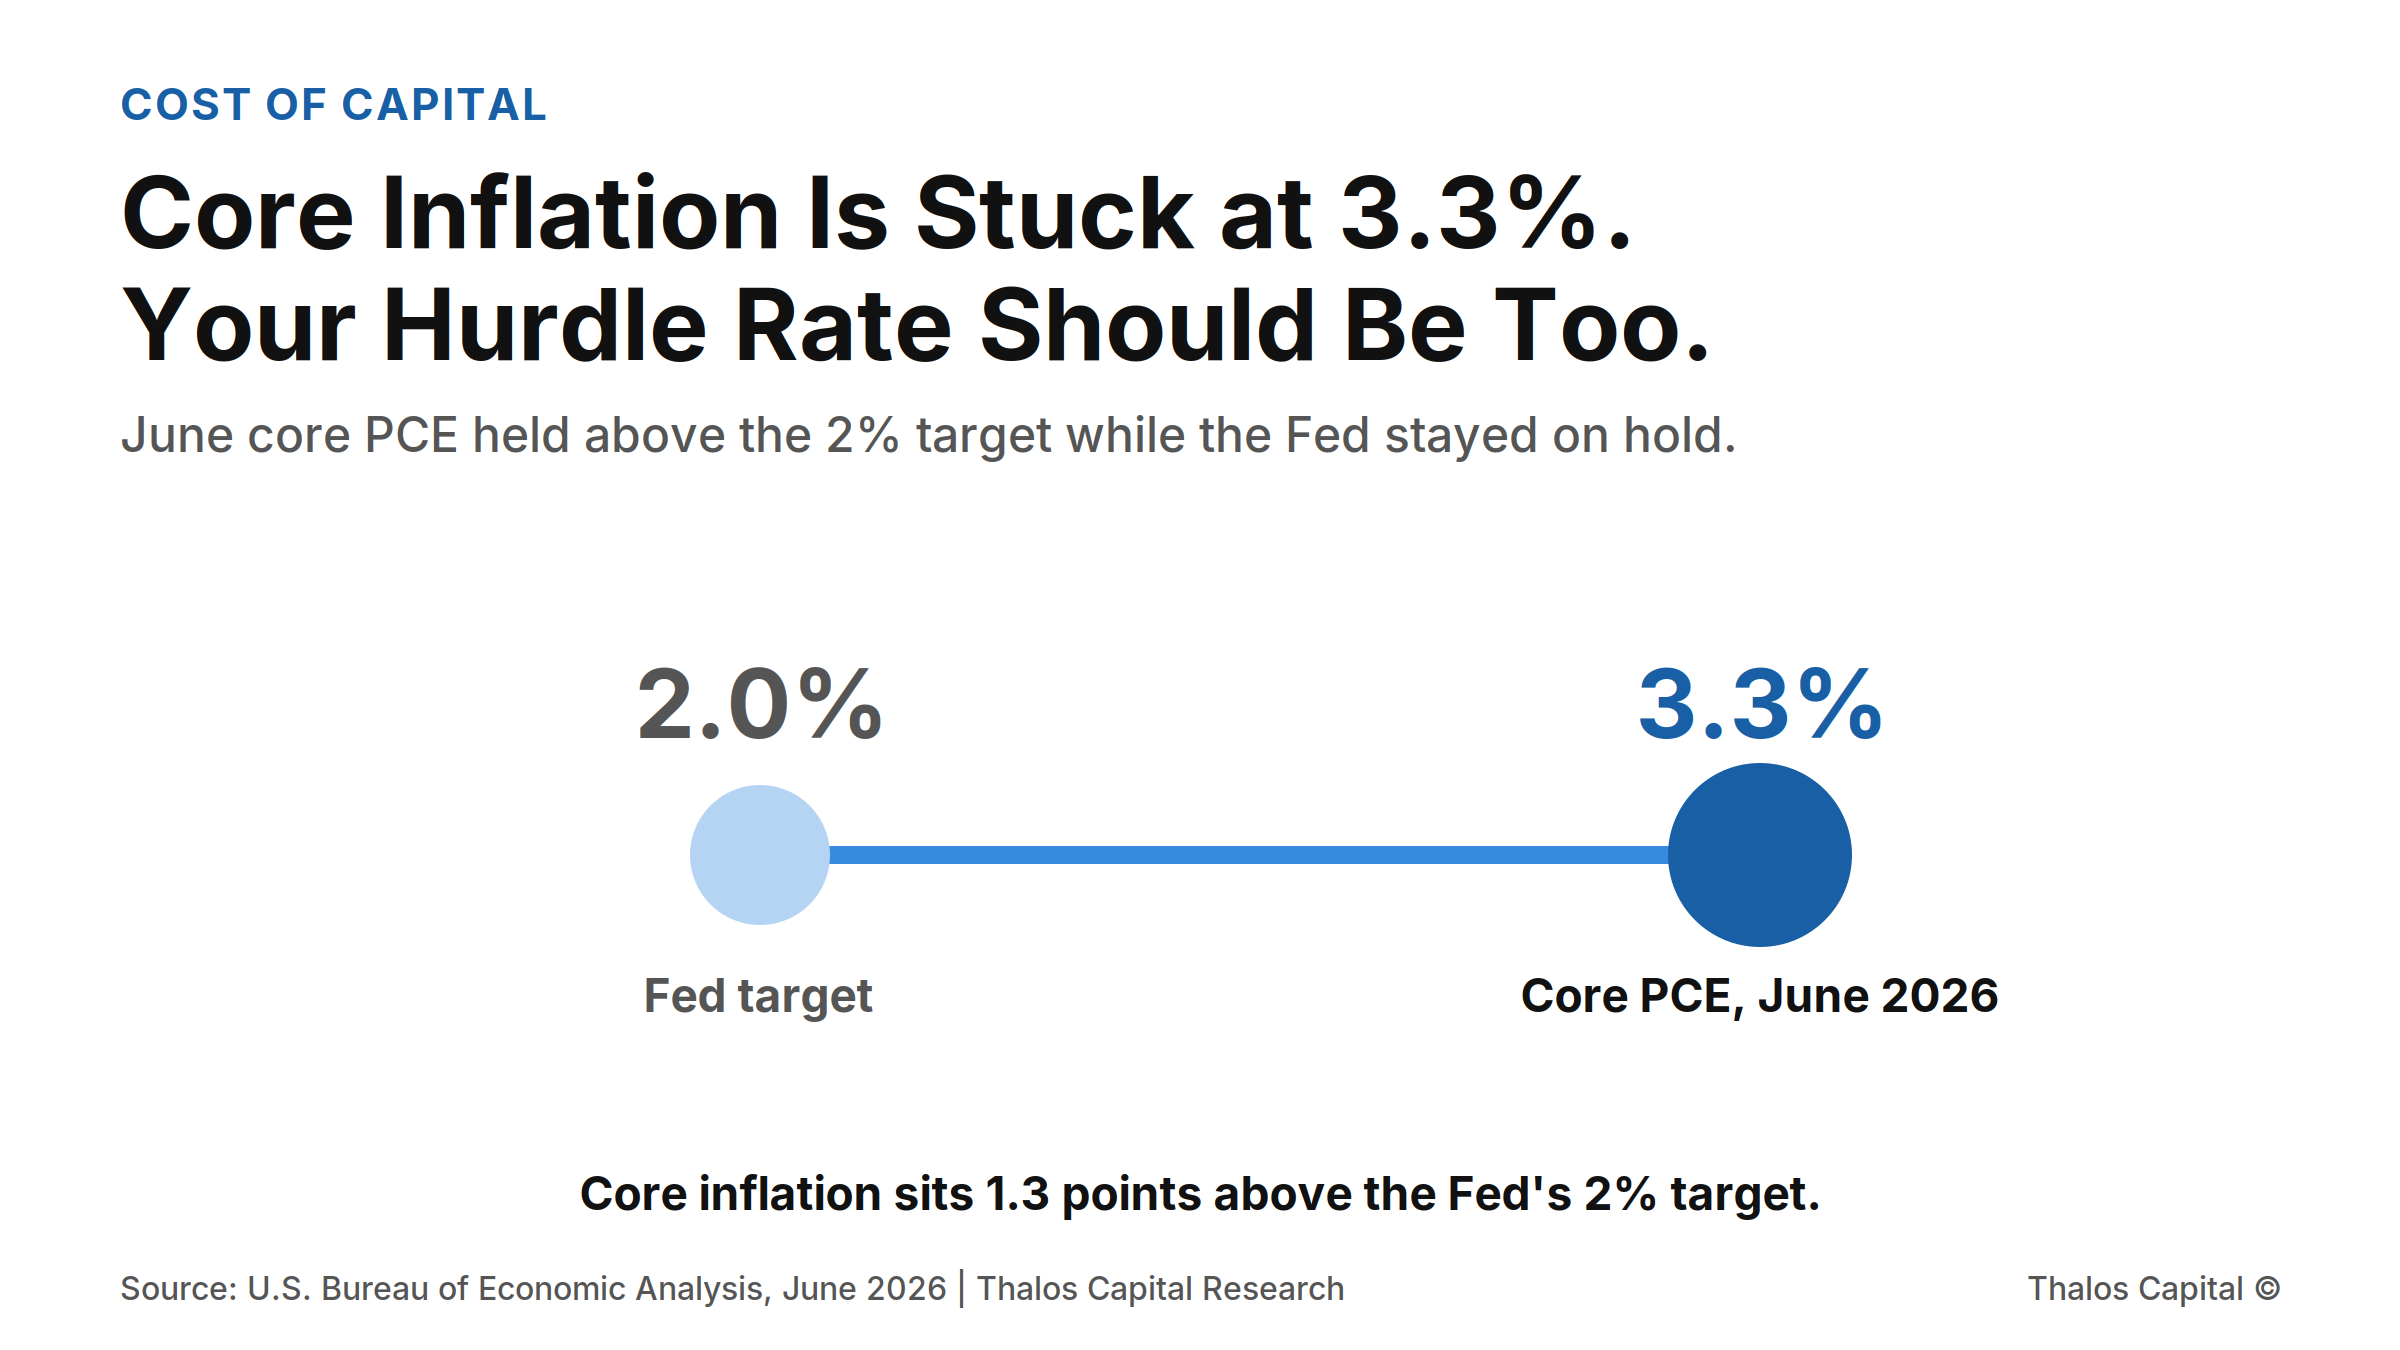
Dumbbell chart contrasting the Federal Reserve's 2 percent inflation target with June 2026 core PCE at 3.3 percent, a gap of 1.3 points, with the 3.3 percent marker shown in navy.

Core Inflation Is Stuck at 3.3 Percent. Your Hurdle Rate Should Be Too.

June core PCE held at 3.3 percent, still above the Fed's 2 percent target, while the policy rate stayed at 3.50 to 3.75 percent. Why a capital plan priced to a 2 percent world mismatches the cost of capital lenders are quoting today.
Read More
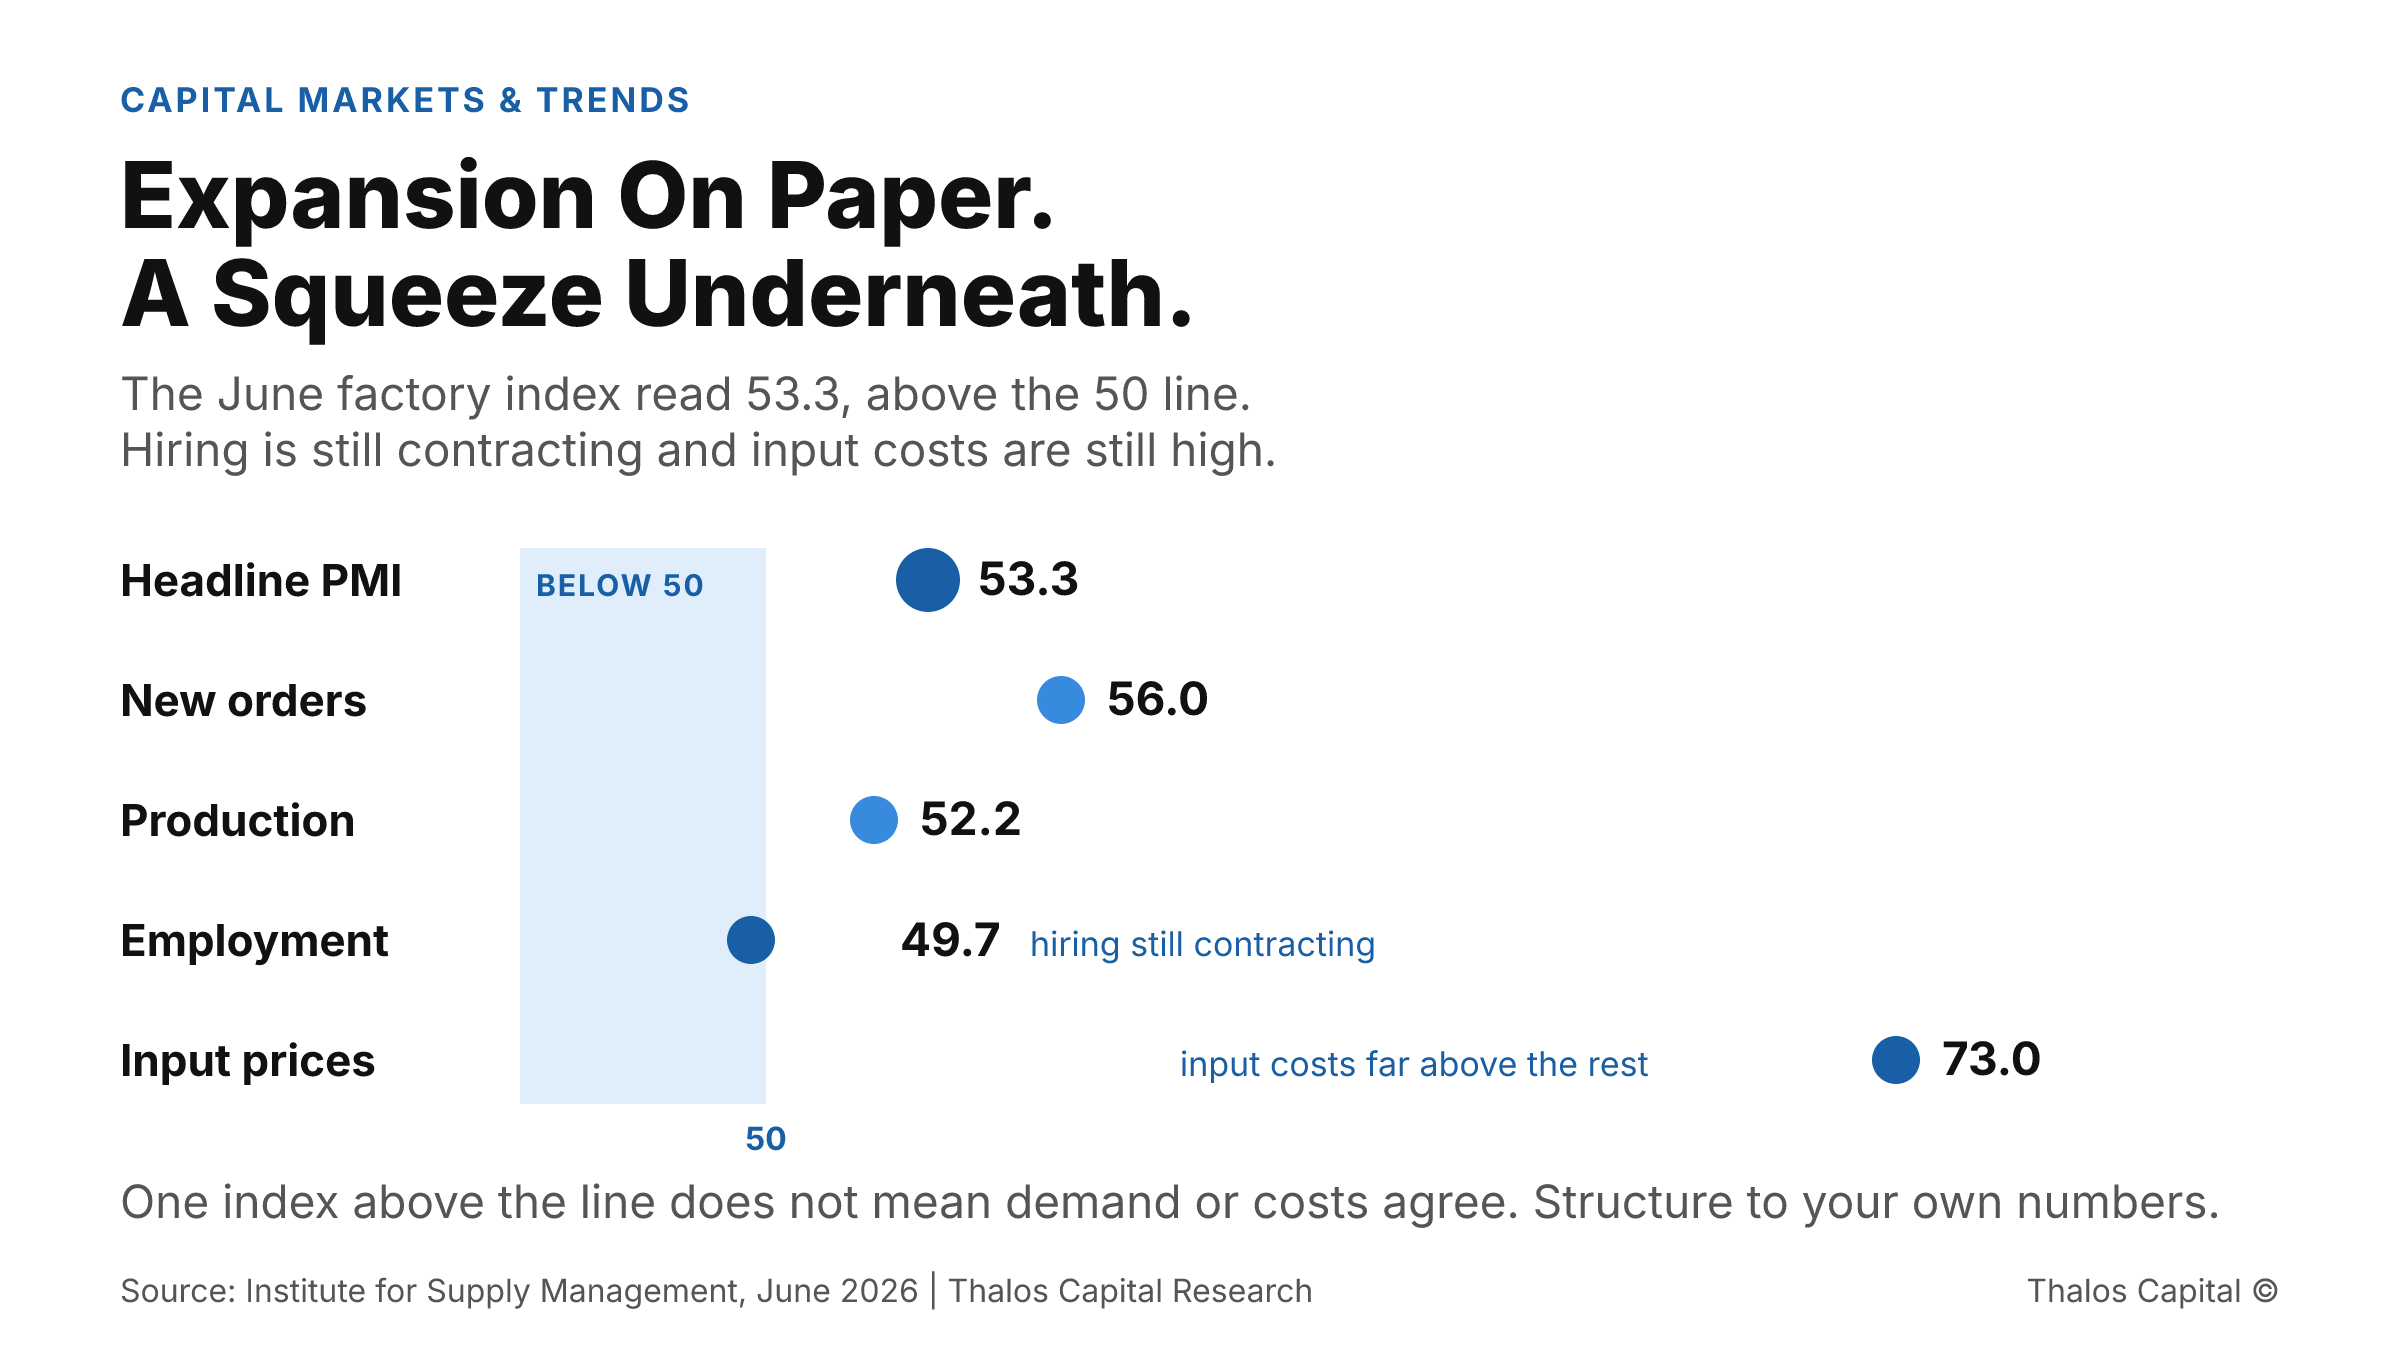
Dot plot of June 2026 factory index components showing headline PMI at 53.3 above the 50 line while employment sits at 49.7 in contraction and input prices at 73.0 remain elevated.

Expansion On Paper. A Squeeze Underneath.

A factory index above 50 reads as a growth signal, but hiring is still contracting and input costs are still high. Why financing sized to the headline misreads a margin story as a volume story.
Read More
Working through a financing decision?
Insights are a starting point. A conversation maps your actual options.
Tell us what you are financing and we will map the structures and sources that fit.
Submit your financing request →
Explore our financing solutions
Equipment FinancingWorking CapitalAsset-Based LendingStrategic Debt