Tag

asset-based lending

18 insights

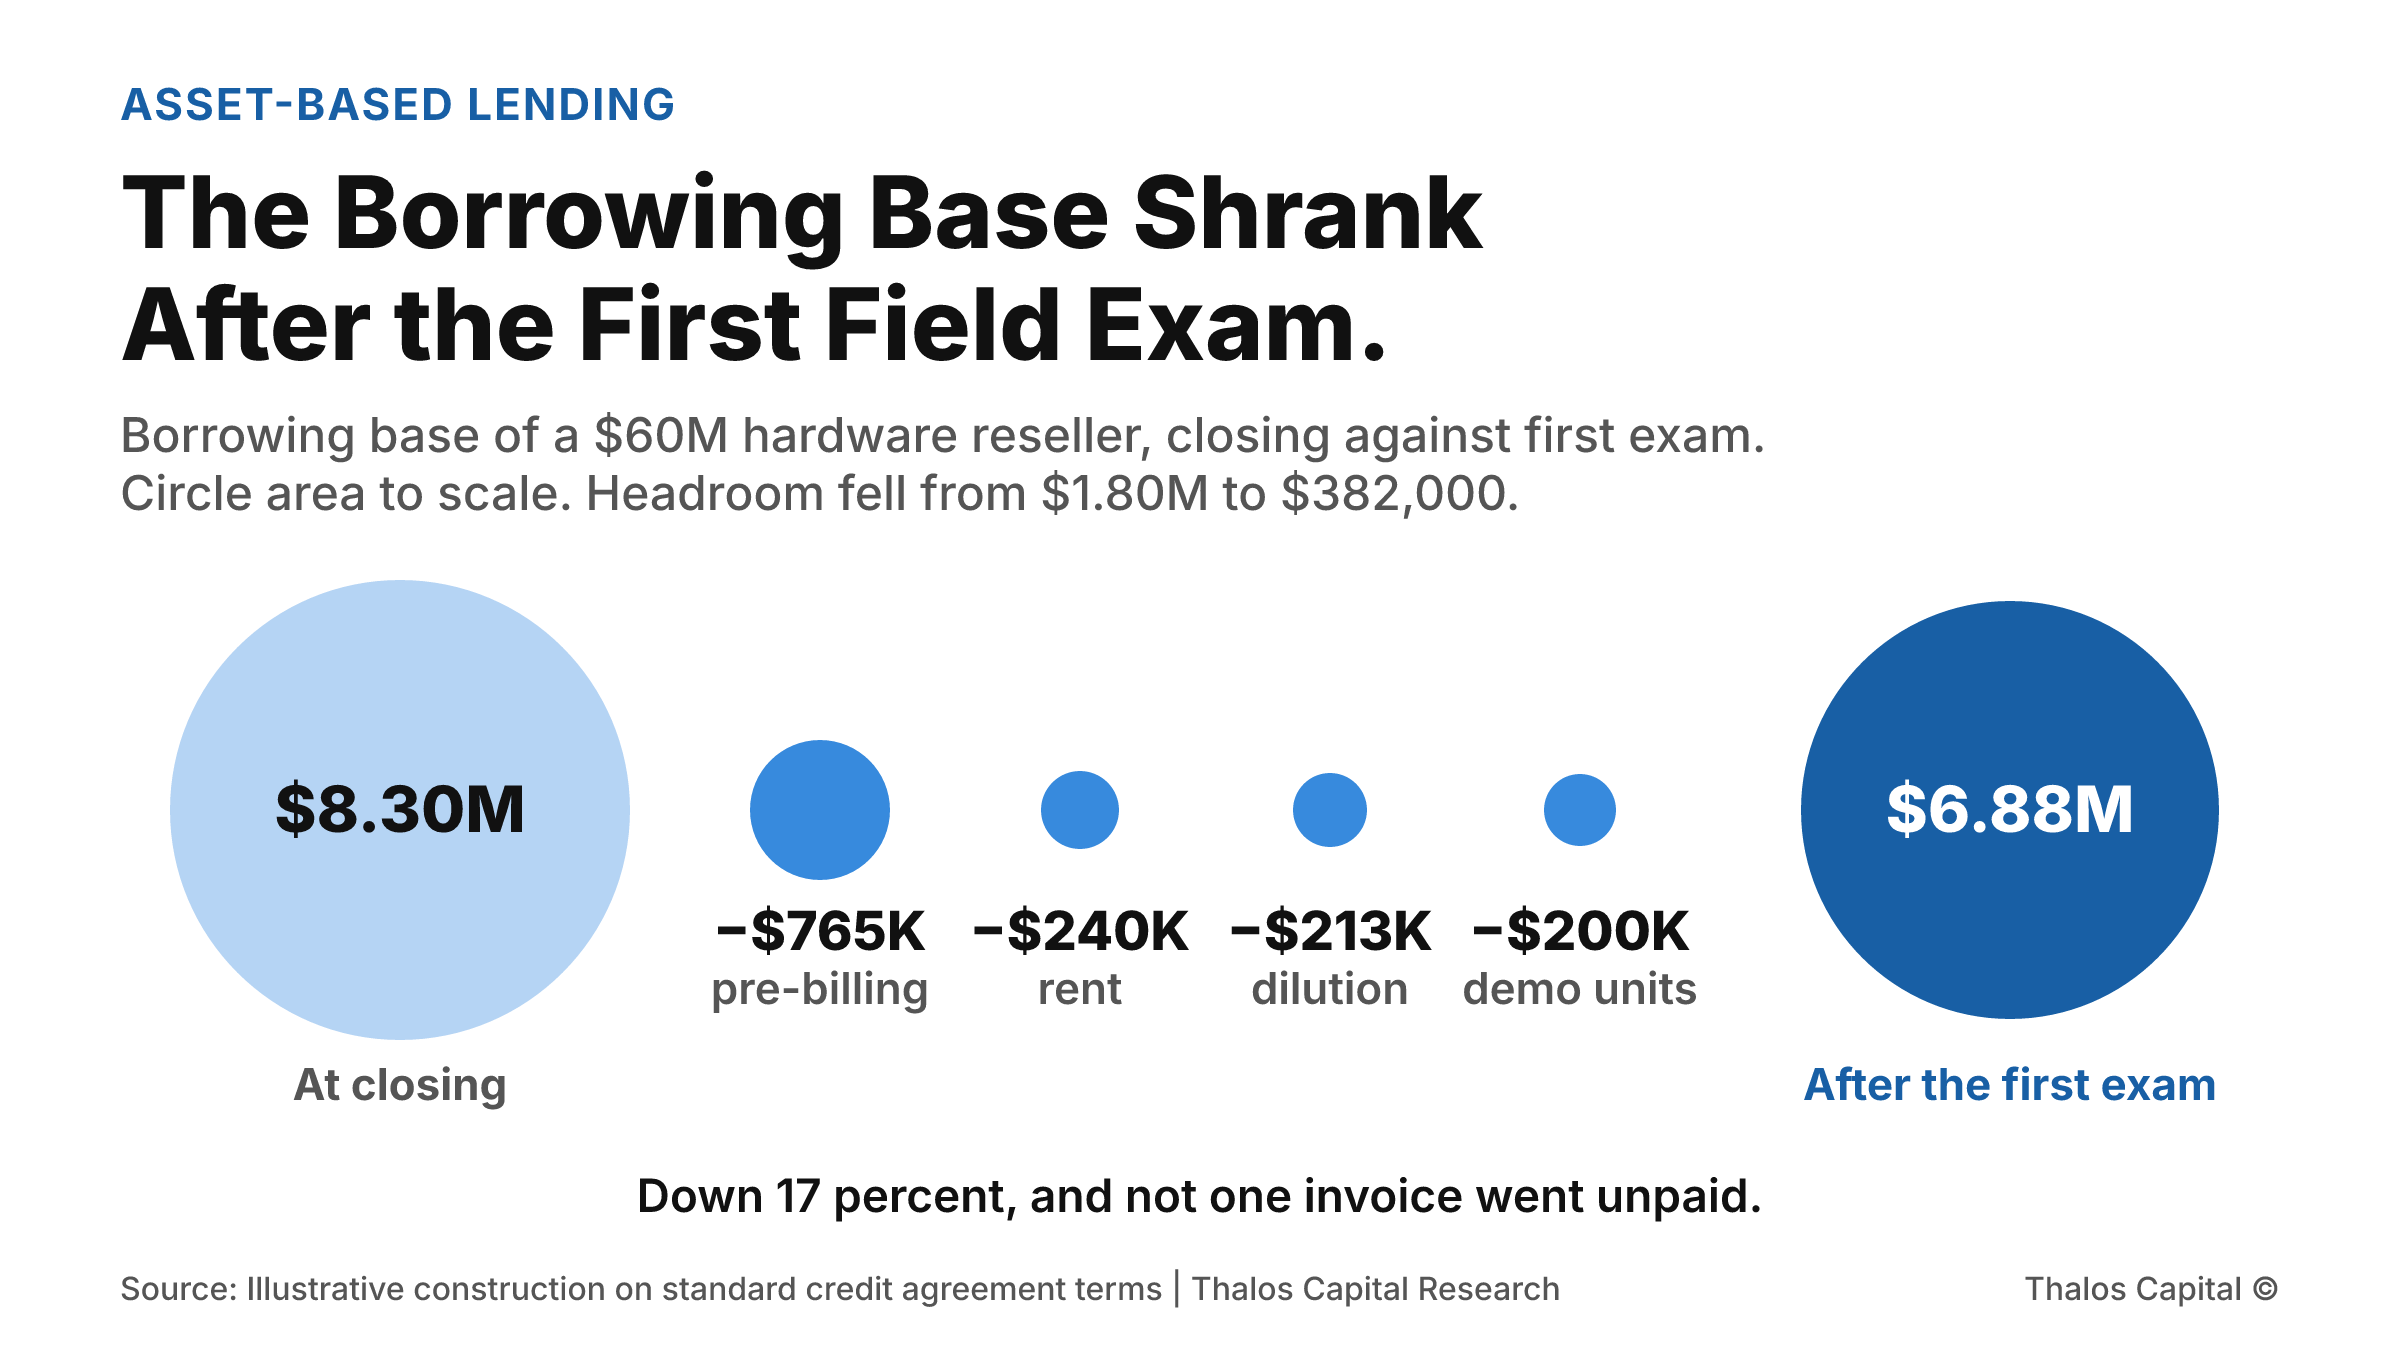
Proportional circles showing a borrowing base of $8.30 million at closing and $6.88 million after the first field exam, with four smaller circles for the adjustments between them: $765,000 of pre-billed invoices, $240,000 of rent reserve, $213,000 from excess dilution and $200,000 of demo units.

The Borrowing Base Shrank After the First Field Exam

A $60 million hardware reseller closed an asset-based line on an $8.30 million borrowing base. The first field exam tested the same collateral and found $6.88 million, and planned headroom of $1.80 million fell to $382,000.
Read More
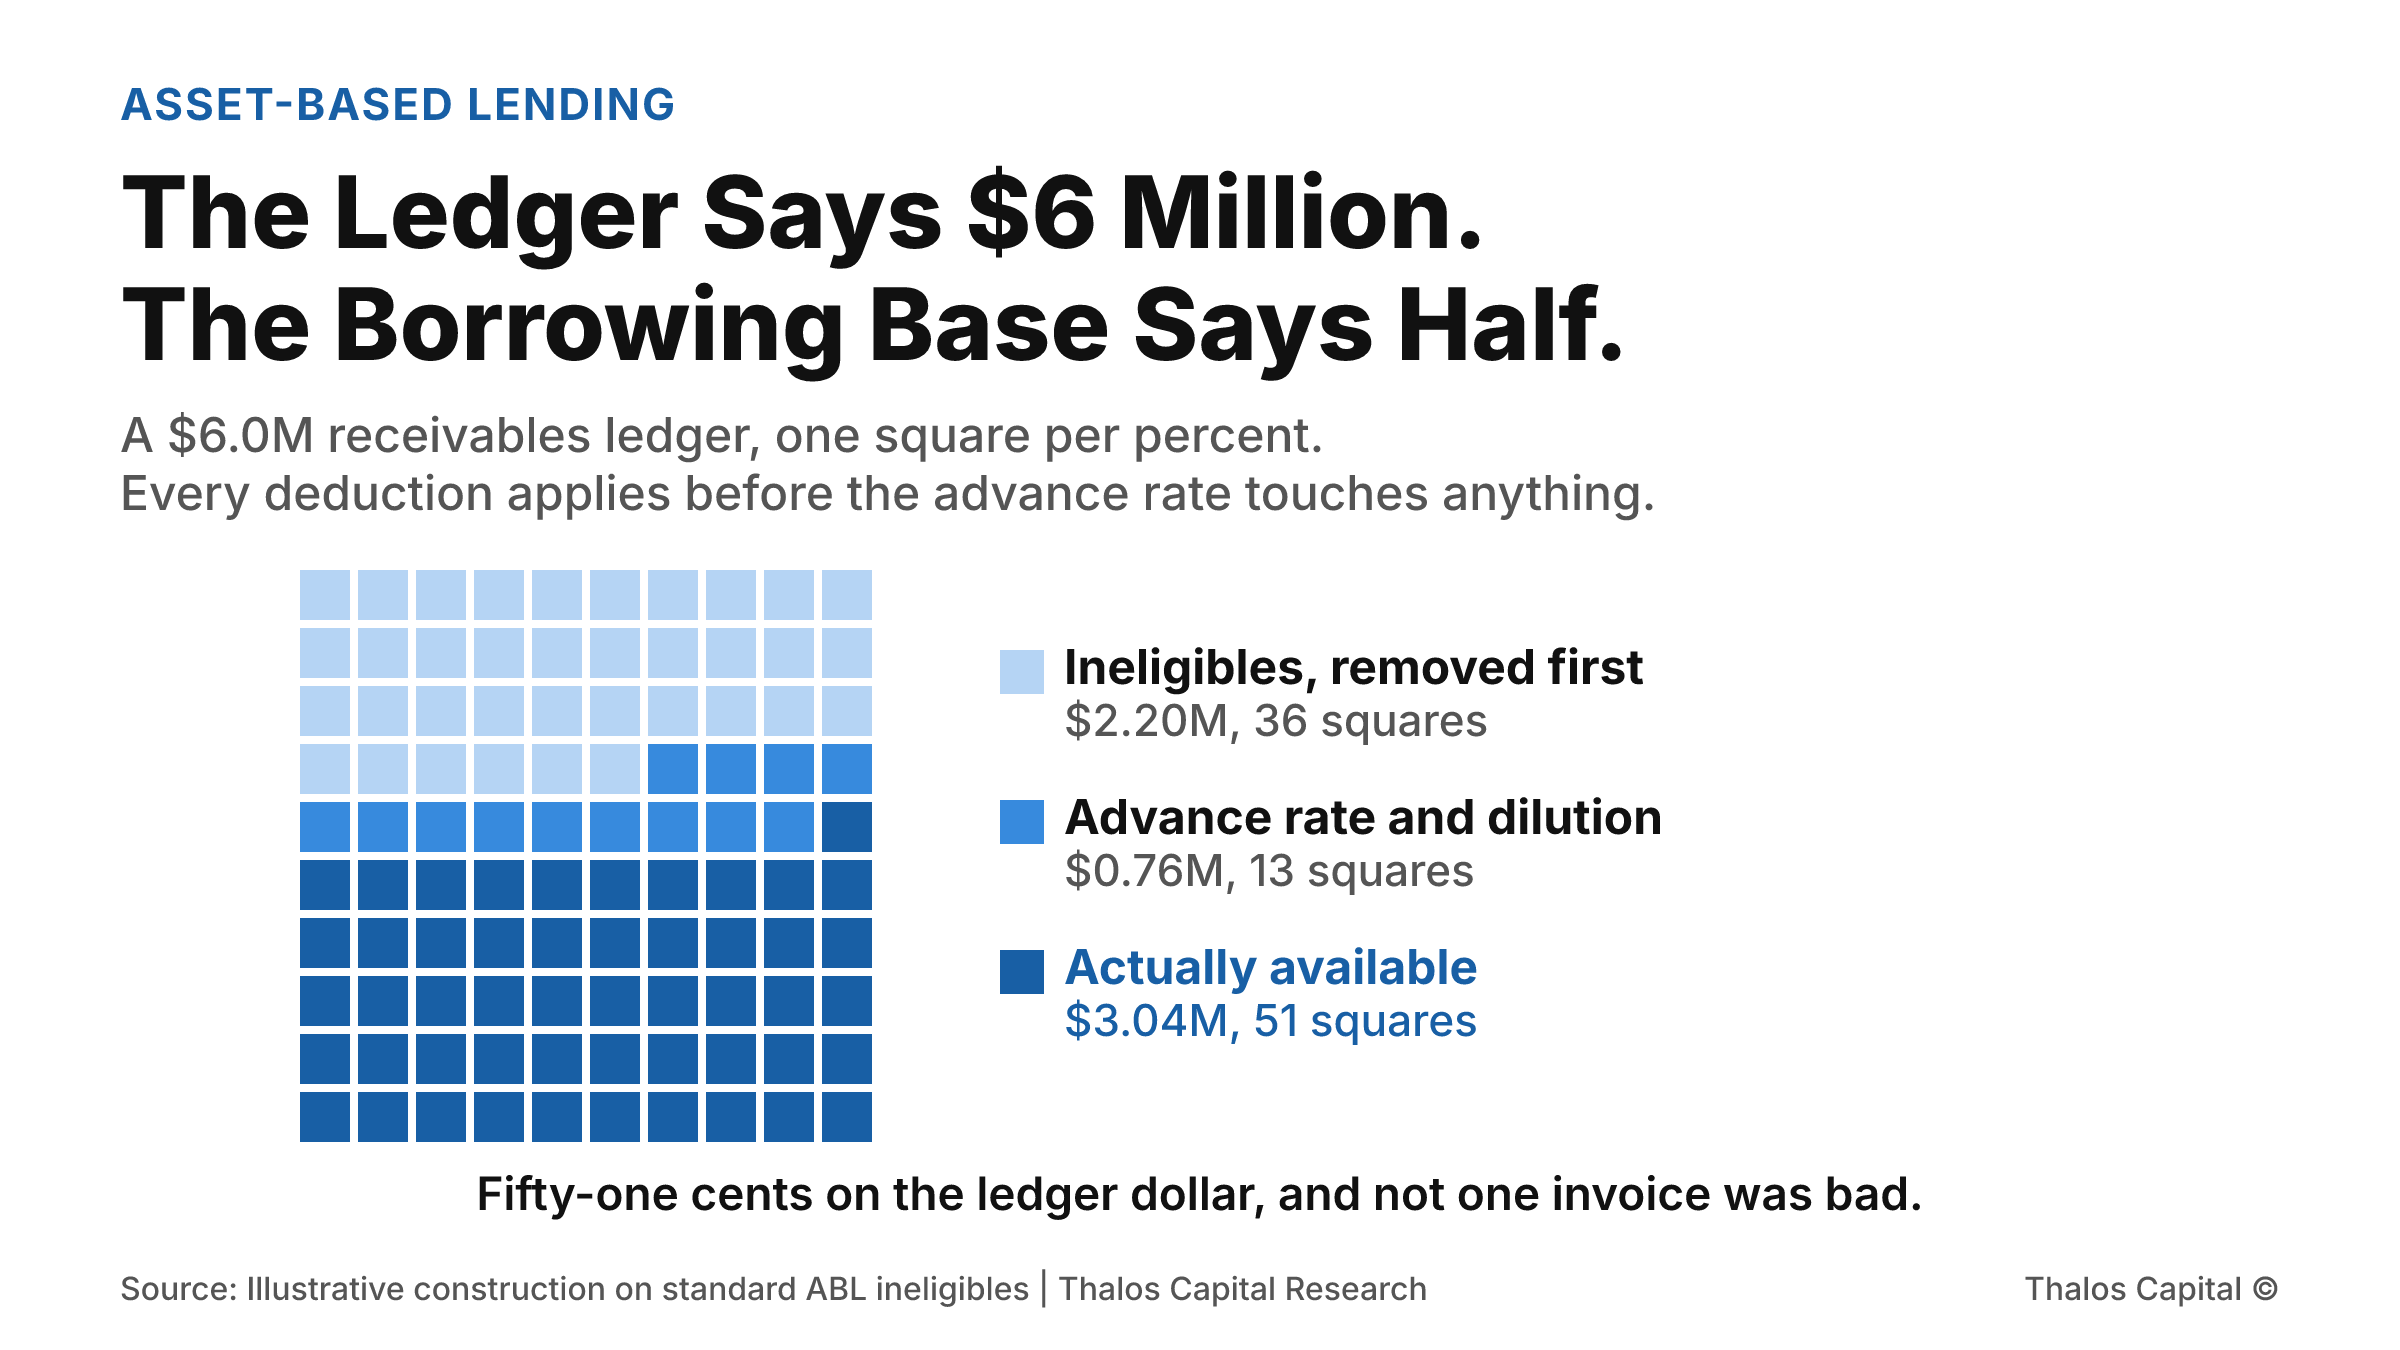
A hundred-square waffle of a $6 million receivables ledger showing 36 squares removed as ineligibles, 13 squares taken by the advance rate and dilution reserve, and 51 squares of actual availability at $3.04 million.

The Ledger Says $6 Million. The Borrowing Base Says Half.

Advance rate is the number every borrower asks about and the last one applied. Before it touches anything, the ineligibles come out, and on a $6 million receivables ledger they can remove $2.2 million without a single invoice being bad.
Read More
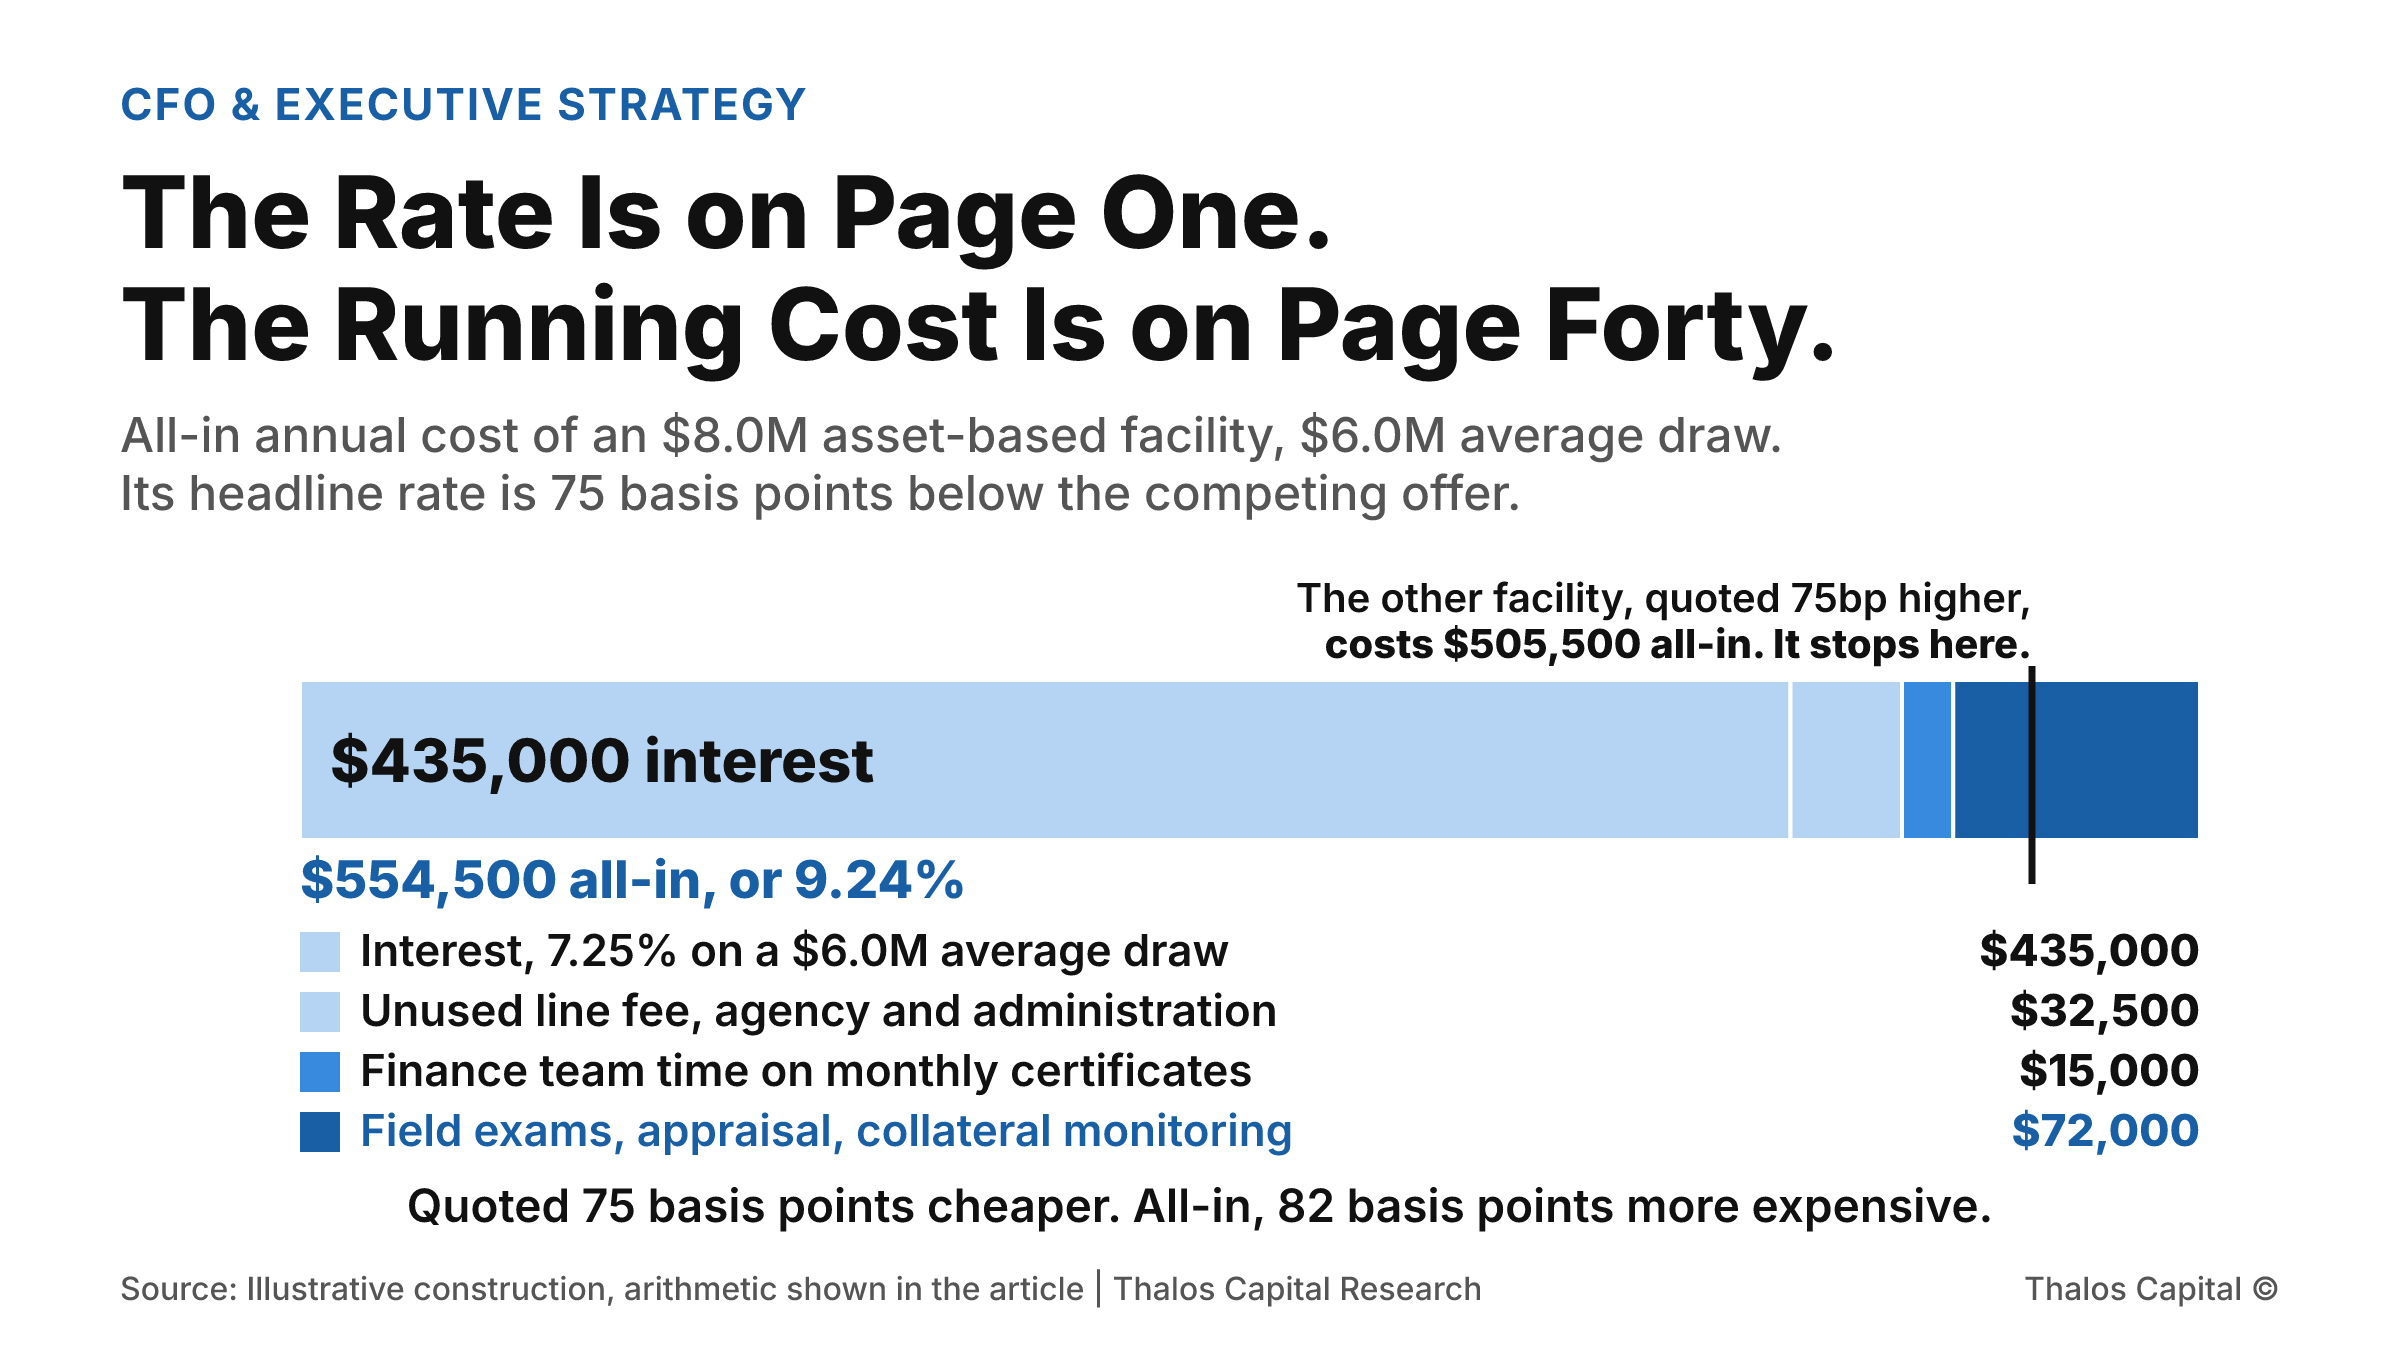
A single stacked bar of the all-in annual cost of an $8.0 million asset-based facility at a $6.0 million average draw, totalling $554,500, with a marker showing that a competing facility quoted 75 basis points higher costs $505,500 all-in.

The Rate Is on Page One. The Running Cost Is on Page Forty.

Two facilities quoted 75 basis points apart. Once field exams, appraisals, collateral monitoring and the finance team's own hours are counted, the cheaper-looking one costs 82 basis points more to run. The gap reverses entirely.
Read More
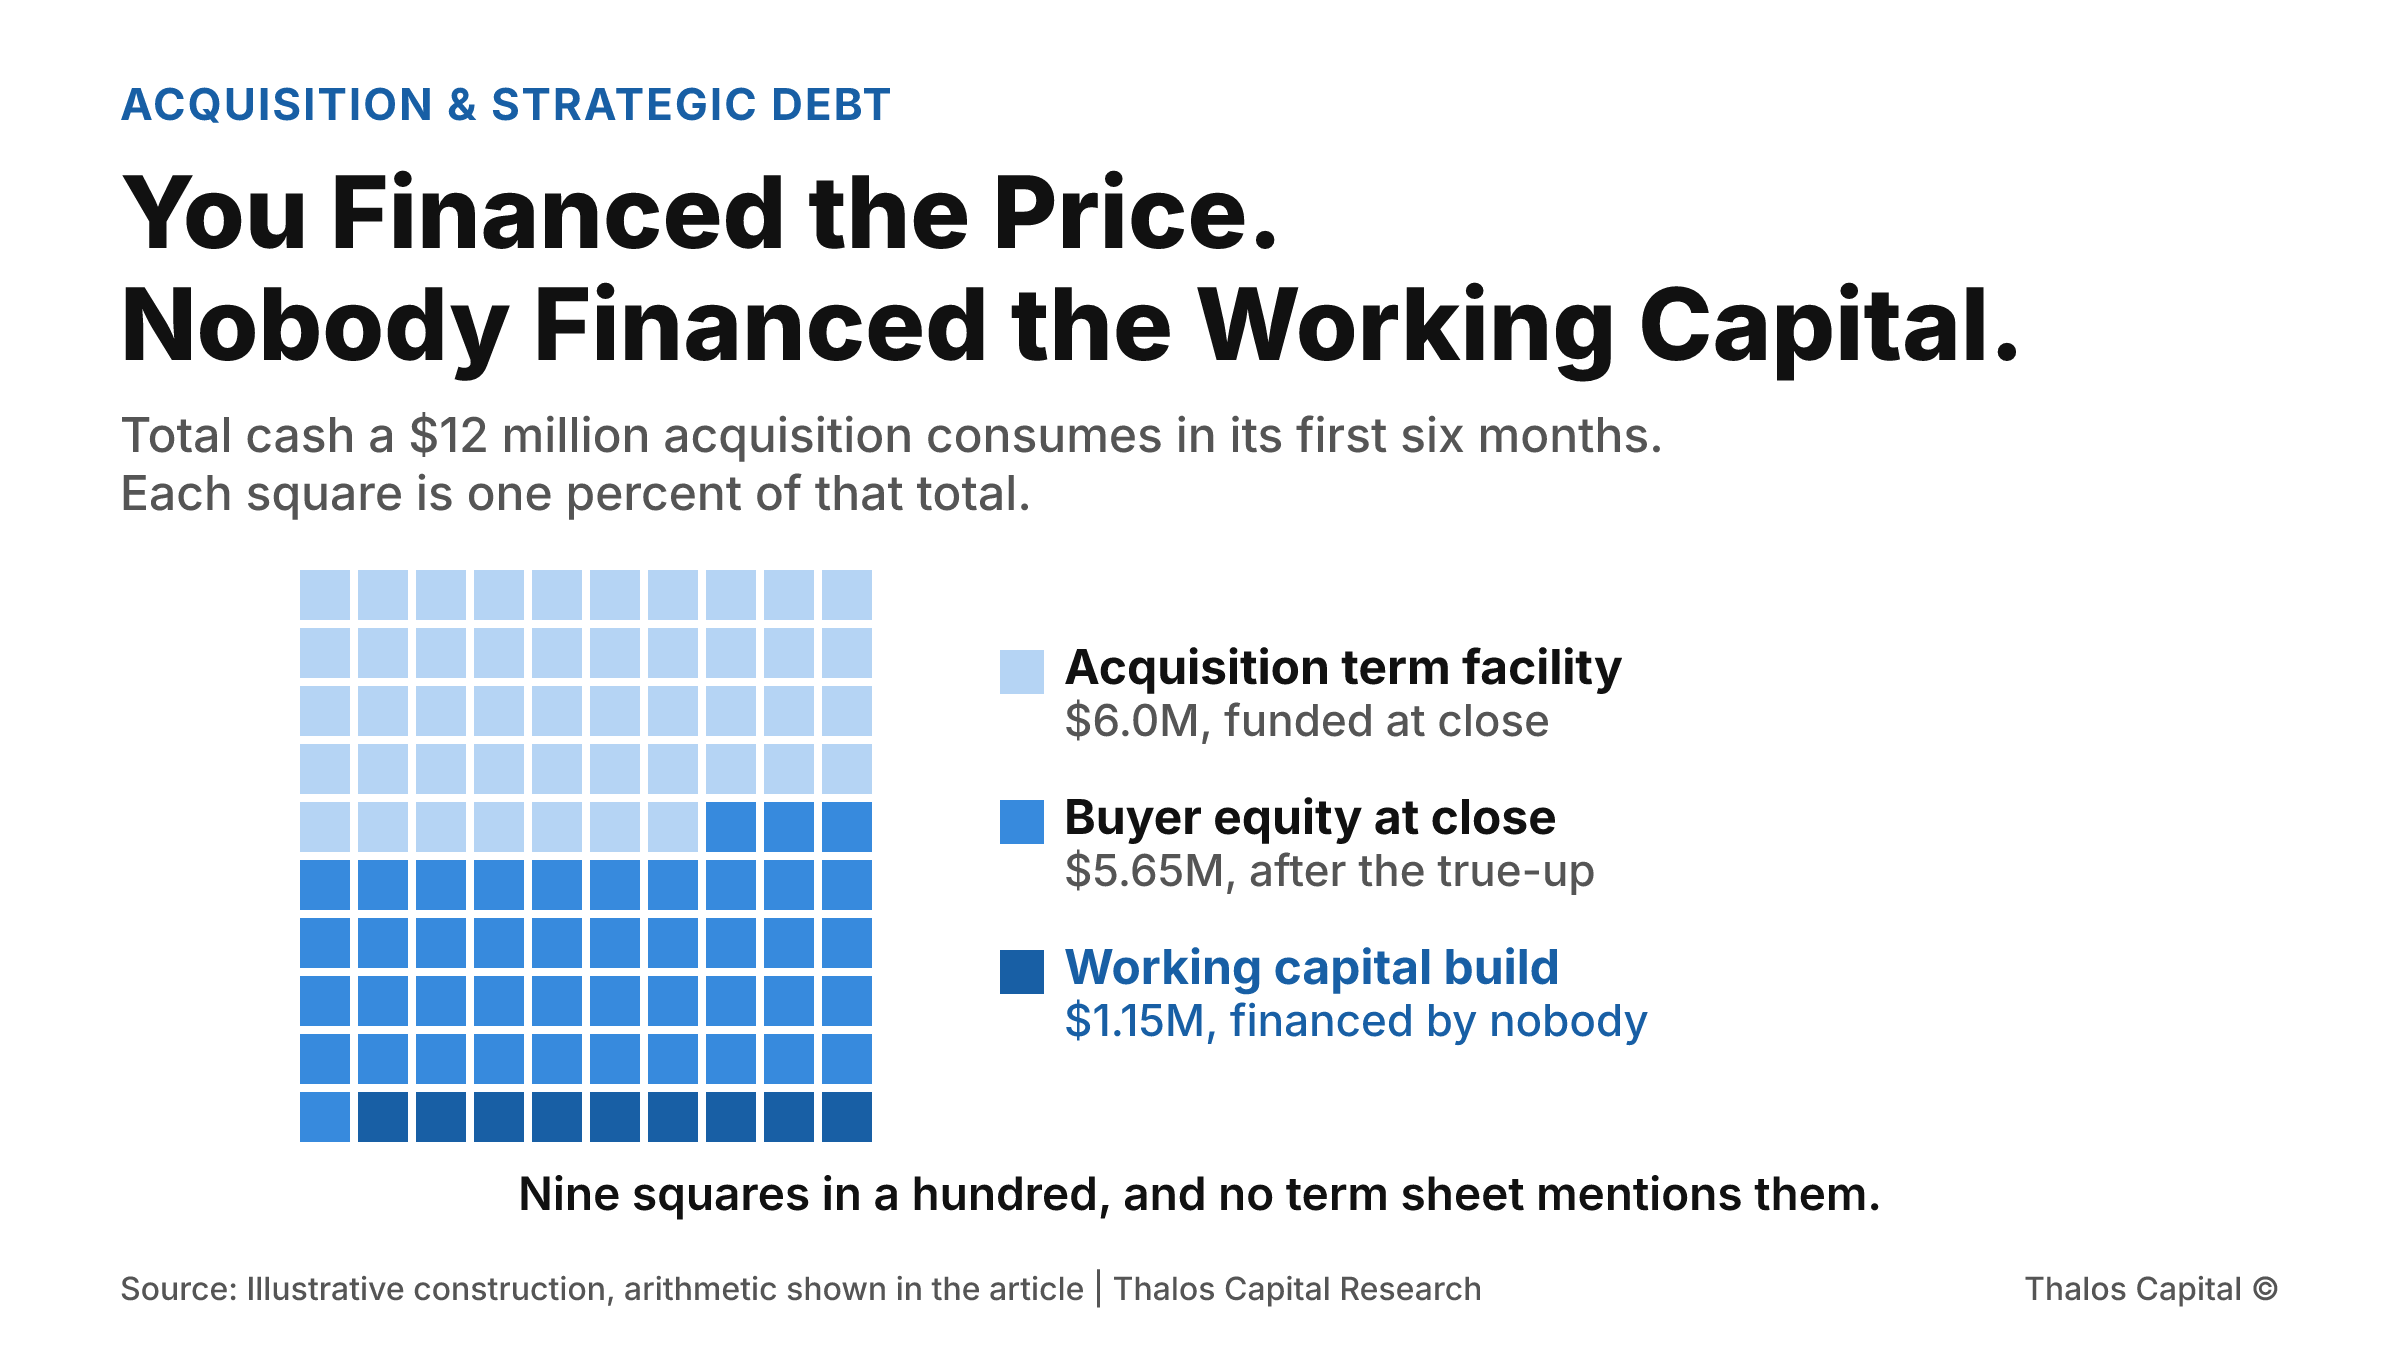
A hundred-square waffle showing the total cash a $12 million acquisition consumes in its first six months: 47 squares funded by the acquisition term facility, 44 by buyer equity at close, and 9 by a working capital build that sits outside the deal model.

You Financed the Price. Nobody Financed the Working Capital.

A buyer models an acquisition as price minus debt equals equity. Then the working capital true-up lands, and the seasonal build after it. The cash required is the same whichever month the deal closes, and the acquisition facility funds none of it.
Read More
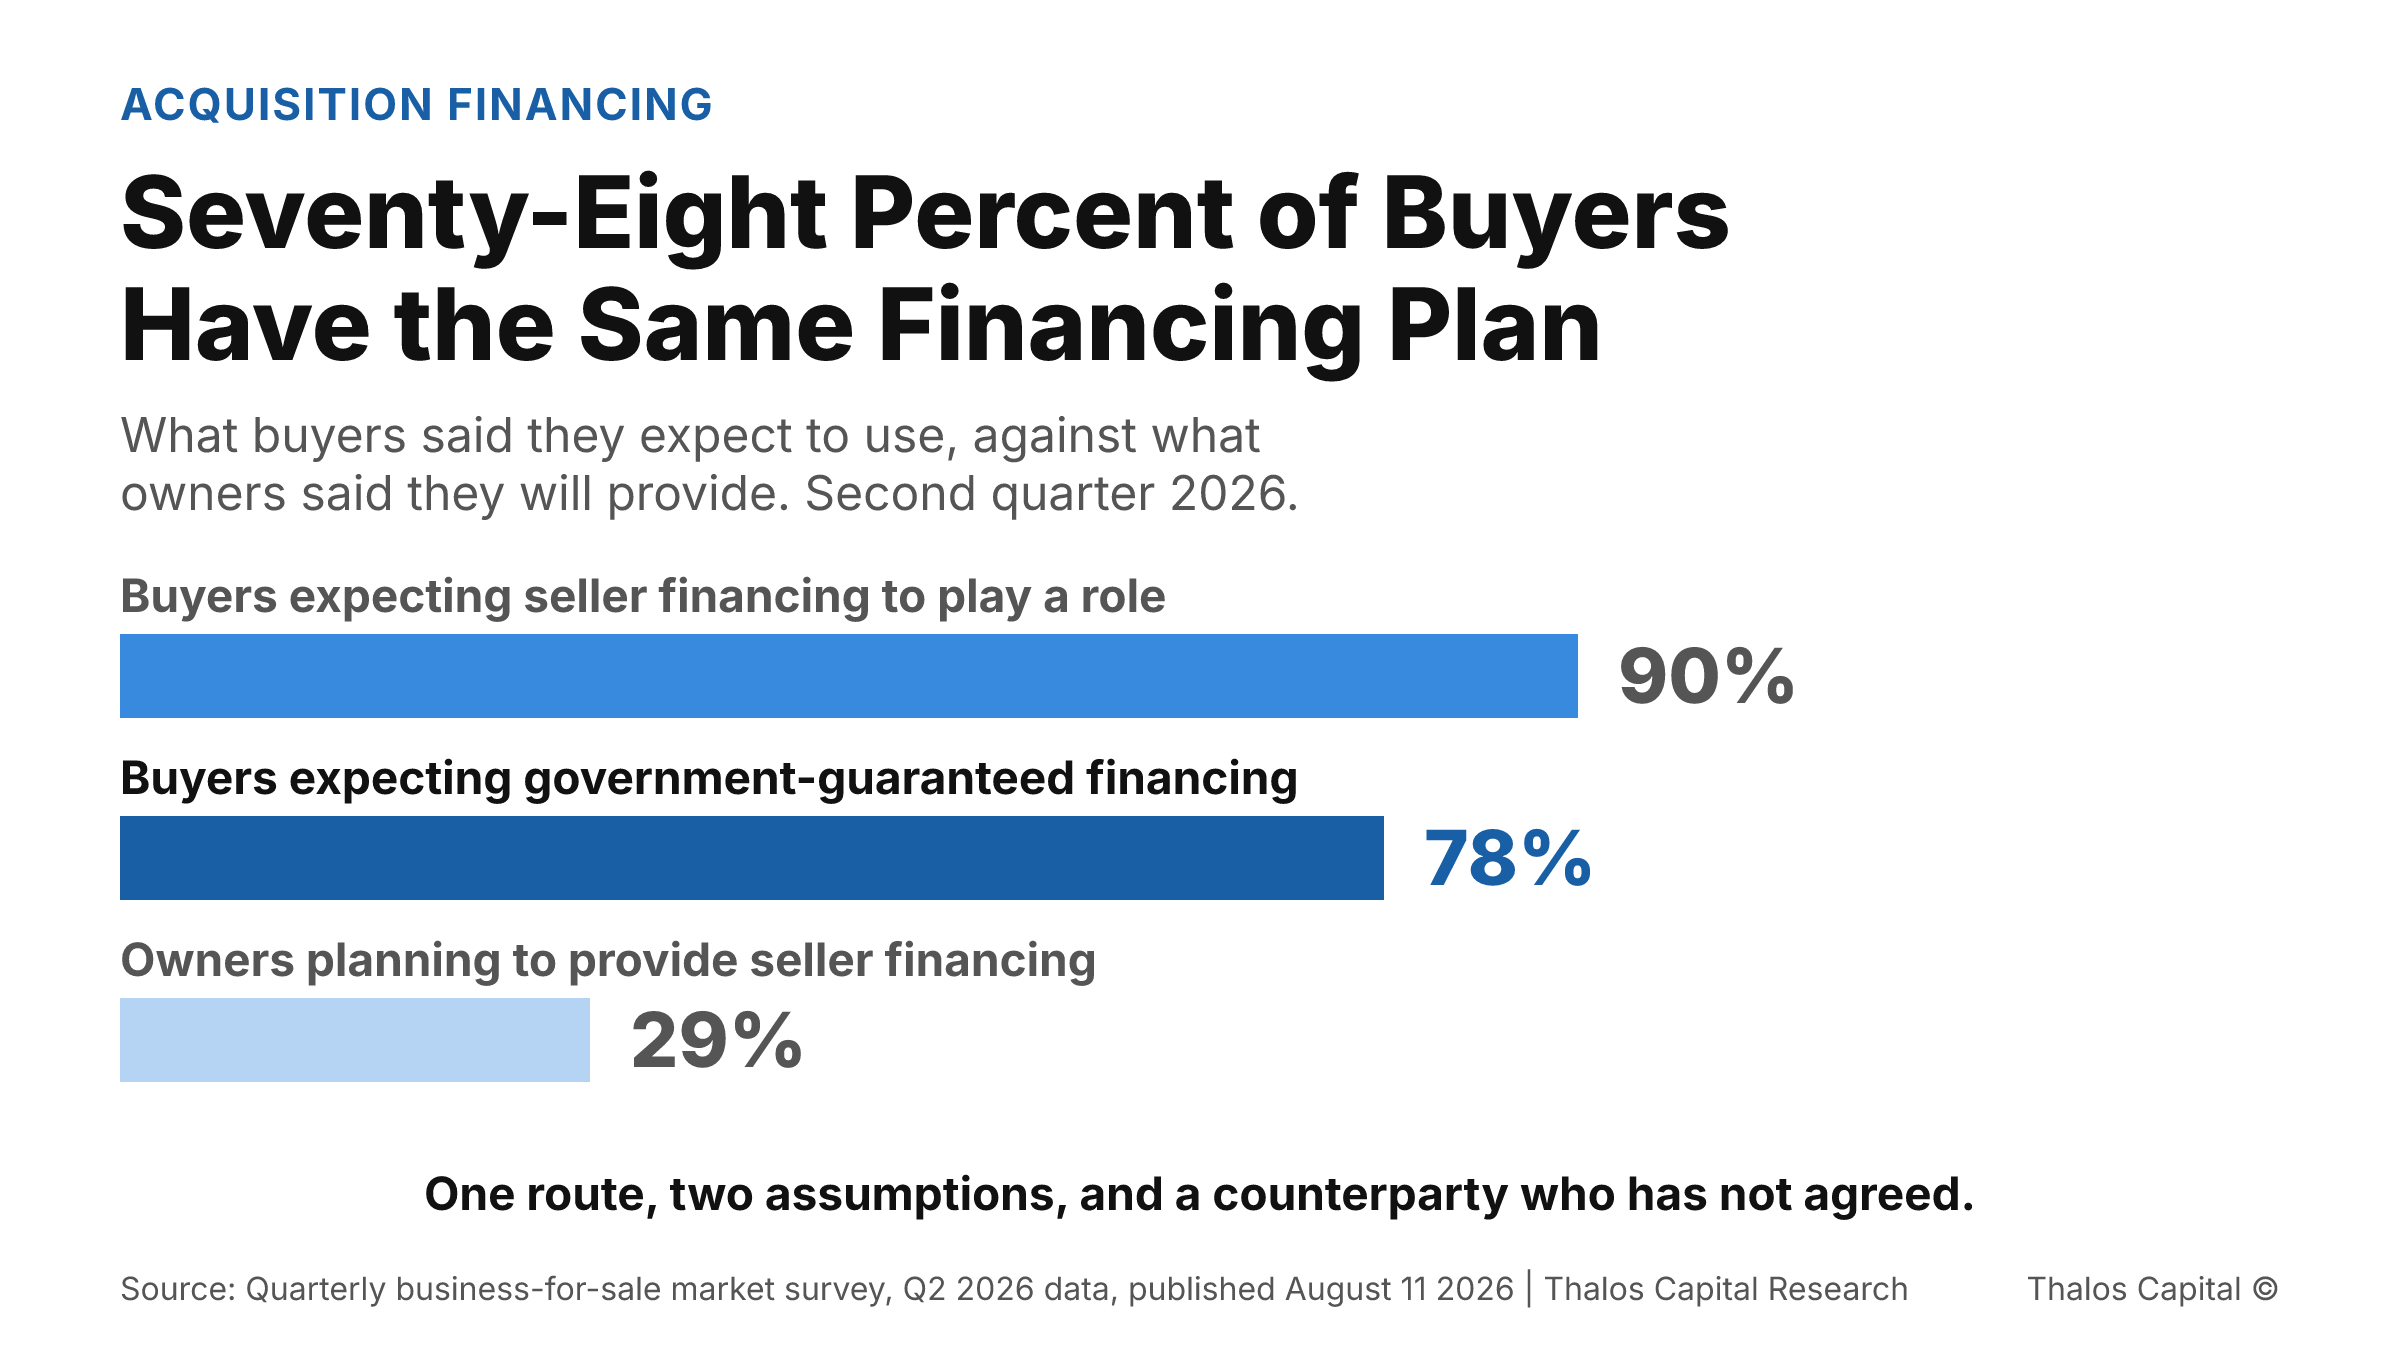
Horizontal bar chart of three survey figures from the second quarter of 2026. Ninety percent of buyers expect seller financing to play a role, seventy-eight percent expect financing backed by the U.S. Small Business Administration, shown in the darkest navy as the value argued, and twenty-nine percent of owners plan to provide seller financing.

Seventy-Eight Percent of Buyers Have the Same Financing Plan

Nearly eight in ten buyers expect to fund an acquisition through one government-guaranteed program, and ninety percent expect a seller note that only twenty-nine percent of owners plan to write.
Read More
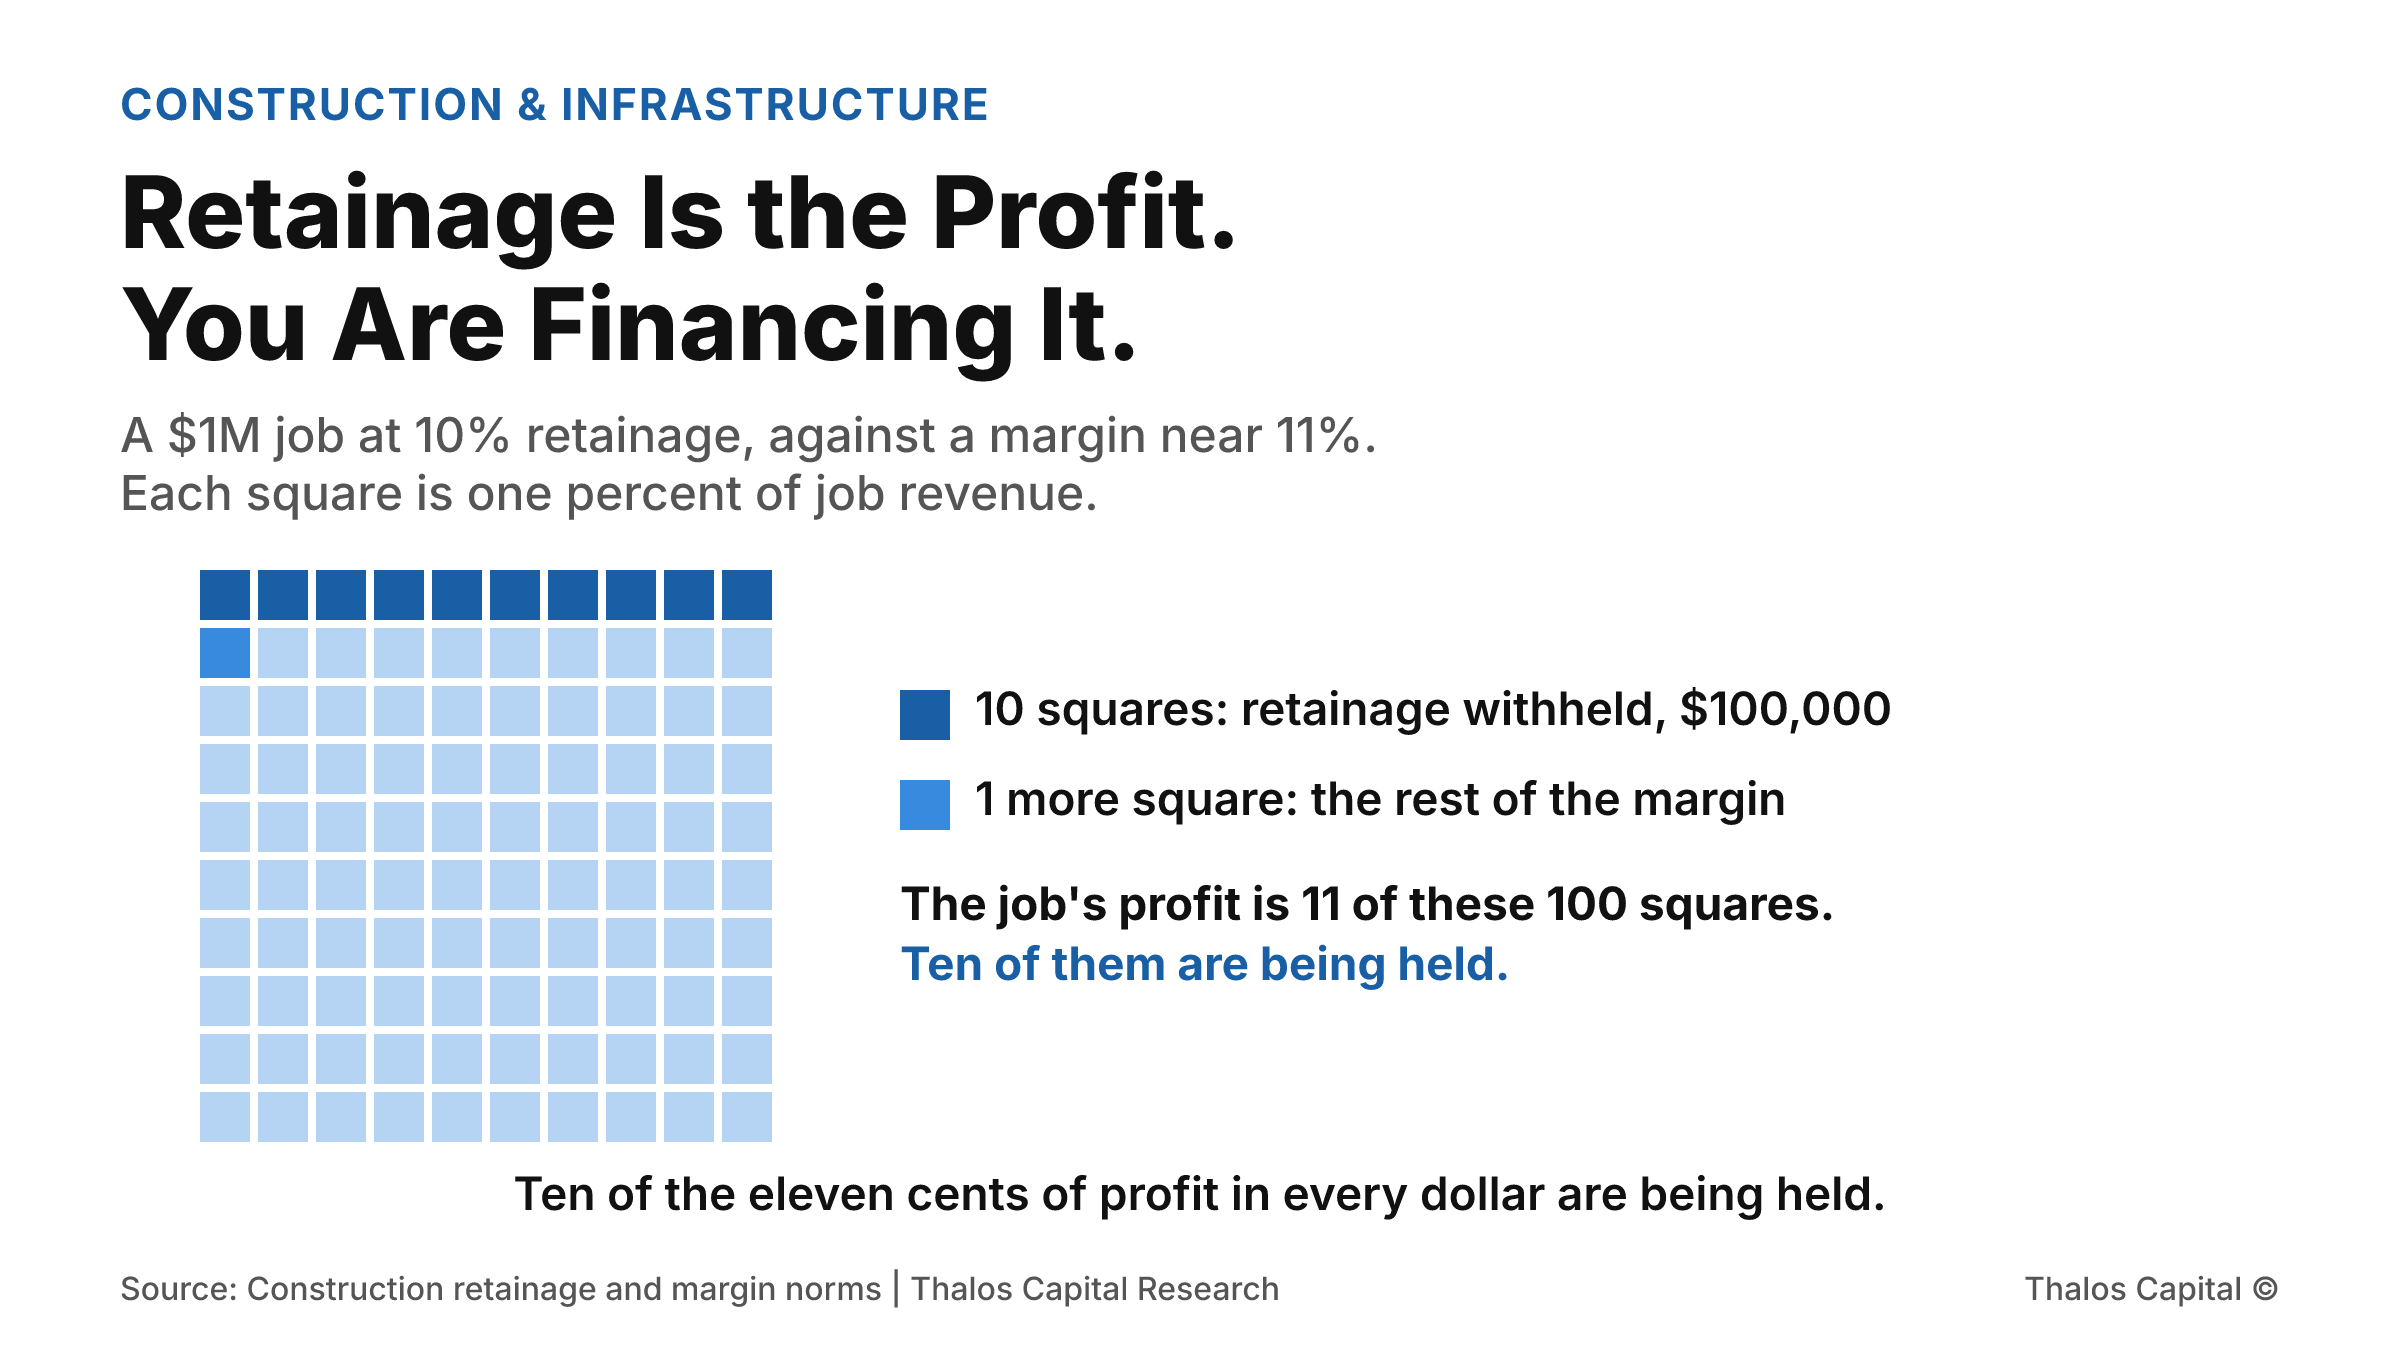
Waffle grid of 100 squares representing a $1 million job. Ten squares in dark navy show the $100,000 withheld as retainage and one further square in mid blue completes the roughly 11 percent margin, so ten of the eleven profit squares are being held.

Retainage Is the Profit. You Are Financing It.

A ten-month job billing $100,000 a month withholds $100,000 by closeout. At builder margins near 11 percent that is almost the entire profit on the job, and a standard receivables facility gives you nothing against it.
Read More
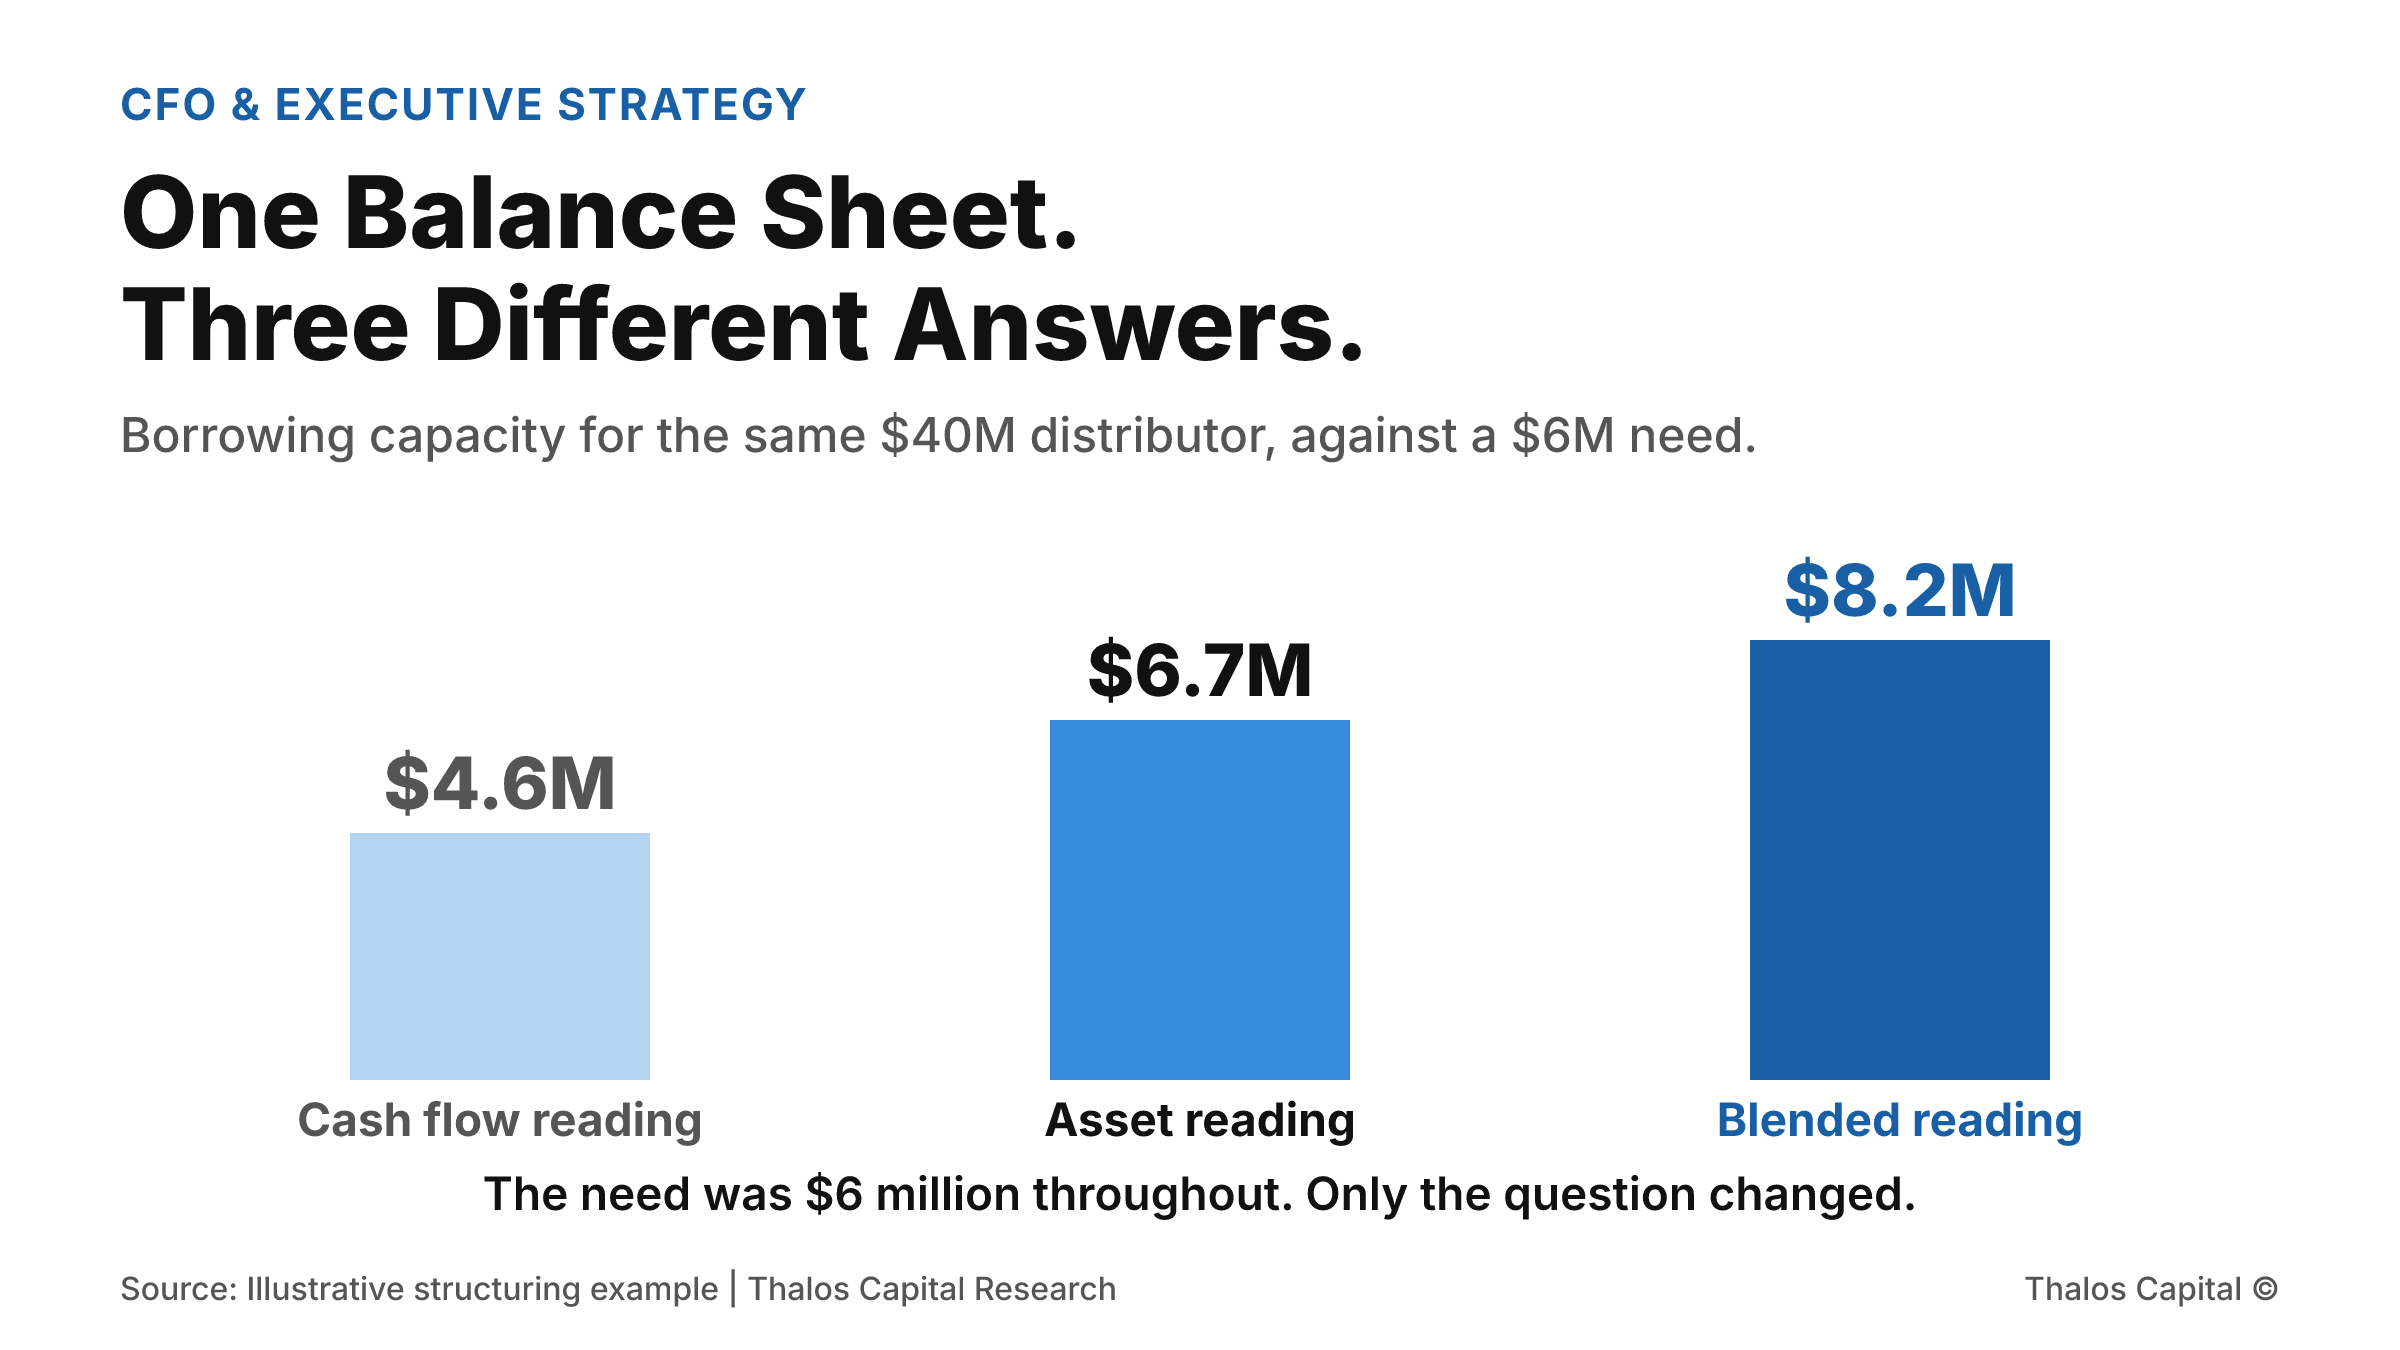
Column chart showing three borrowing capacity readings for the same distributor: $4.6 million on a cash flow reading, $6.7 million on an asset reading, and $8.2 million on a blended reading shown in the darkest navy, against a $6 million financing need.

One Balance Sheet. Three Different Answers.

A distributor doing $40 million in revenue needs $6 million. Read against cash flow it is short. Read against its assets it clears. Read as a blend it borrows $8.2 million. Same company, same week, three answers.
Read More
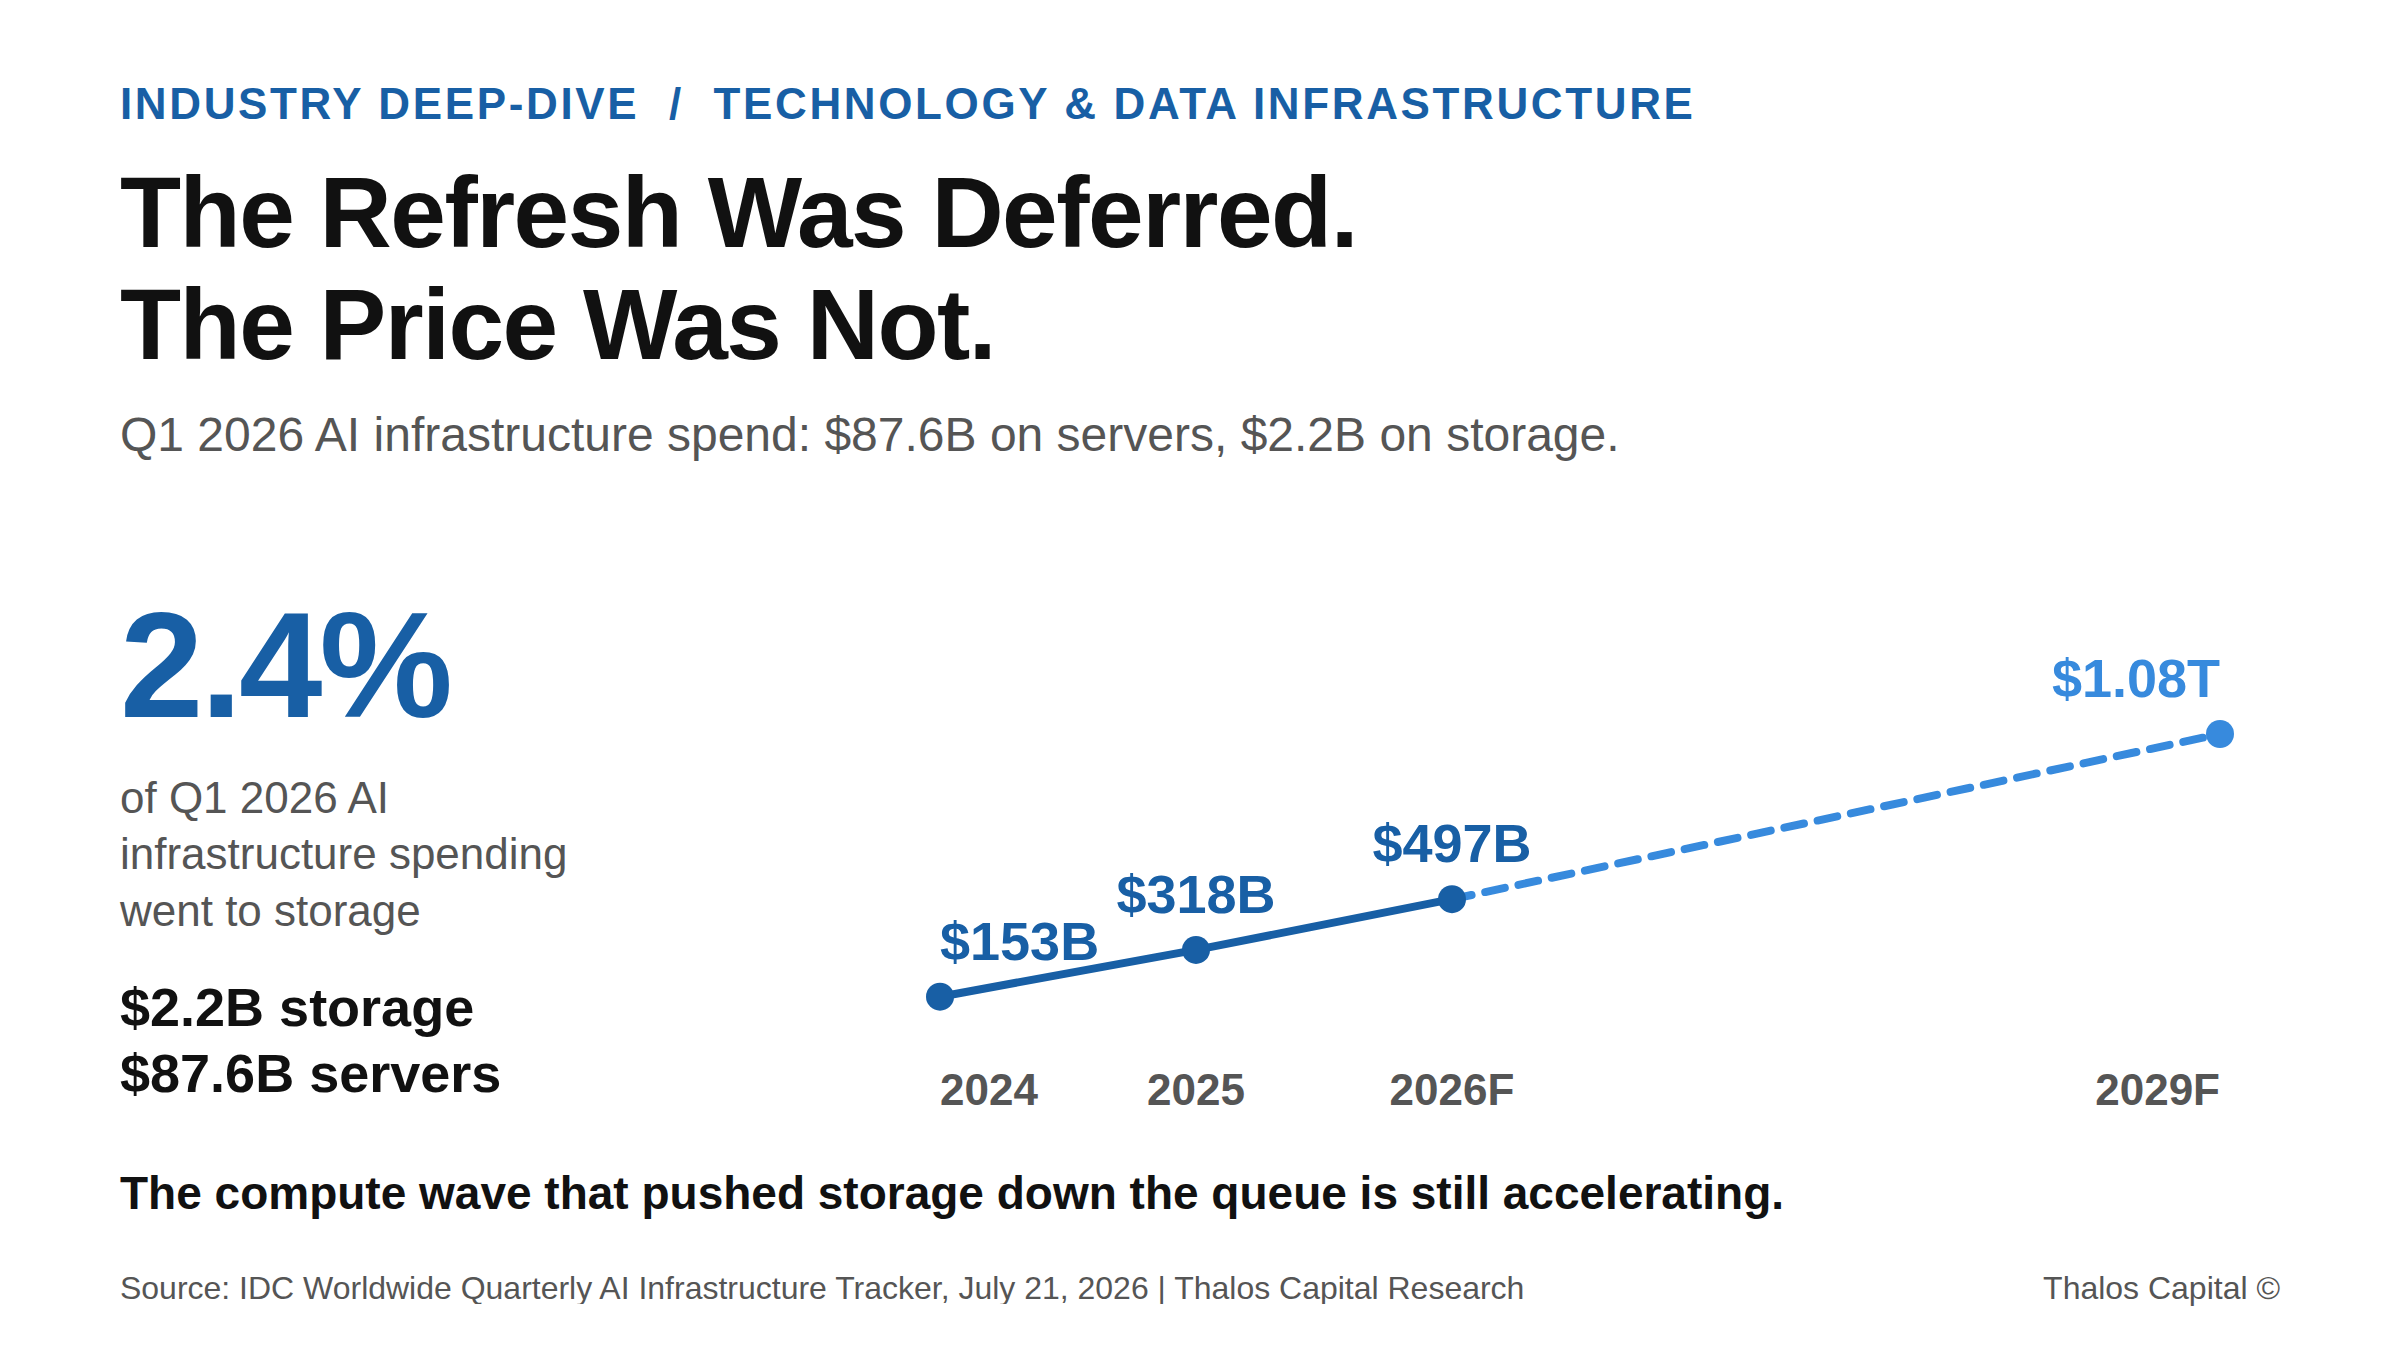
Trend line showing global AI infrastructure spending rising from $153B in 2024 to a forecast $497B in 2026 and $1.08T in 2029, with a callout that storage took 2.4 percent of Q1 2026 spending.

The Storage Refresh You Deferred Comes Due at 2026 Prices

Storage took 2.4% of Q1 2026 AI infrastructure spending. That deferral is expiring into a component market that has repriced every quarter. What it costs, and how to structure the refresh.
Read More
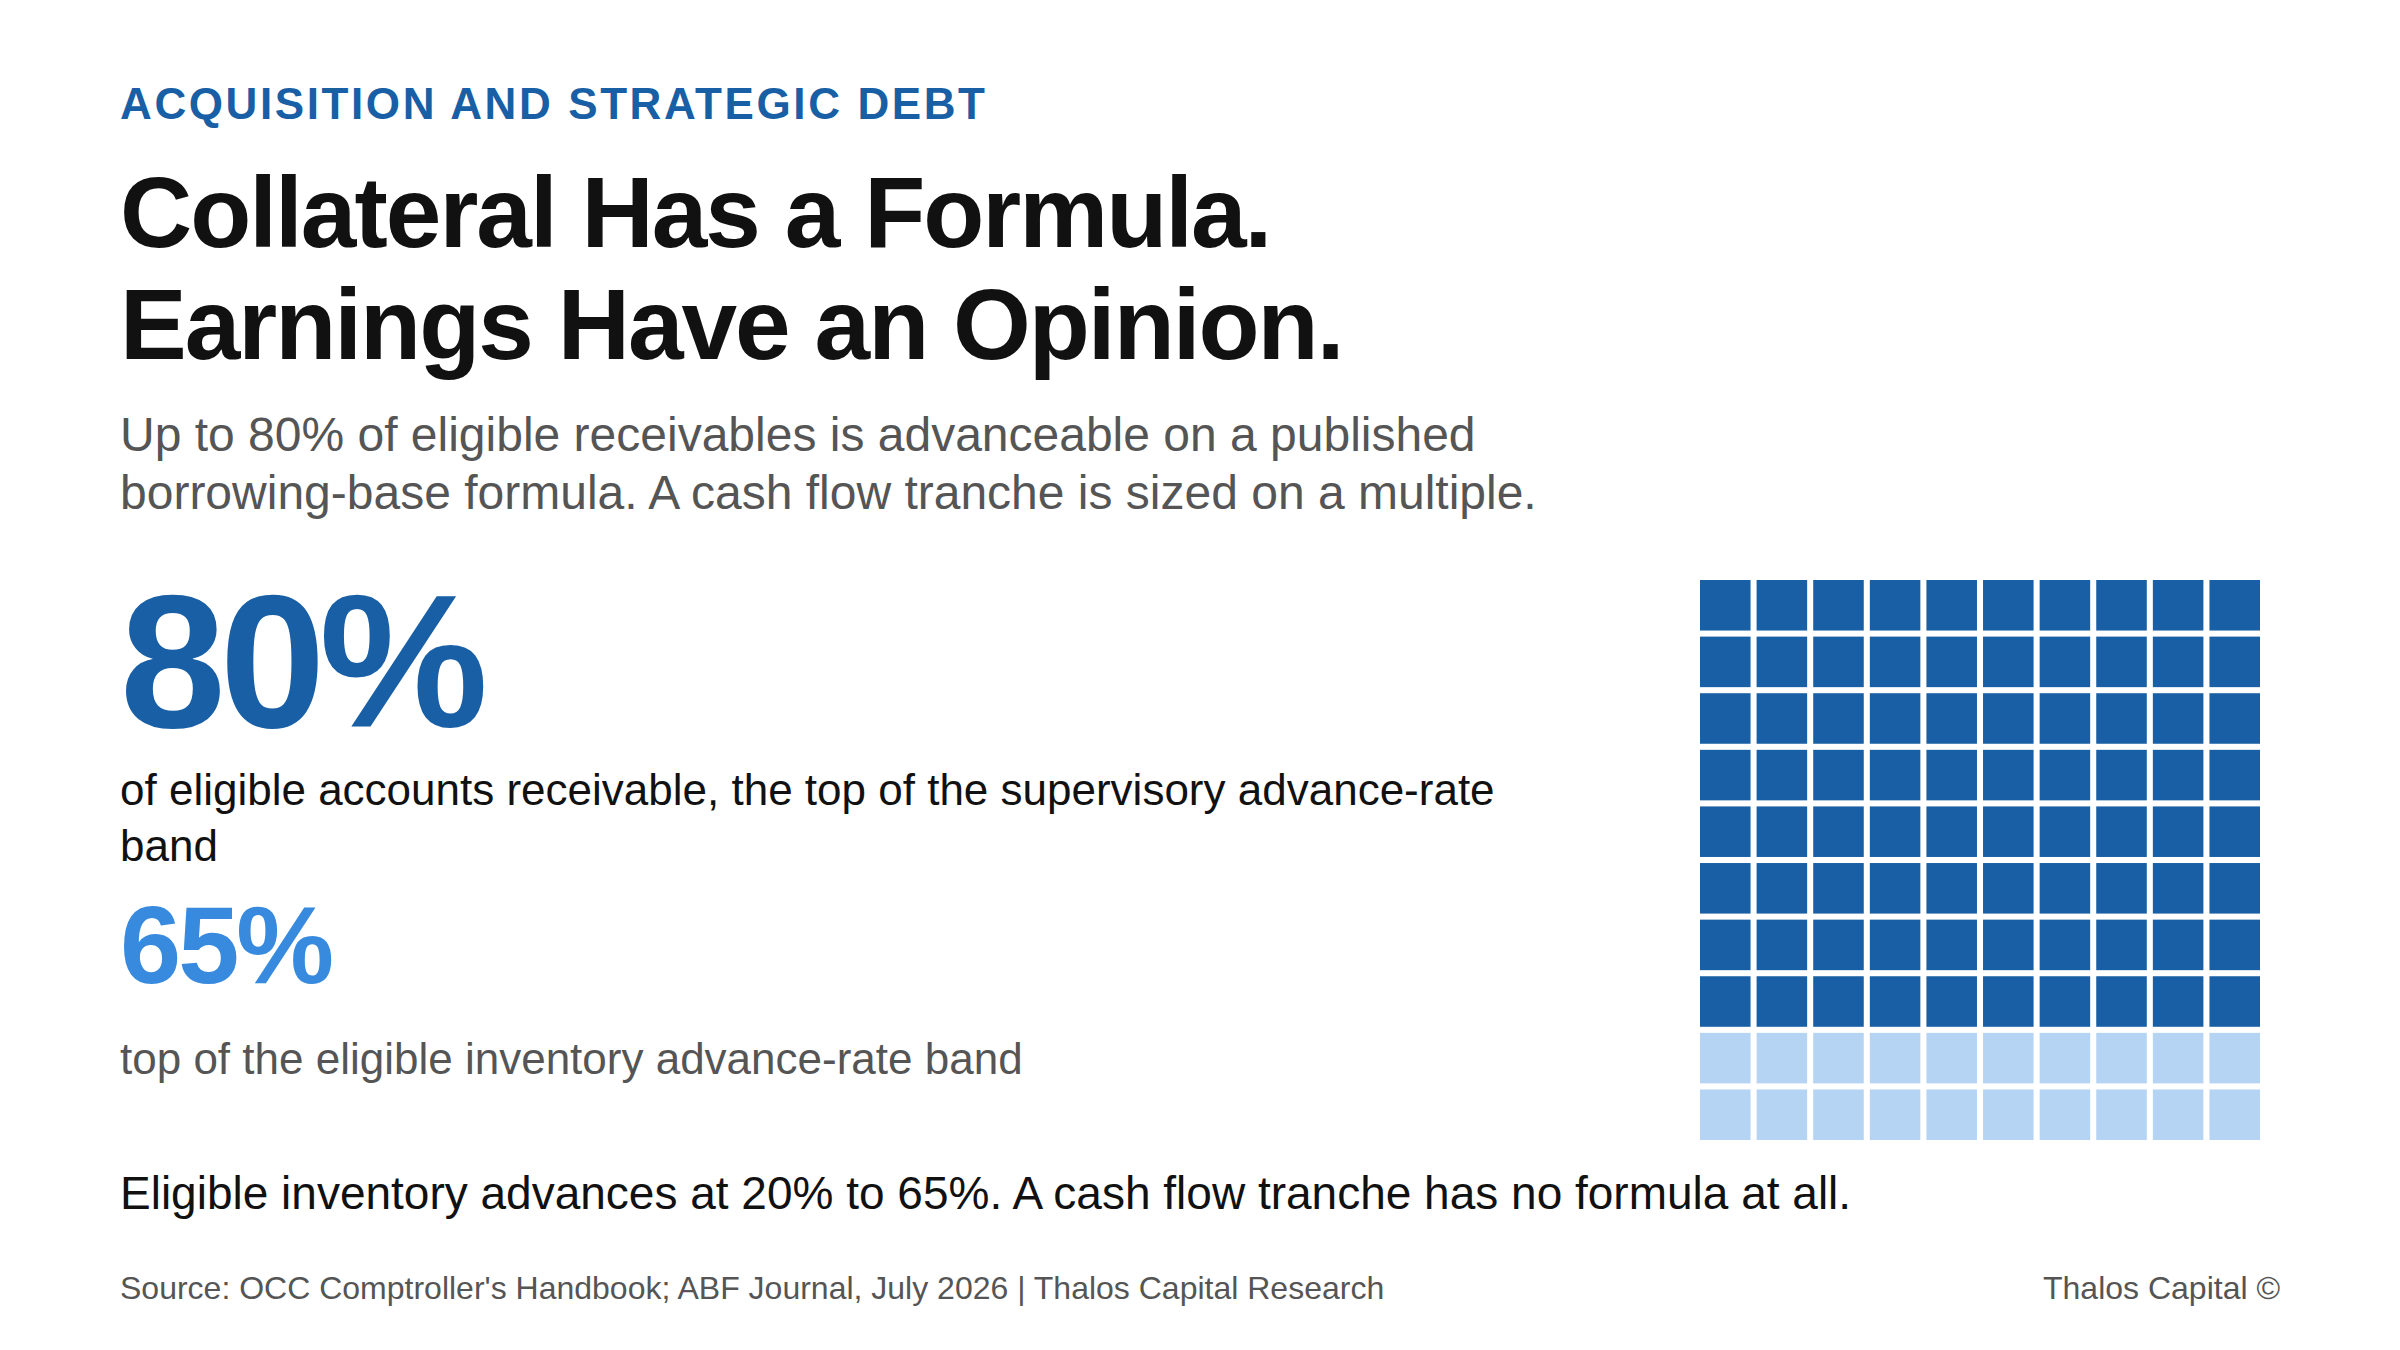
Squares pictogram showing 80 of 100 filled, representing the top of the 70 to 80 percent advance-rate band on eligible accounts receivable under a borrowing-base formula, with the 65 percent eligible inventory ceiling shown alongside.

You Are Buying a Balance Sheet and Financing It Like a Cash Flow Statement

Two facilities priced 200 to 250 basis points apart in the same week. The difference was collateral, not credit. Why acquisition debt sized only on EBITDA leaves both pricing and capacity on the table.
Read More
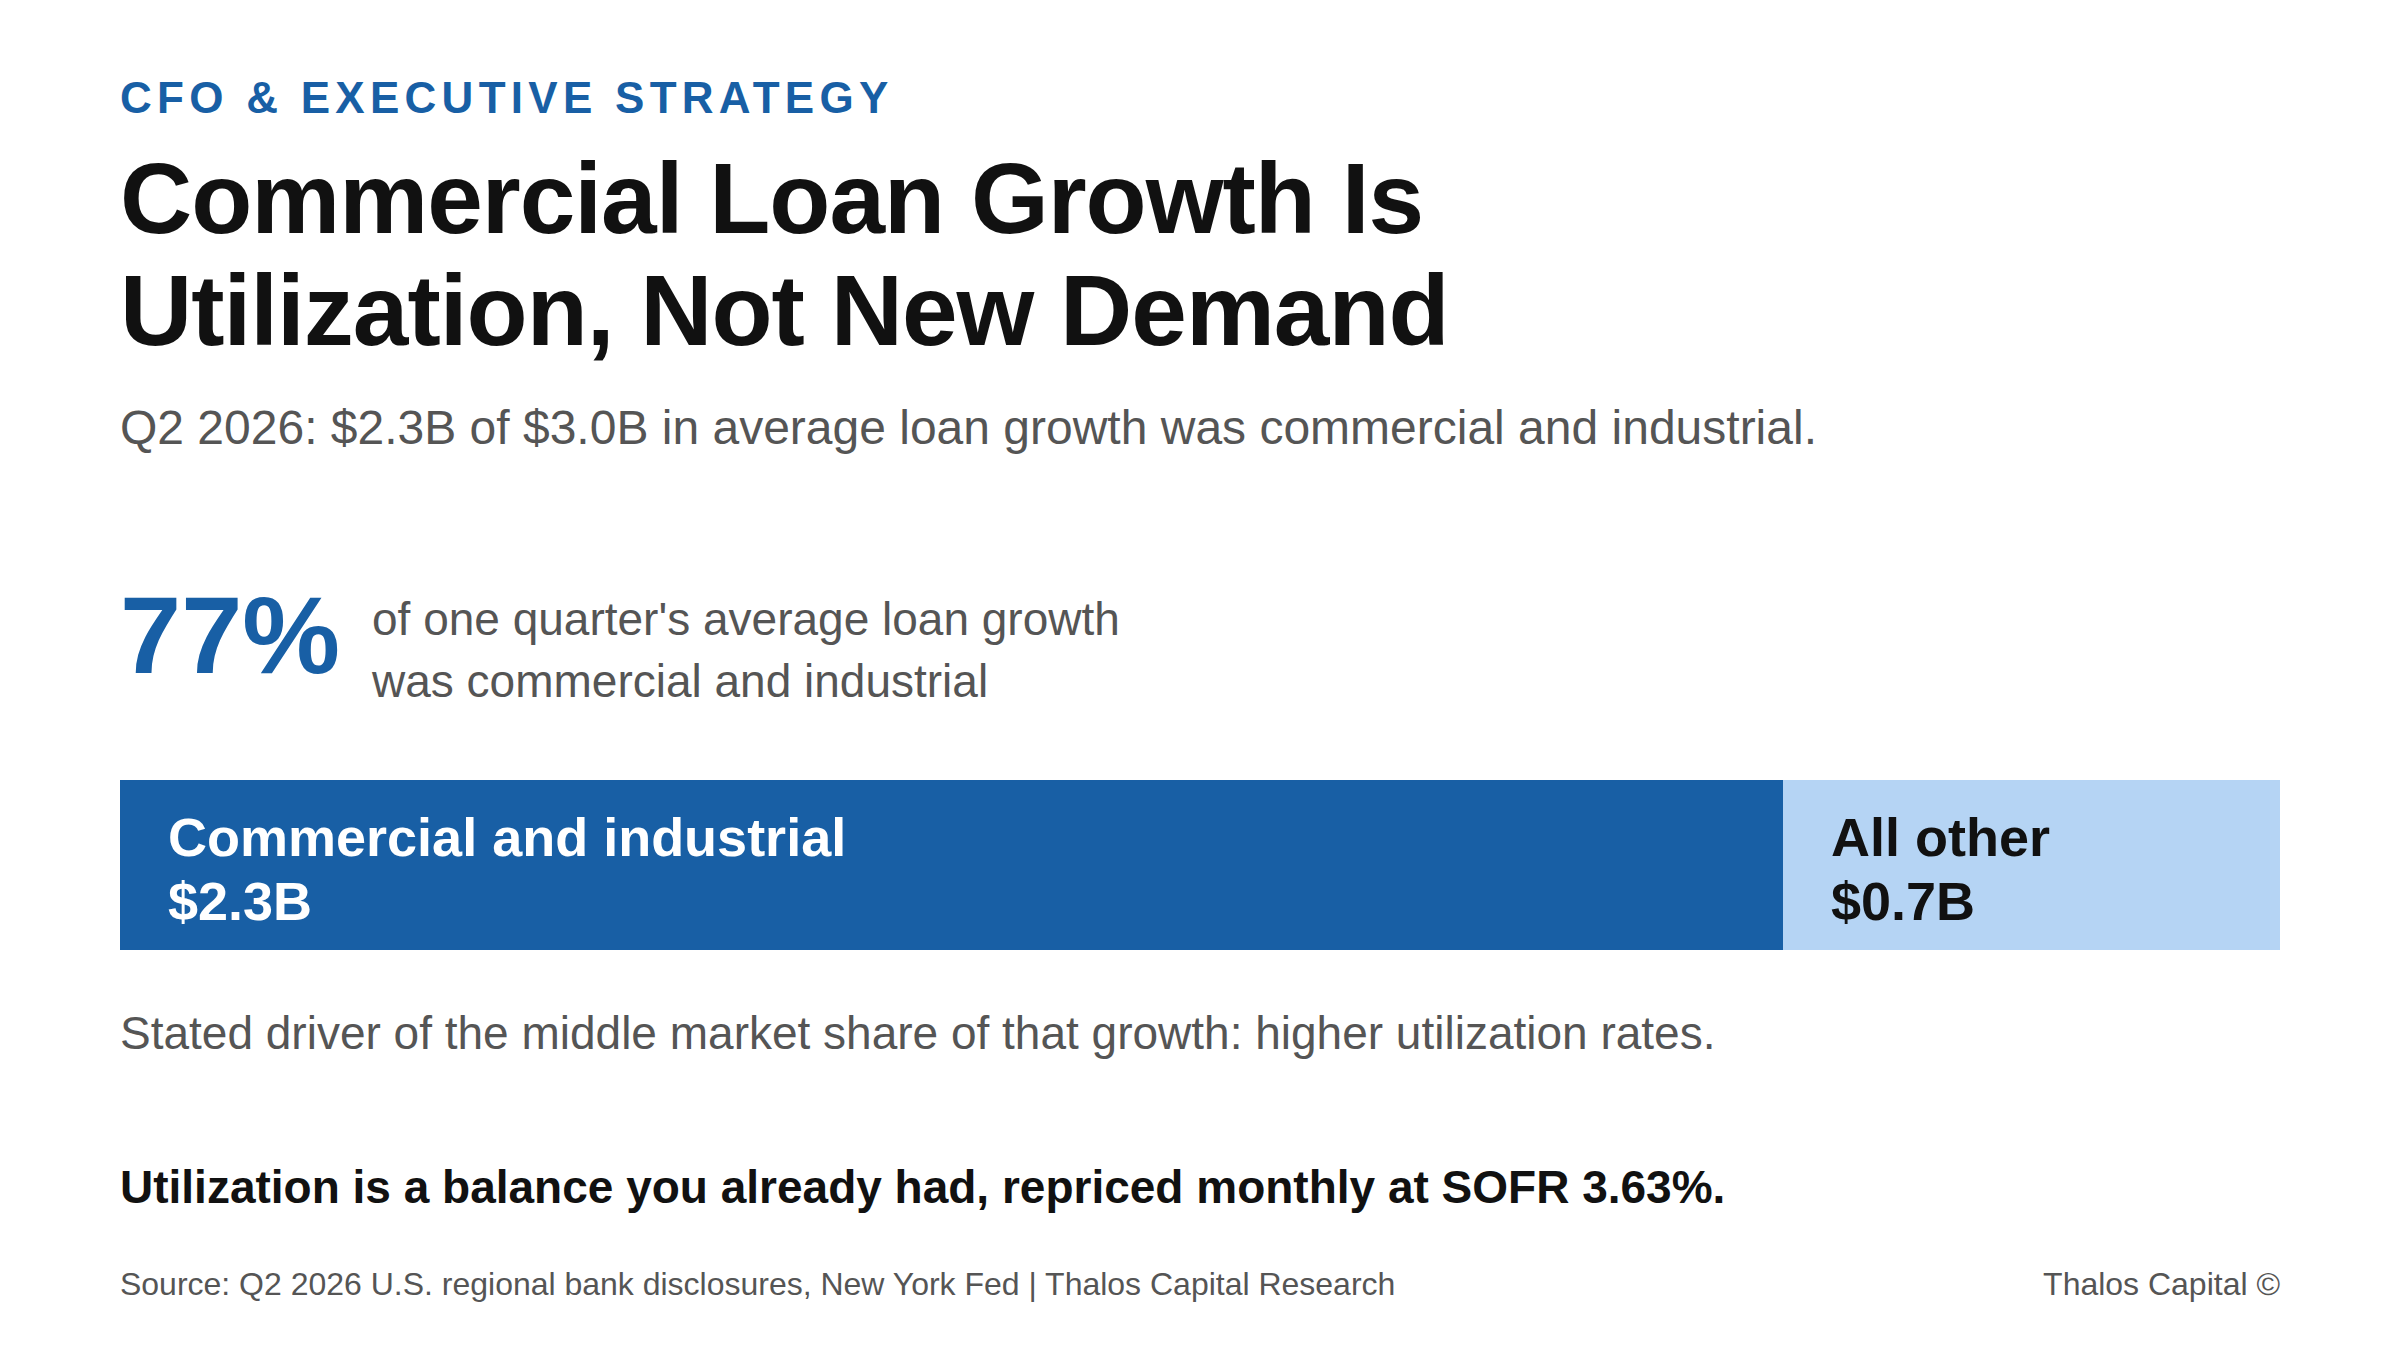
Stacked bar showing $2.3 billion of $3.0 billion in one quarter's average loan growth at a large U.S. regional bank was commercial and industrial, driven by higher utilization rather than new borrowers.

Rising Revolver Utilization Is a Liquidity Signal, Not a Growth Signal

Middle-market commercial balances are rising on higher revolver utilization, not new borrowers. With SOFR at 3.63% and September hike odds at 63%, a drawn line funding permanent assets costs twice.
Read More
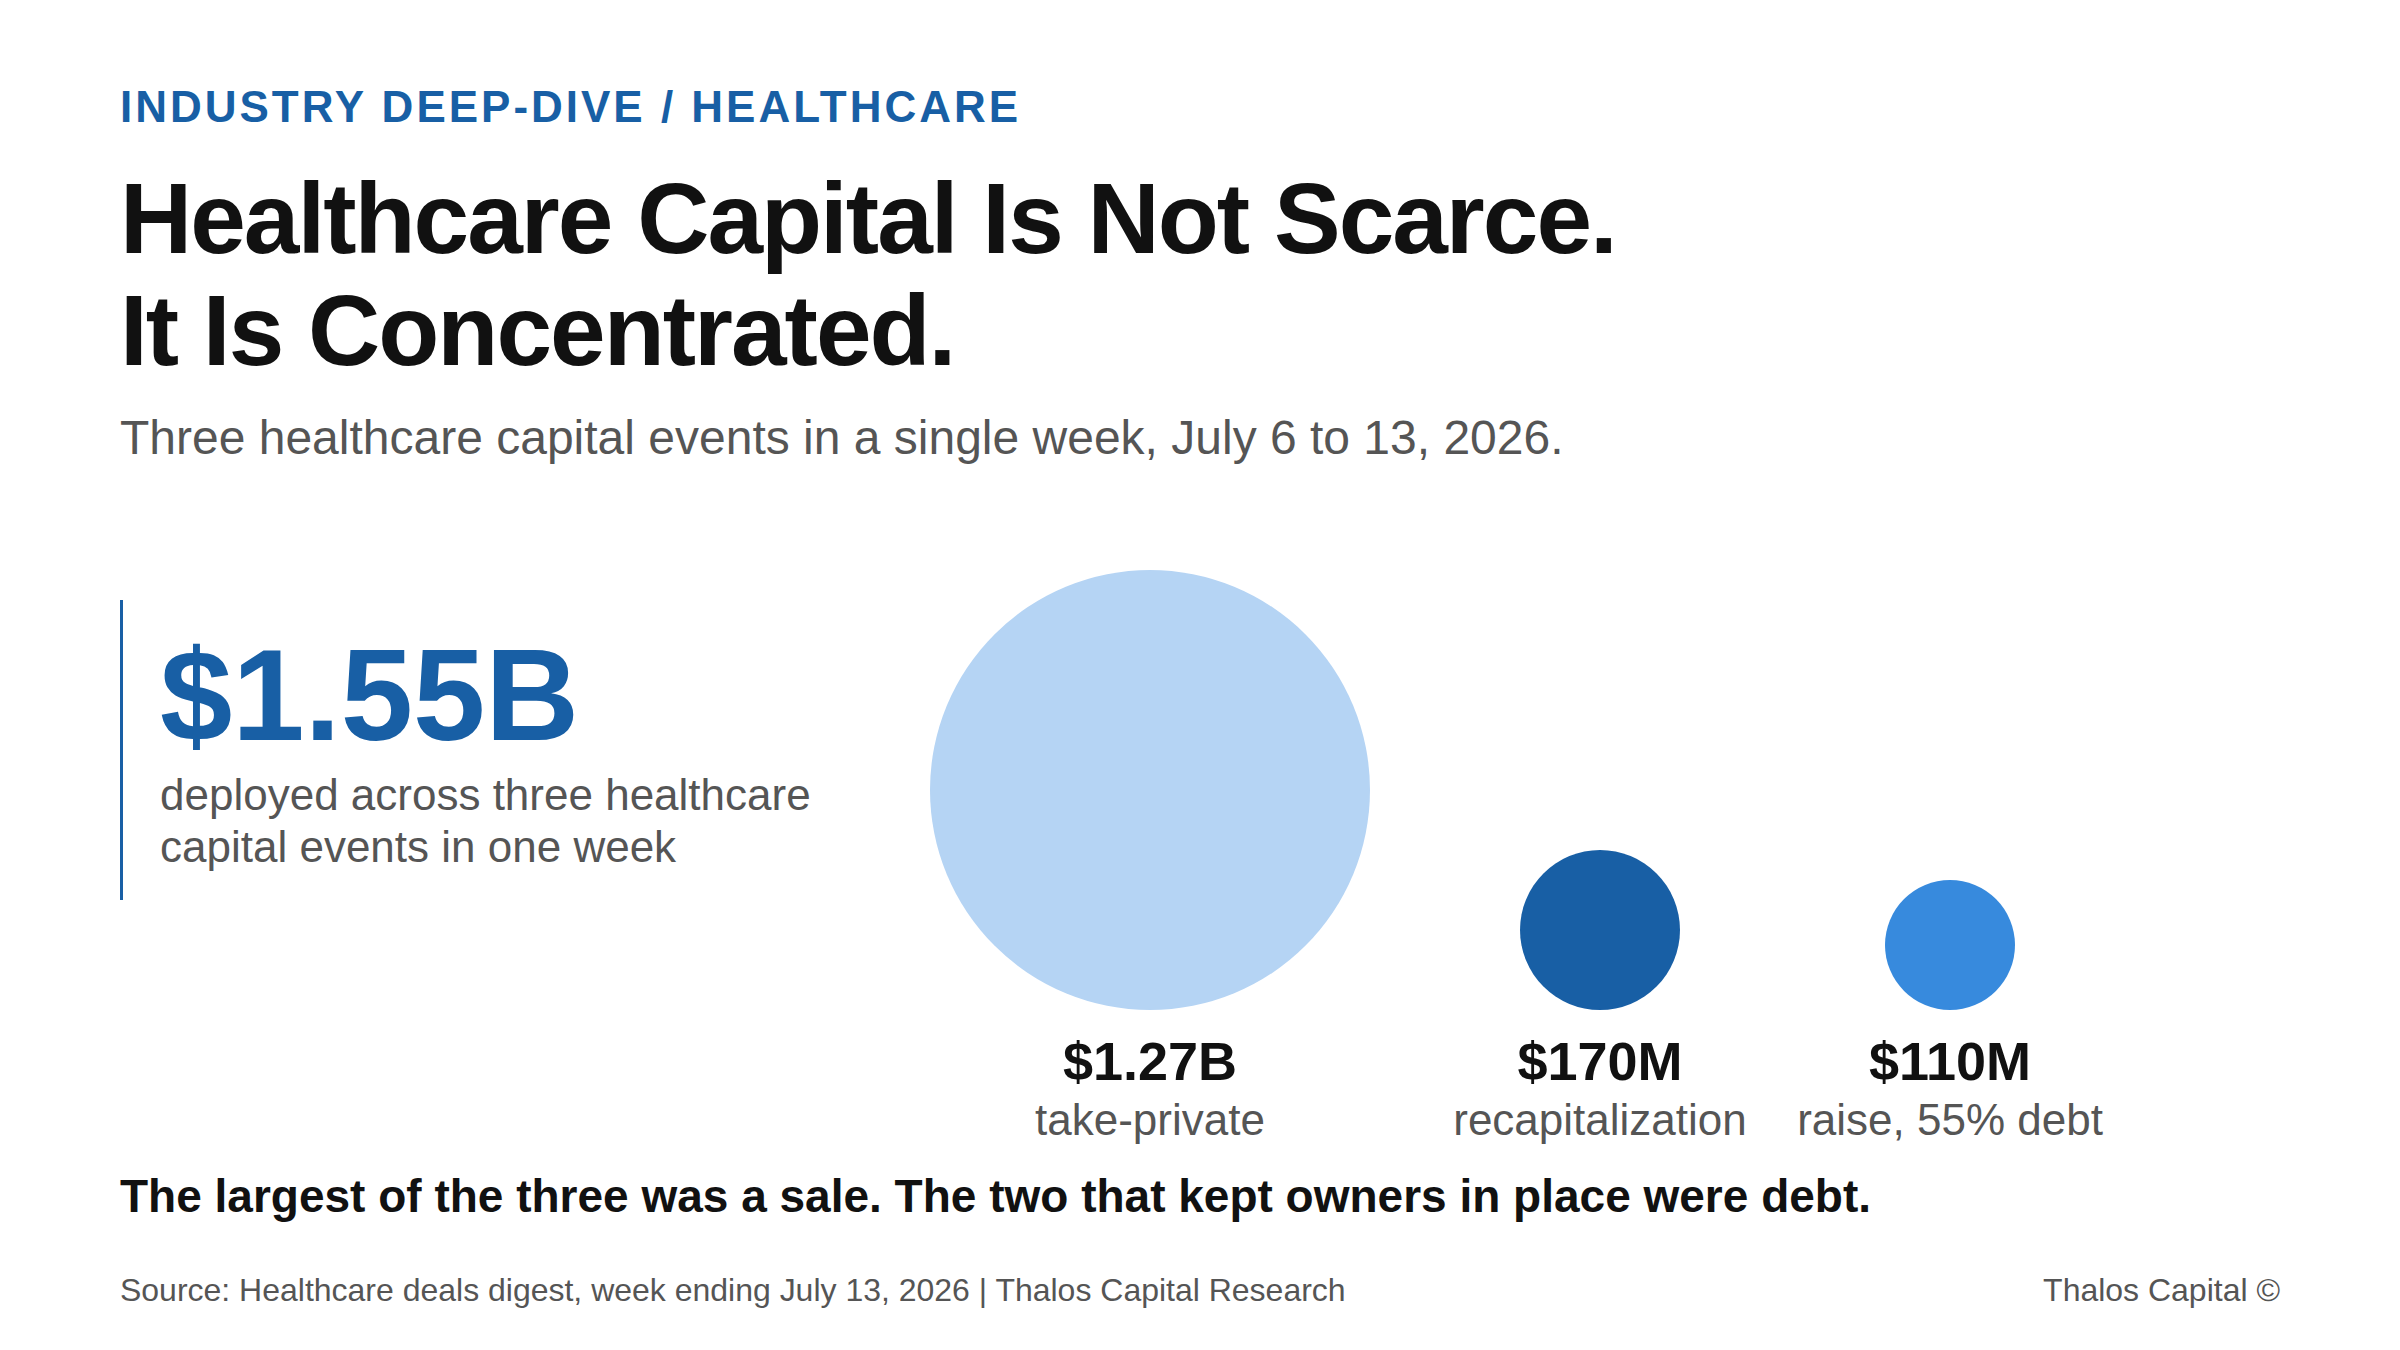
Proportional circle chart comparing three healthcare capital events in the week ending July 13, 2026, sized by value: a $1.27B medical technology take-private, a $170M dental group recapitalization, and a $110M platform raise that was 55 percent debt, totaling roughly $1.55B.

Healthcare Capital Is Not Scarce. It Is Concentrated.

Roughly $1.55B moved into healthcare businesses in one week. The largest deal ended in a sale. The other two used debt and kept ownership intact. Why the same structures rarely reach an independent practice.
Read More
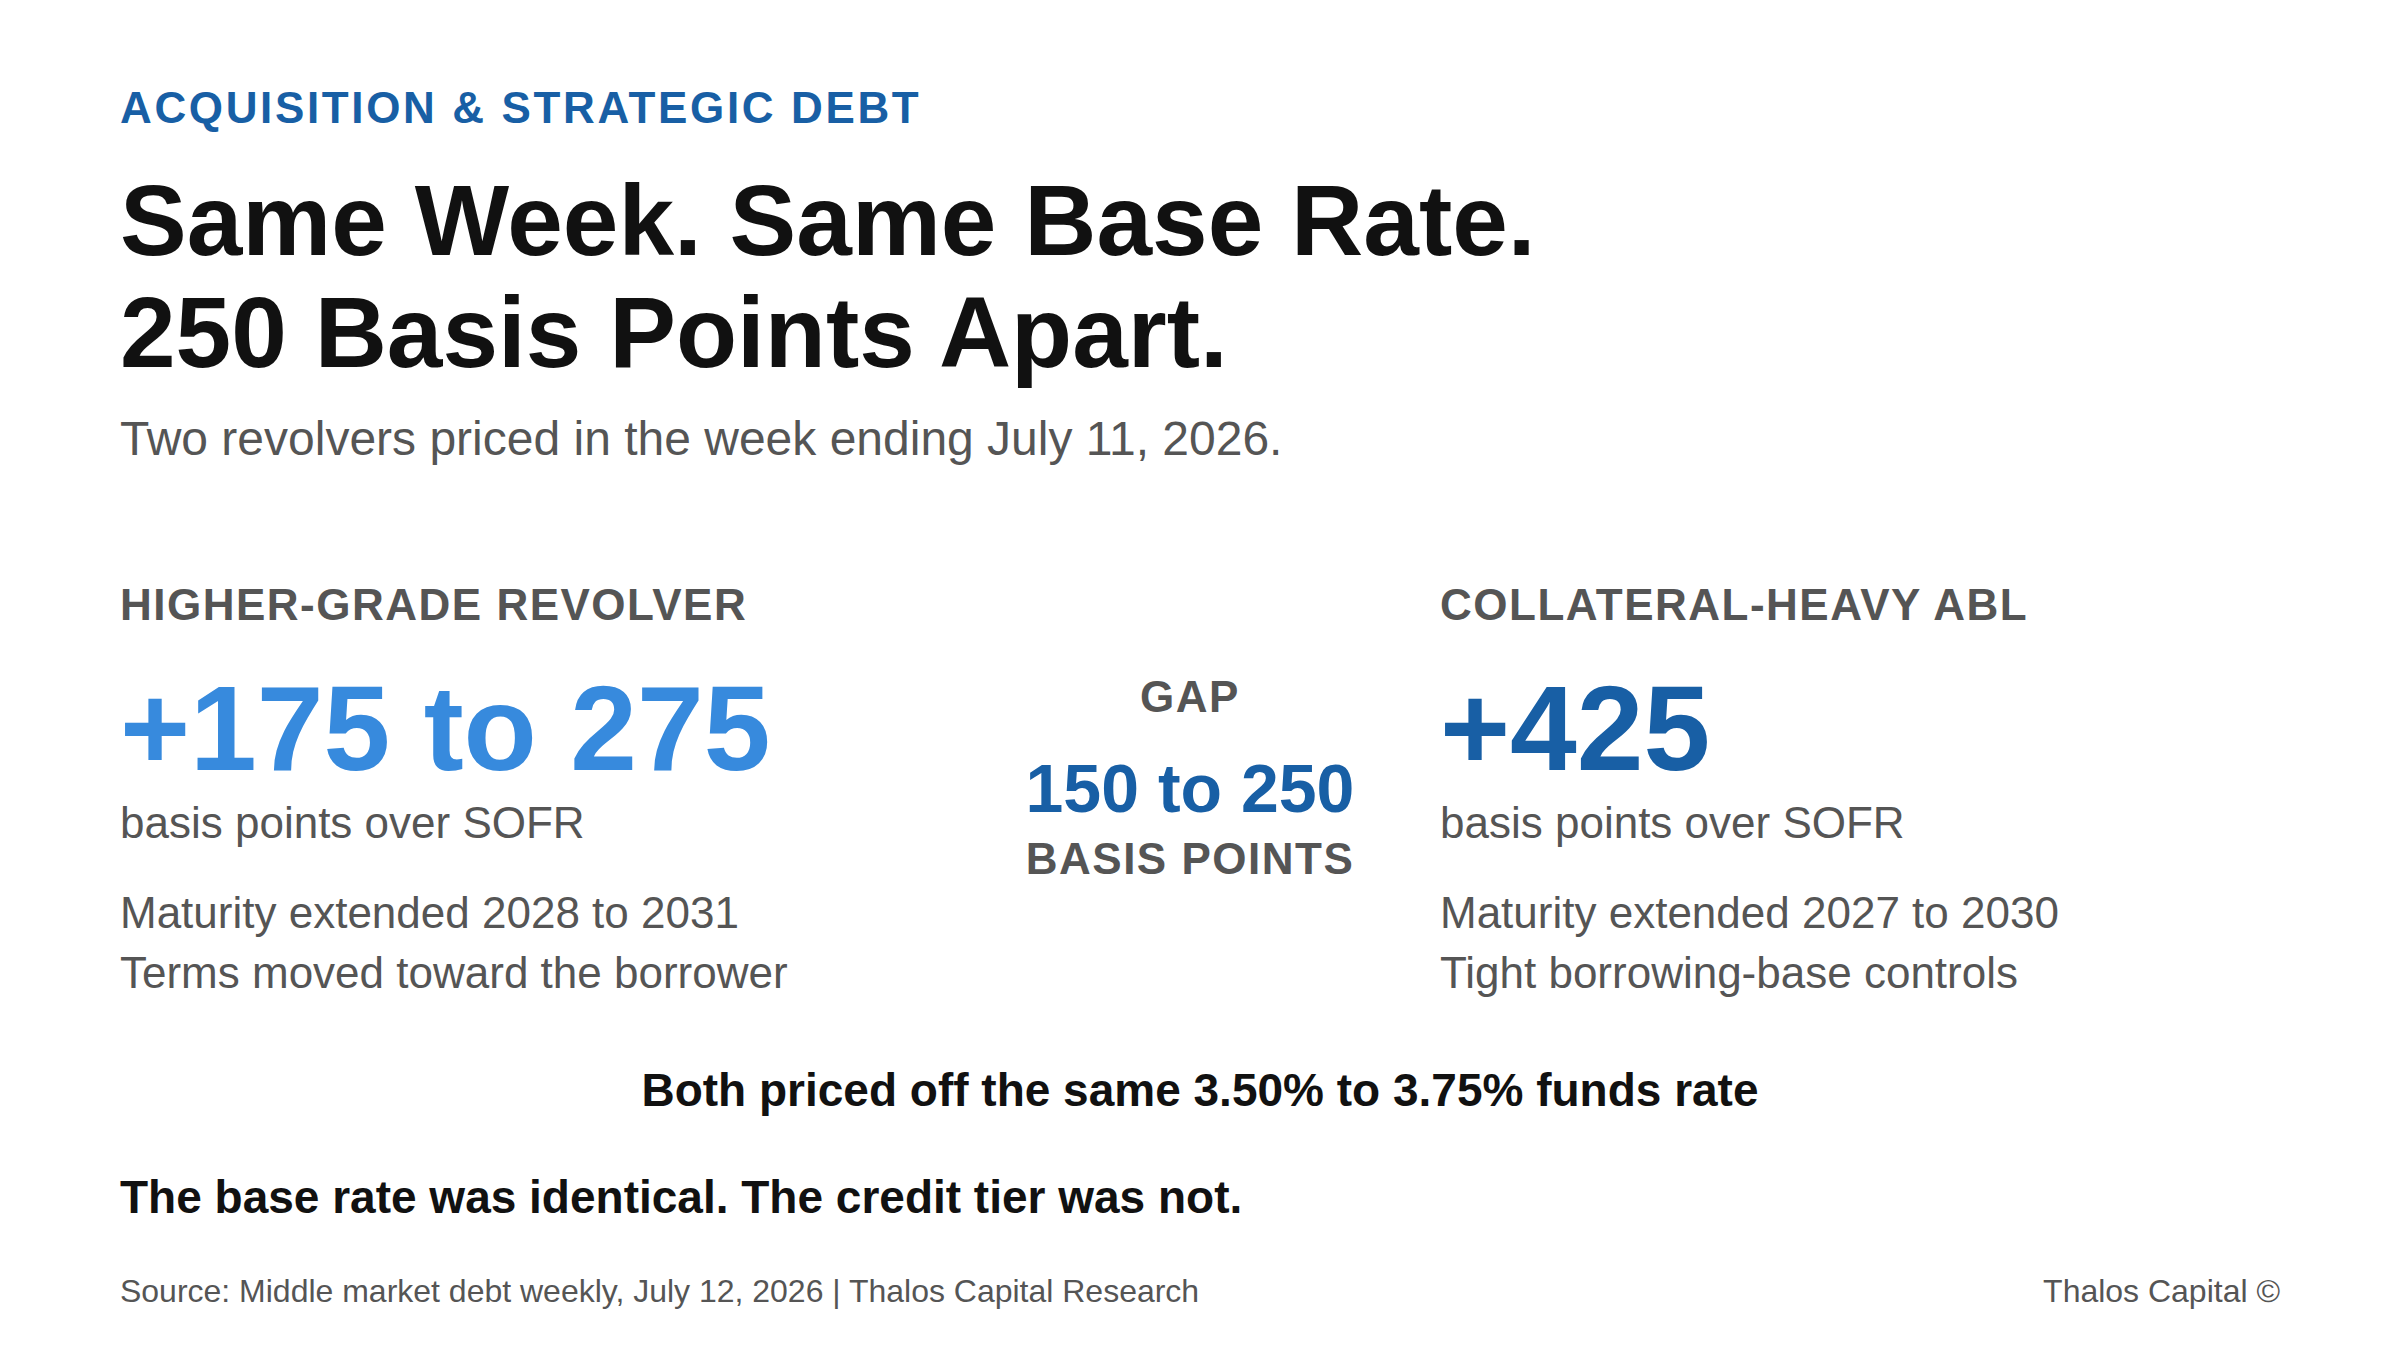
Contrast chart showing a higher-grade revolver priced at 175 to 275 basis points over SOFR against a collateral-heavy asset-based revolver at 425 basis points, both priced off the same 3.50% to 3.75% funds rate.

Same Week, Same Base Rate, 250 Basis Points Apart

Two revolvers priced in the same week of July 2026 carried spreads 150 to 250 basis points apart on an identical base rate. The difference was credit tier, and tier is something a borrower can change.
Read More
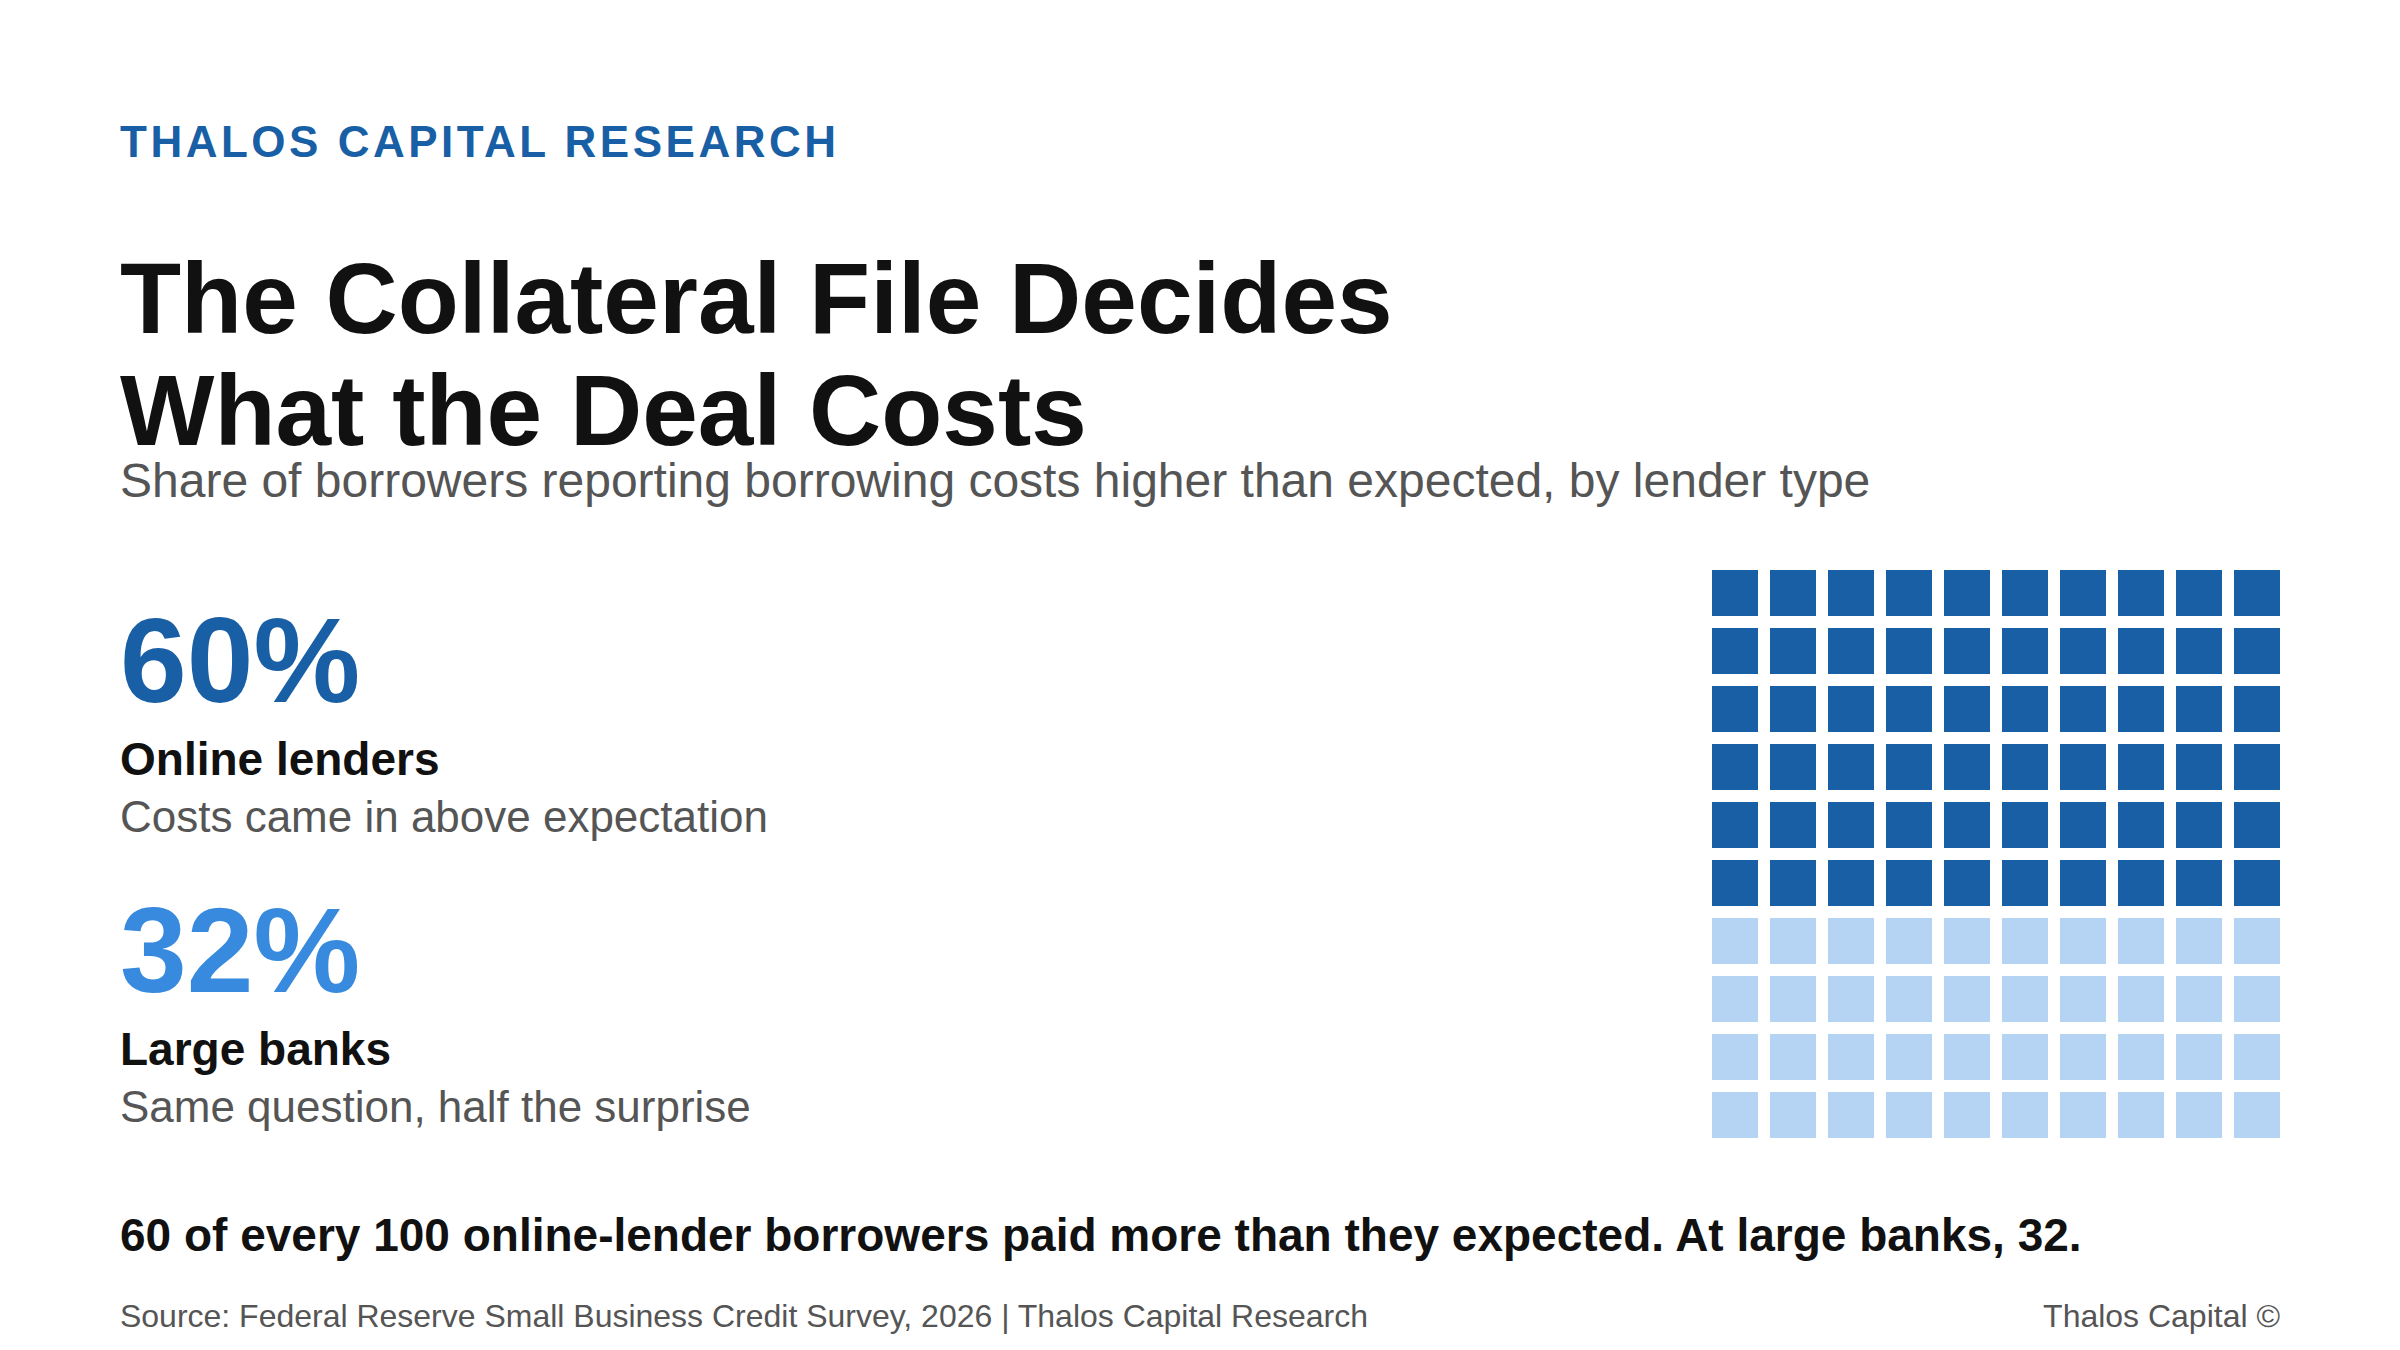
Waffle chart showing 60 of 100 squares in dark navy, representing the 60 percent of online-lender borrowers who reported borrowing costs higher than expected, compared with 32 percent at large banks.

Collateral Verification Is Now the First Diligence Question, Not the Last

Sixty percent of online-lender borrowers paid more than they expected. The gap is not about lender type. It is about what the borrower verified before the process started.
Read More
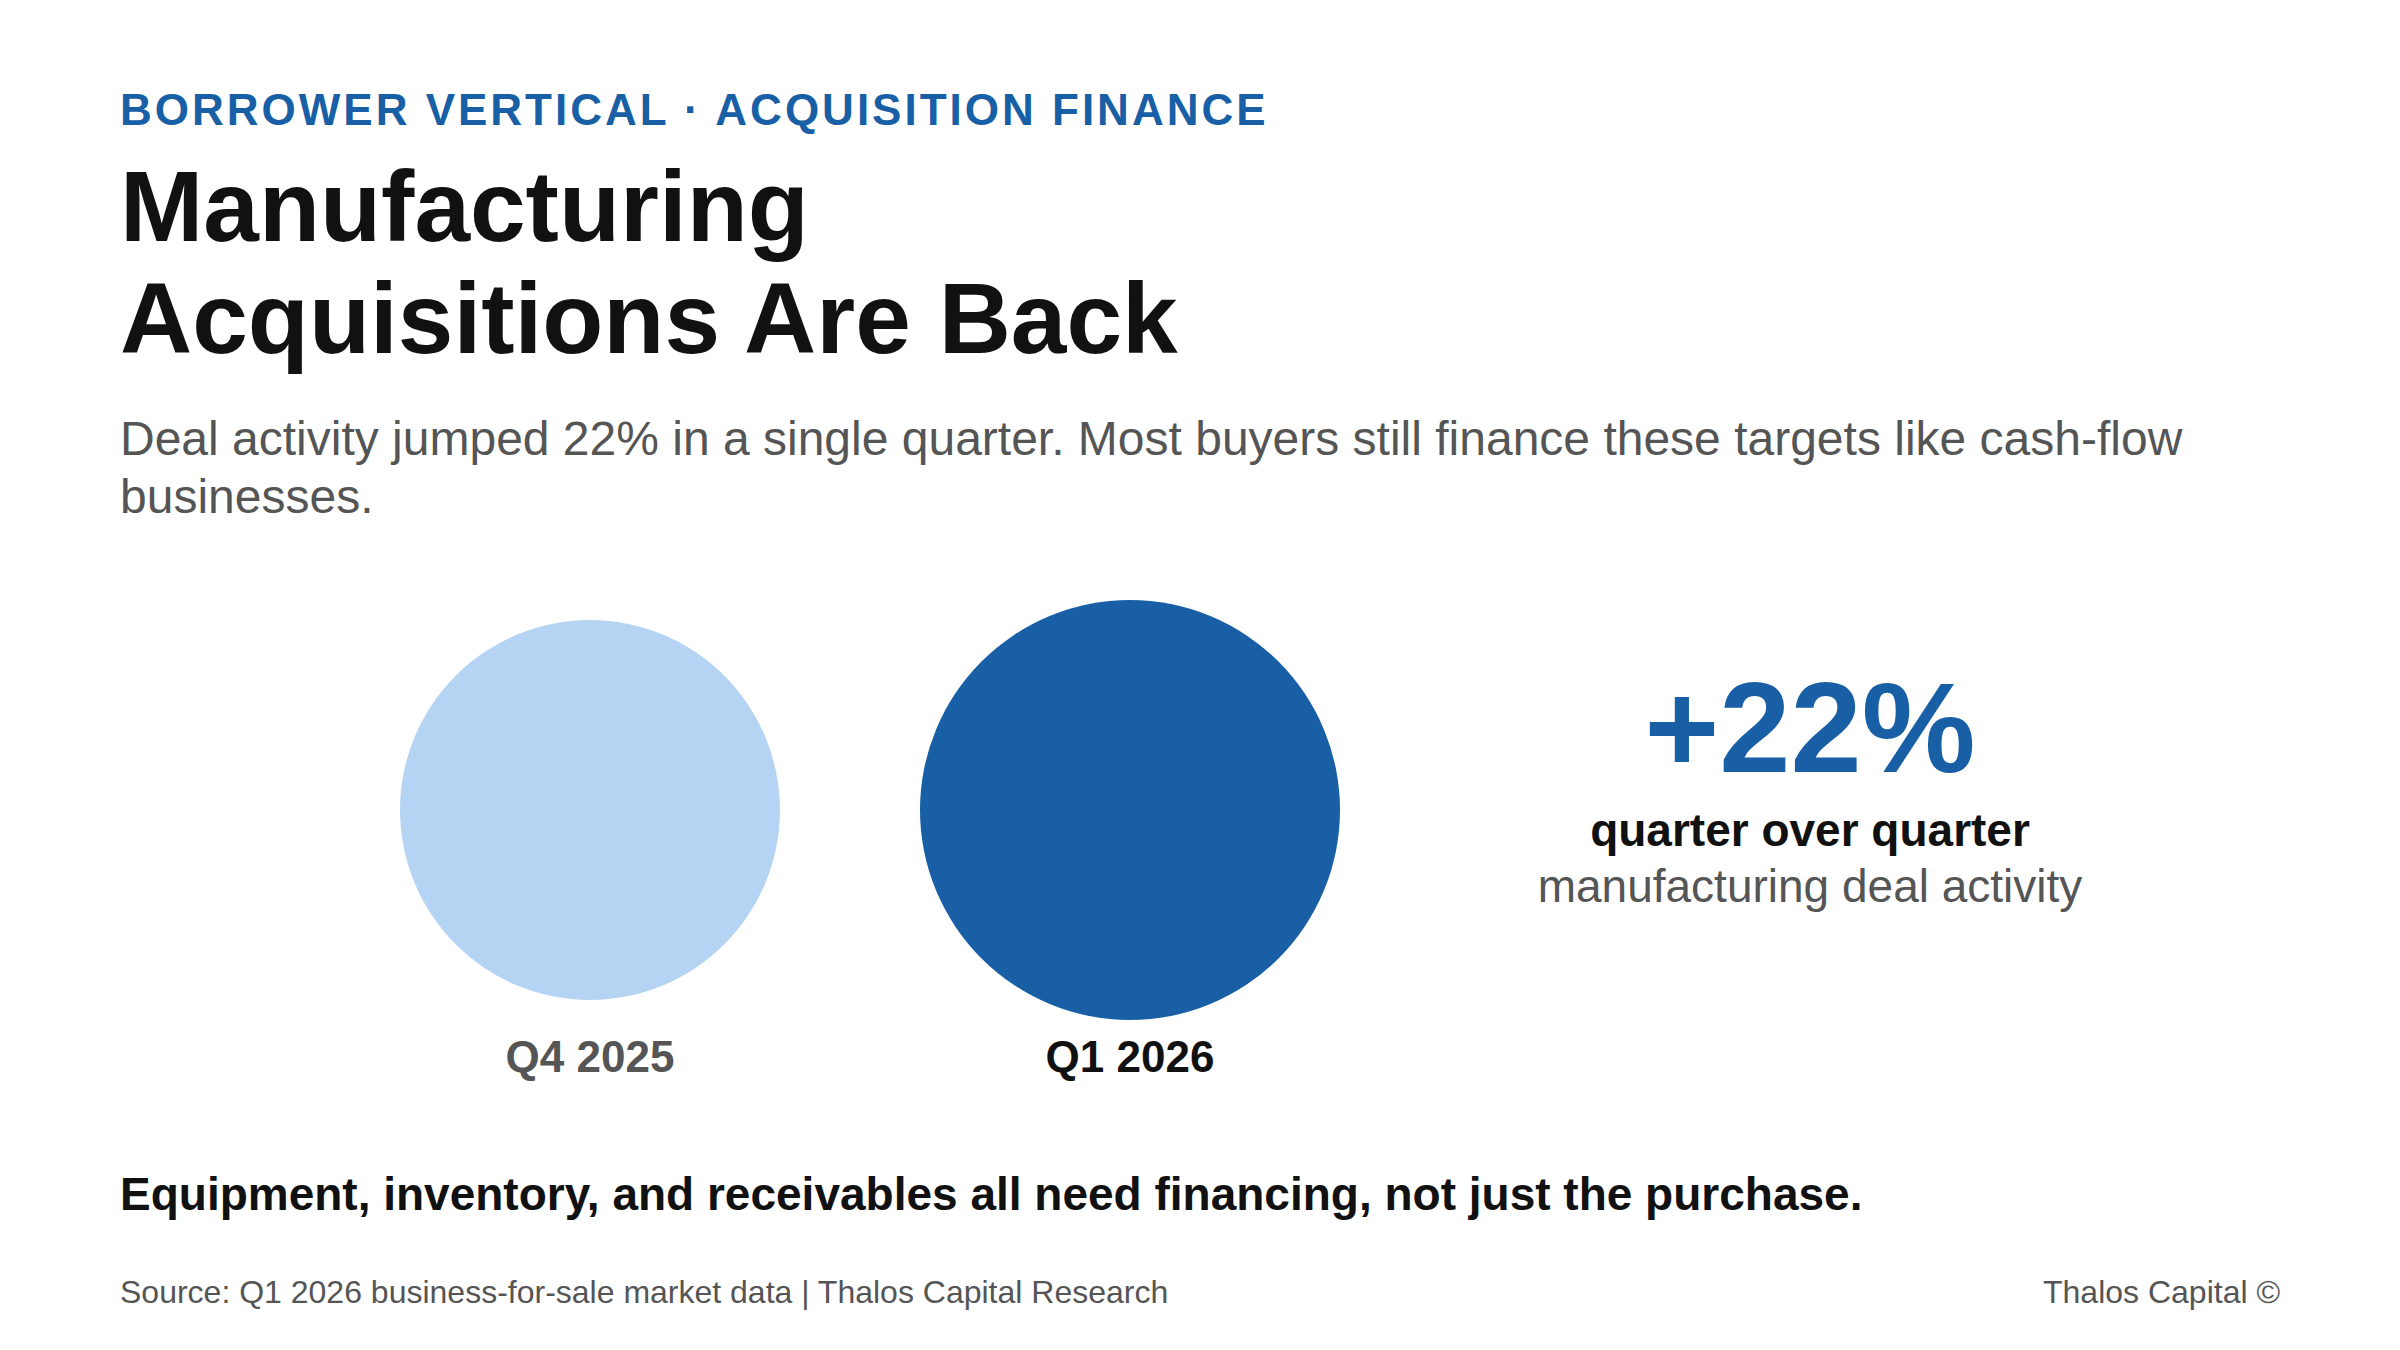
Two proportional circles showing small manufacturing acquisition activity rising 22 percent from Q4 2025 to Q1 2026, with a caption that equipment, inventory, and receivables all need financing, not just the purchase.

Manufacturing Acquisitions Are Back. Financing Them Like a Cash-Flow Buyout Isn't.

Manufacturing acquisitions jumped 22% in Q1 2026, but buyers financing them with a single acquisition loan leave equipment, inventory, and working capital unfunded. Why asset-heavy deals need a blended capital stack.
Read More
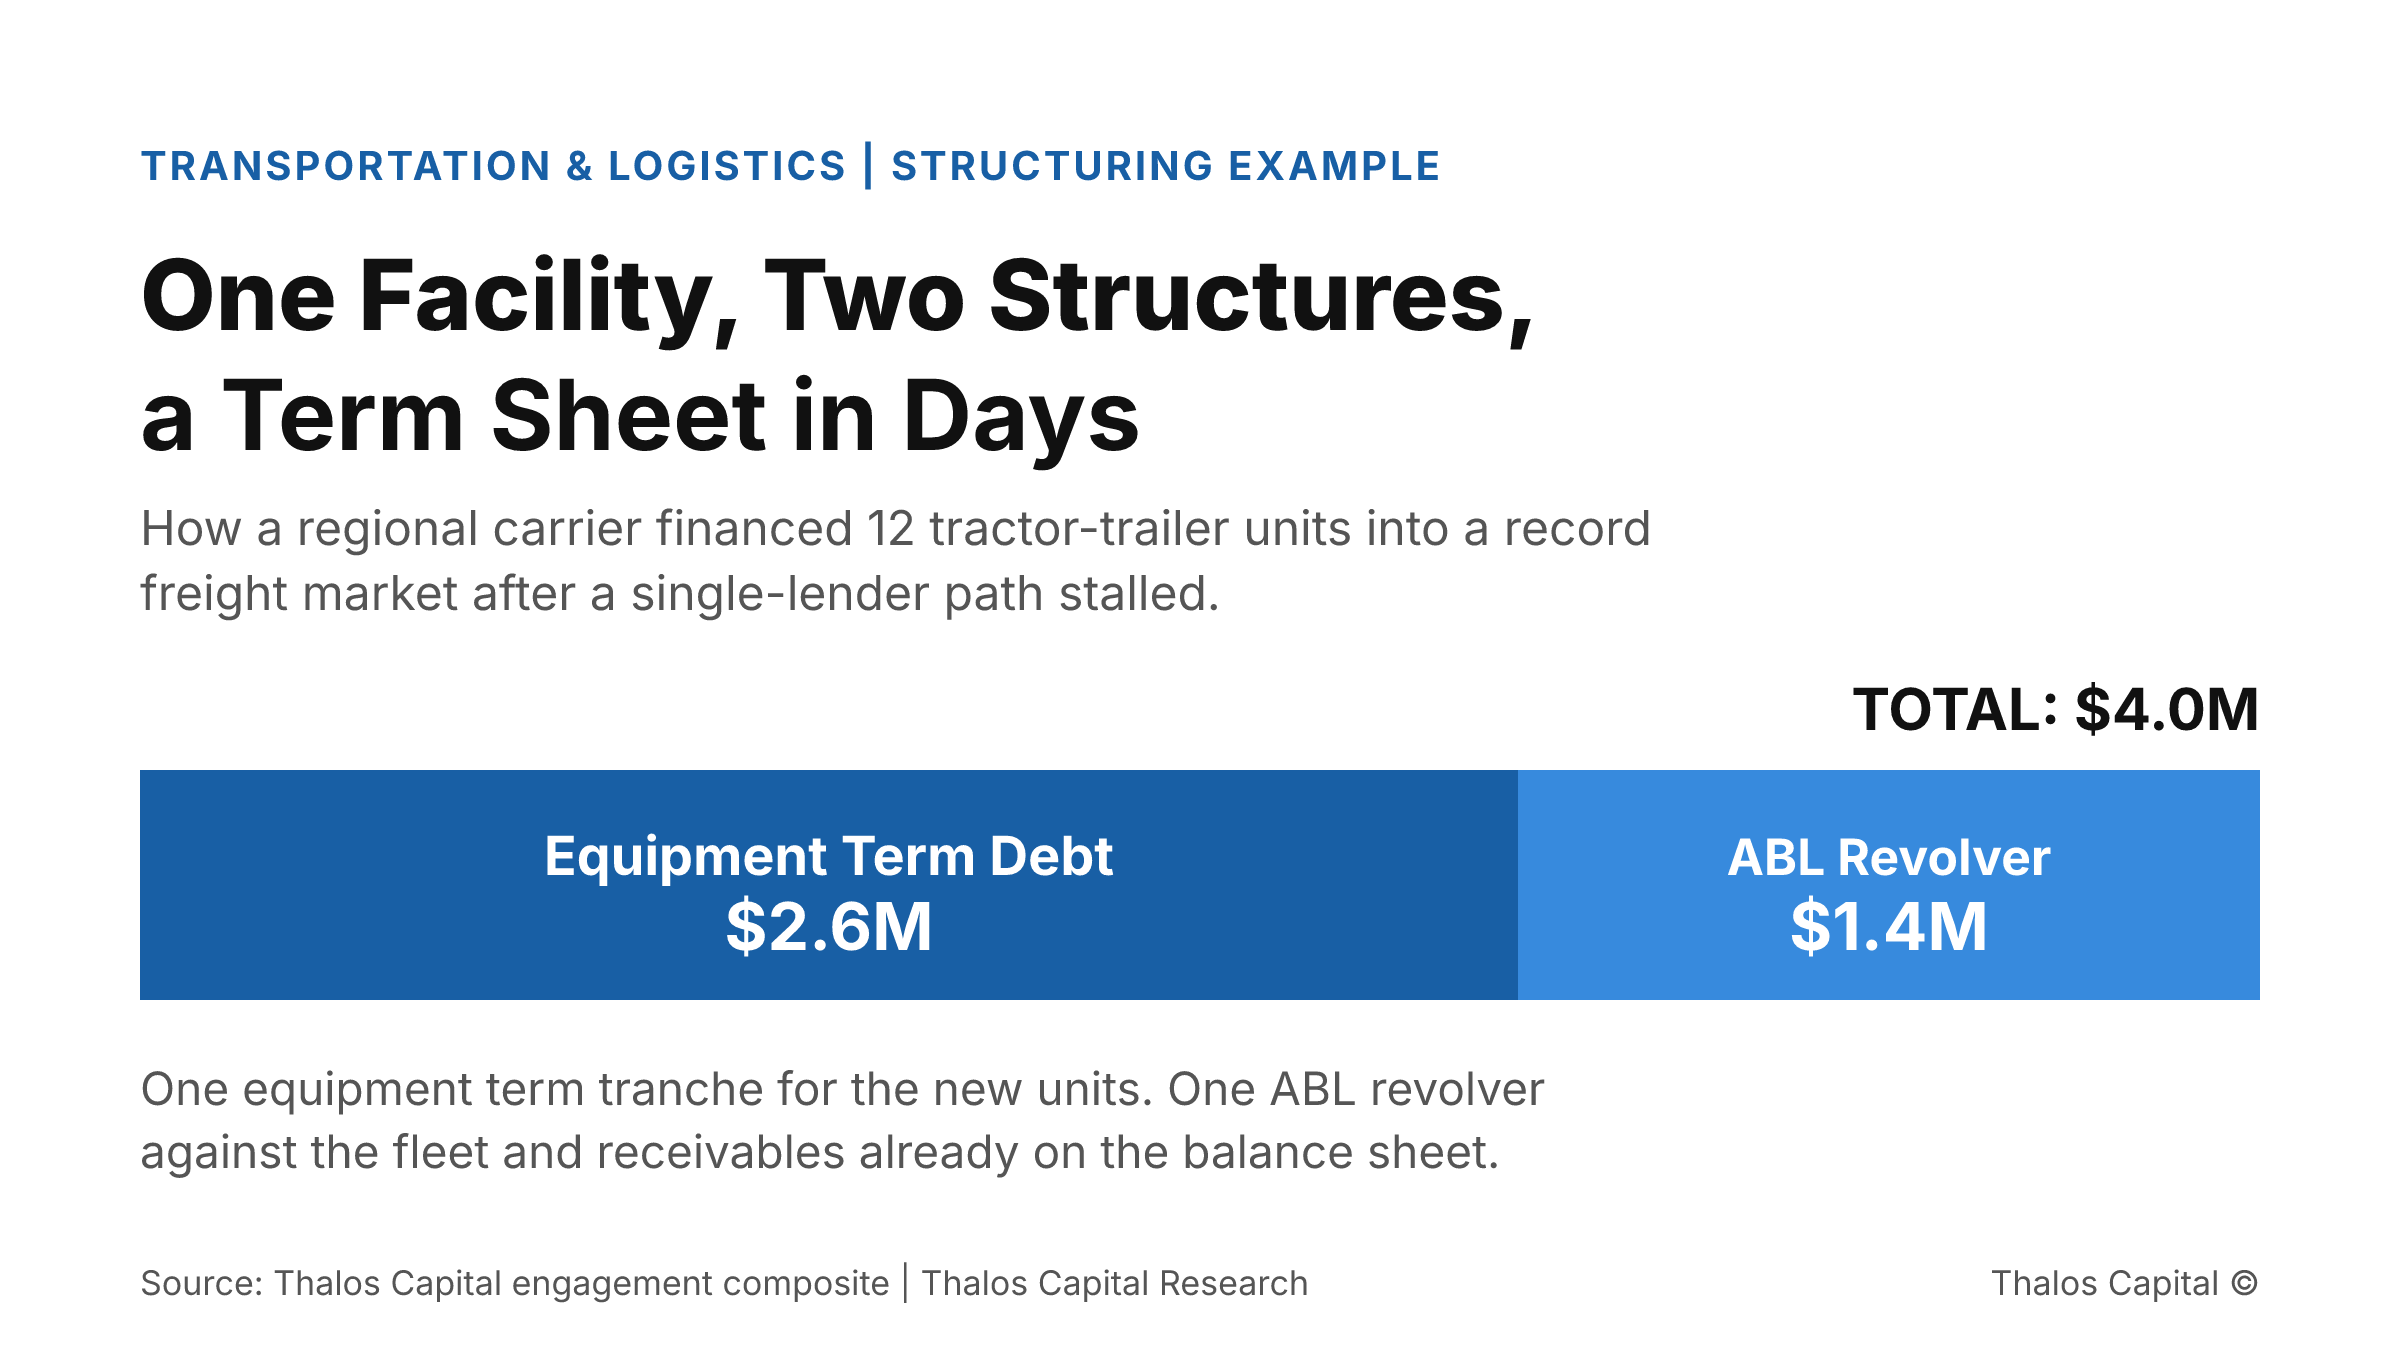
Single stacked bar showing a $4.0 million carrier facility split into a $2.6 million equipment term tranche for 12 tractor-trailer units and a $1.4 million ABL revolver.

How One Regional Carrier Financed Fleet Expansion Into a Record Market After the Bank Said No

US truckload spot rates hit a record $3.83 per mile, but recession-scarred balance sheets stall bank-only expansion. How one carrier structured $4.0M to add trucks in days.
Read More
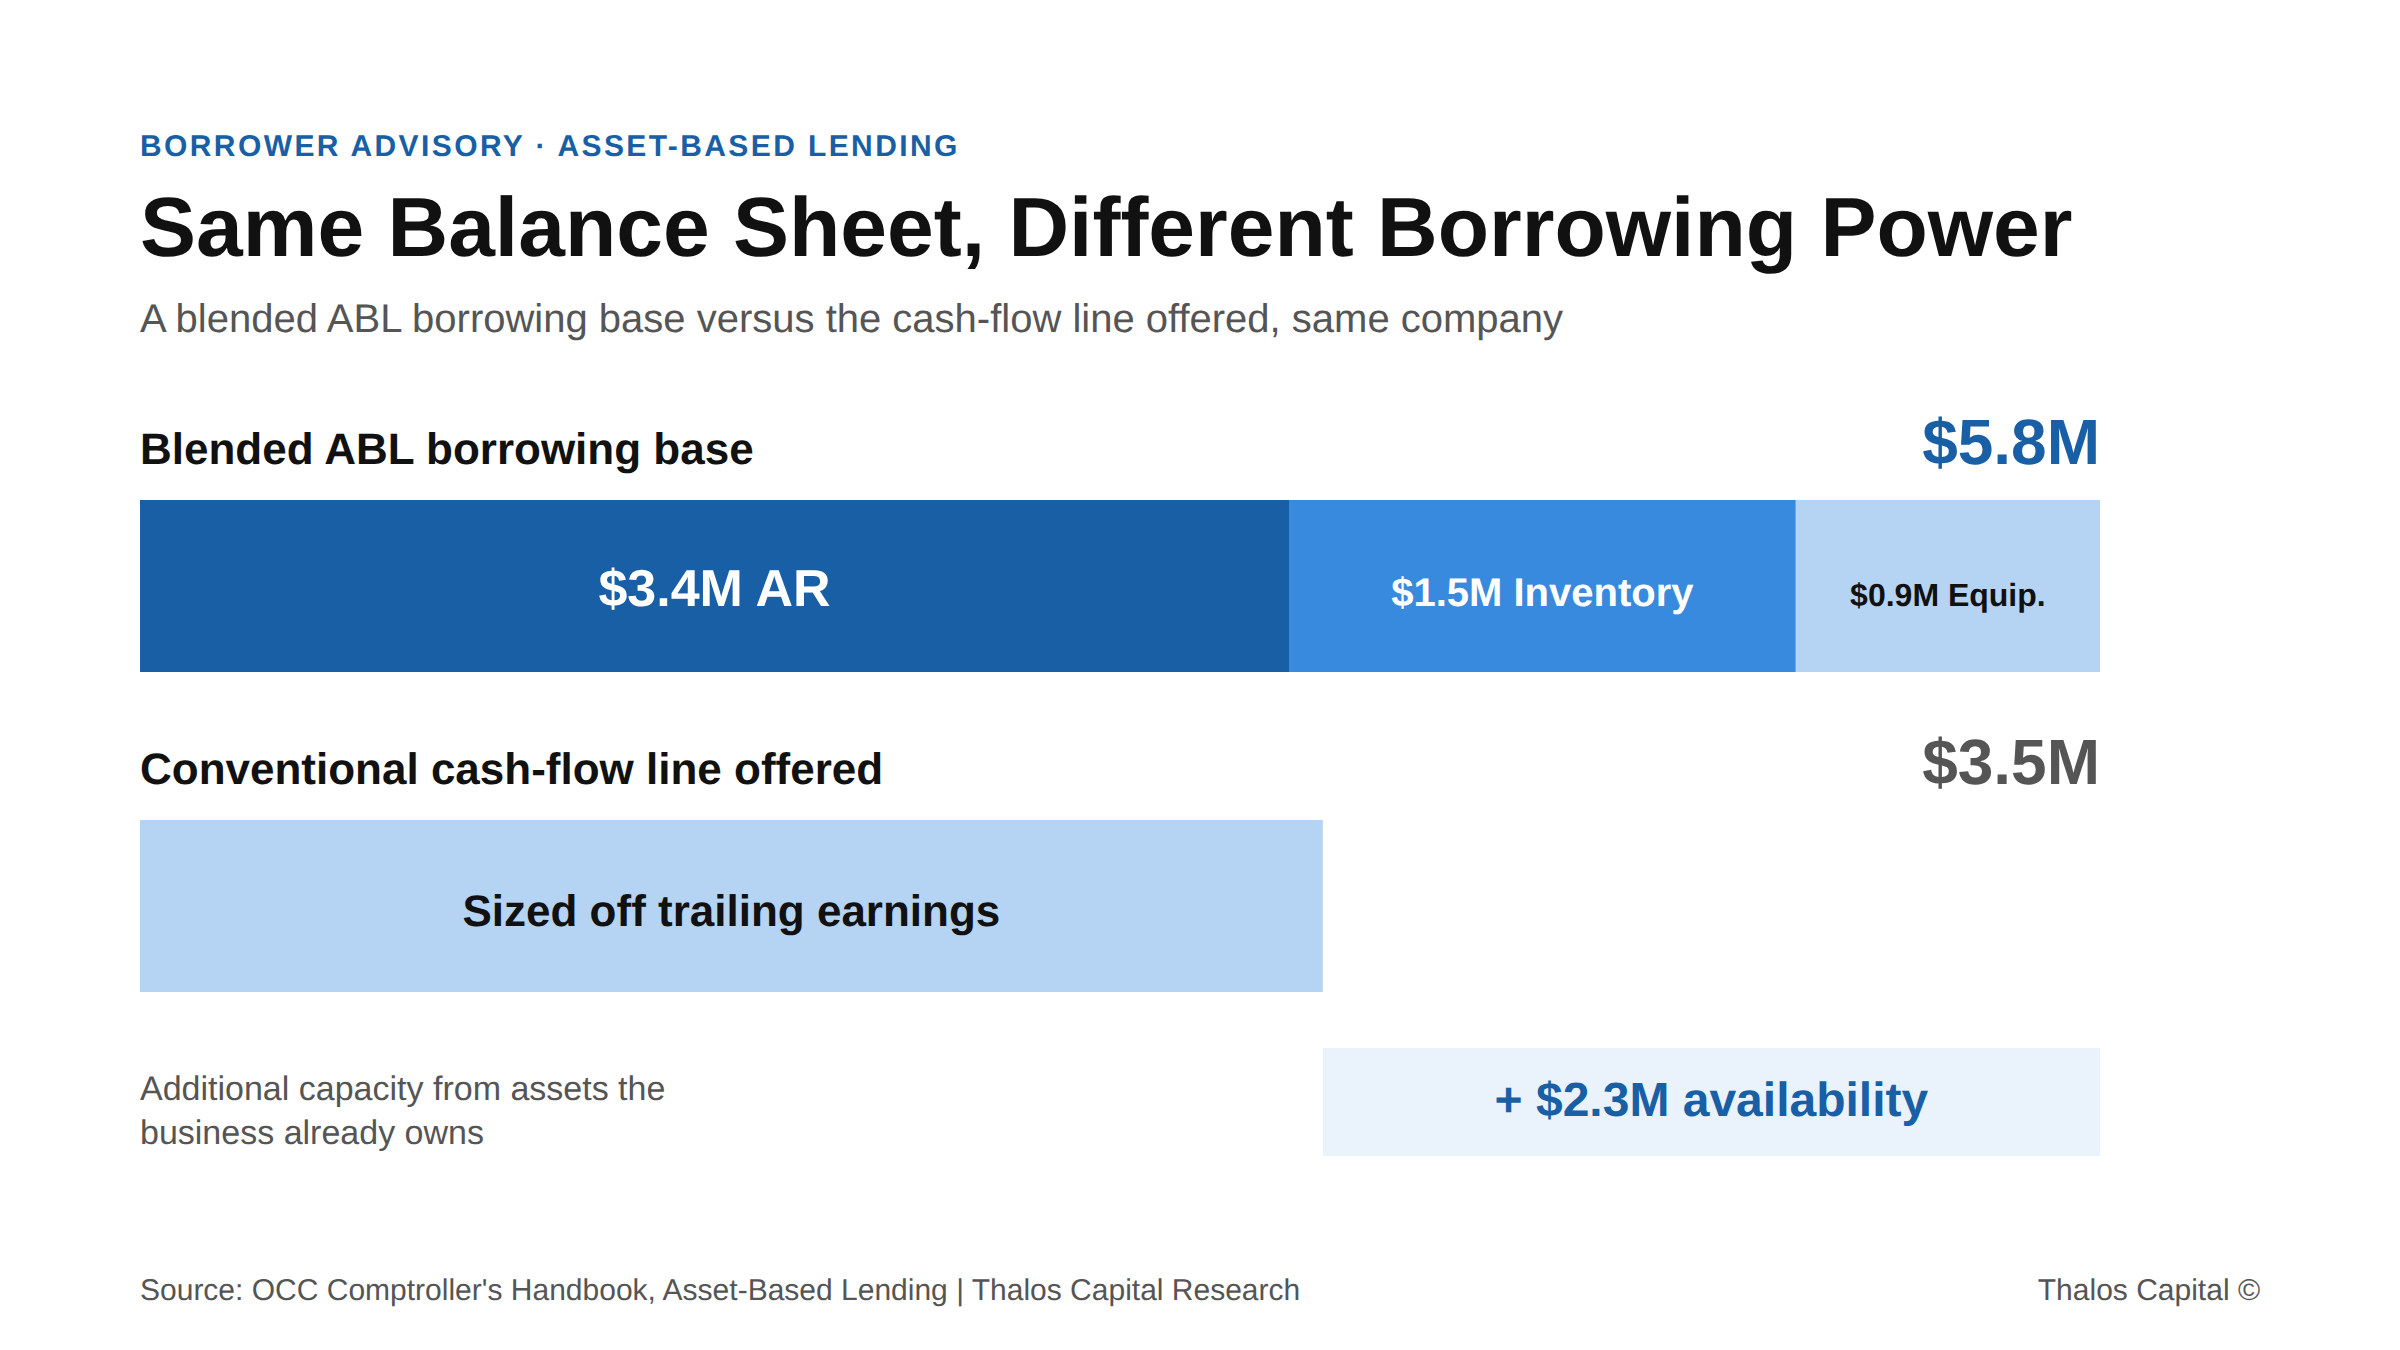
Single stacked bar. how a blended borrowing base is built, against the cash-flow line offered.

Asset-Rich, Credit-Capped: Why Tightening Operators Borrow Against the Wrong Thing

Asset-rich operators tightening through rising costs often borrow against the wrong thing. Why a cash-flow line caps capacity the balance sheet could exceed, with the numbers.
Read More
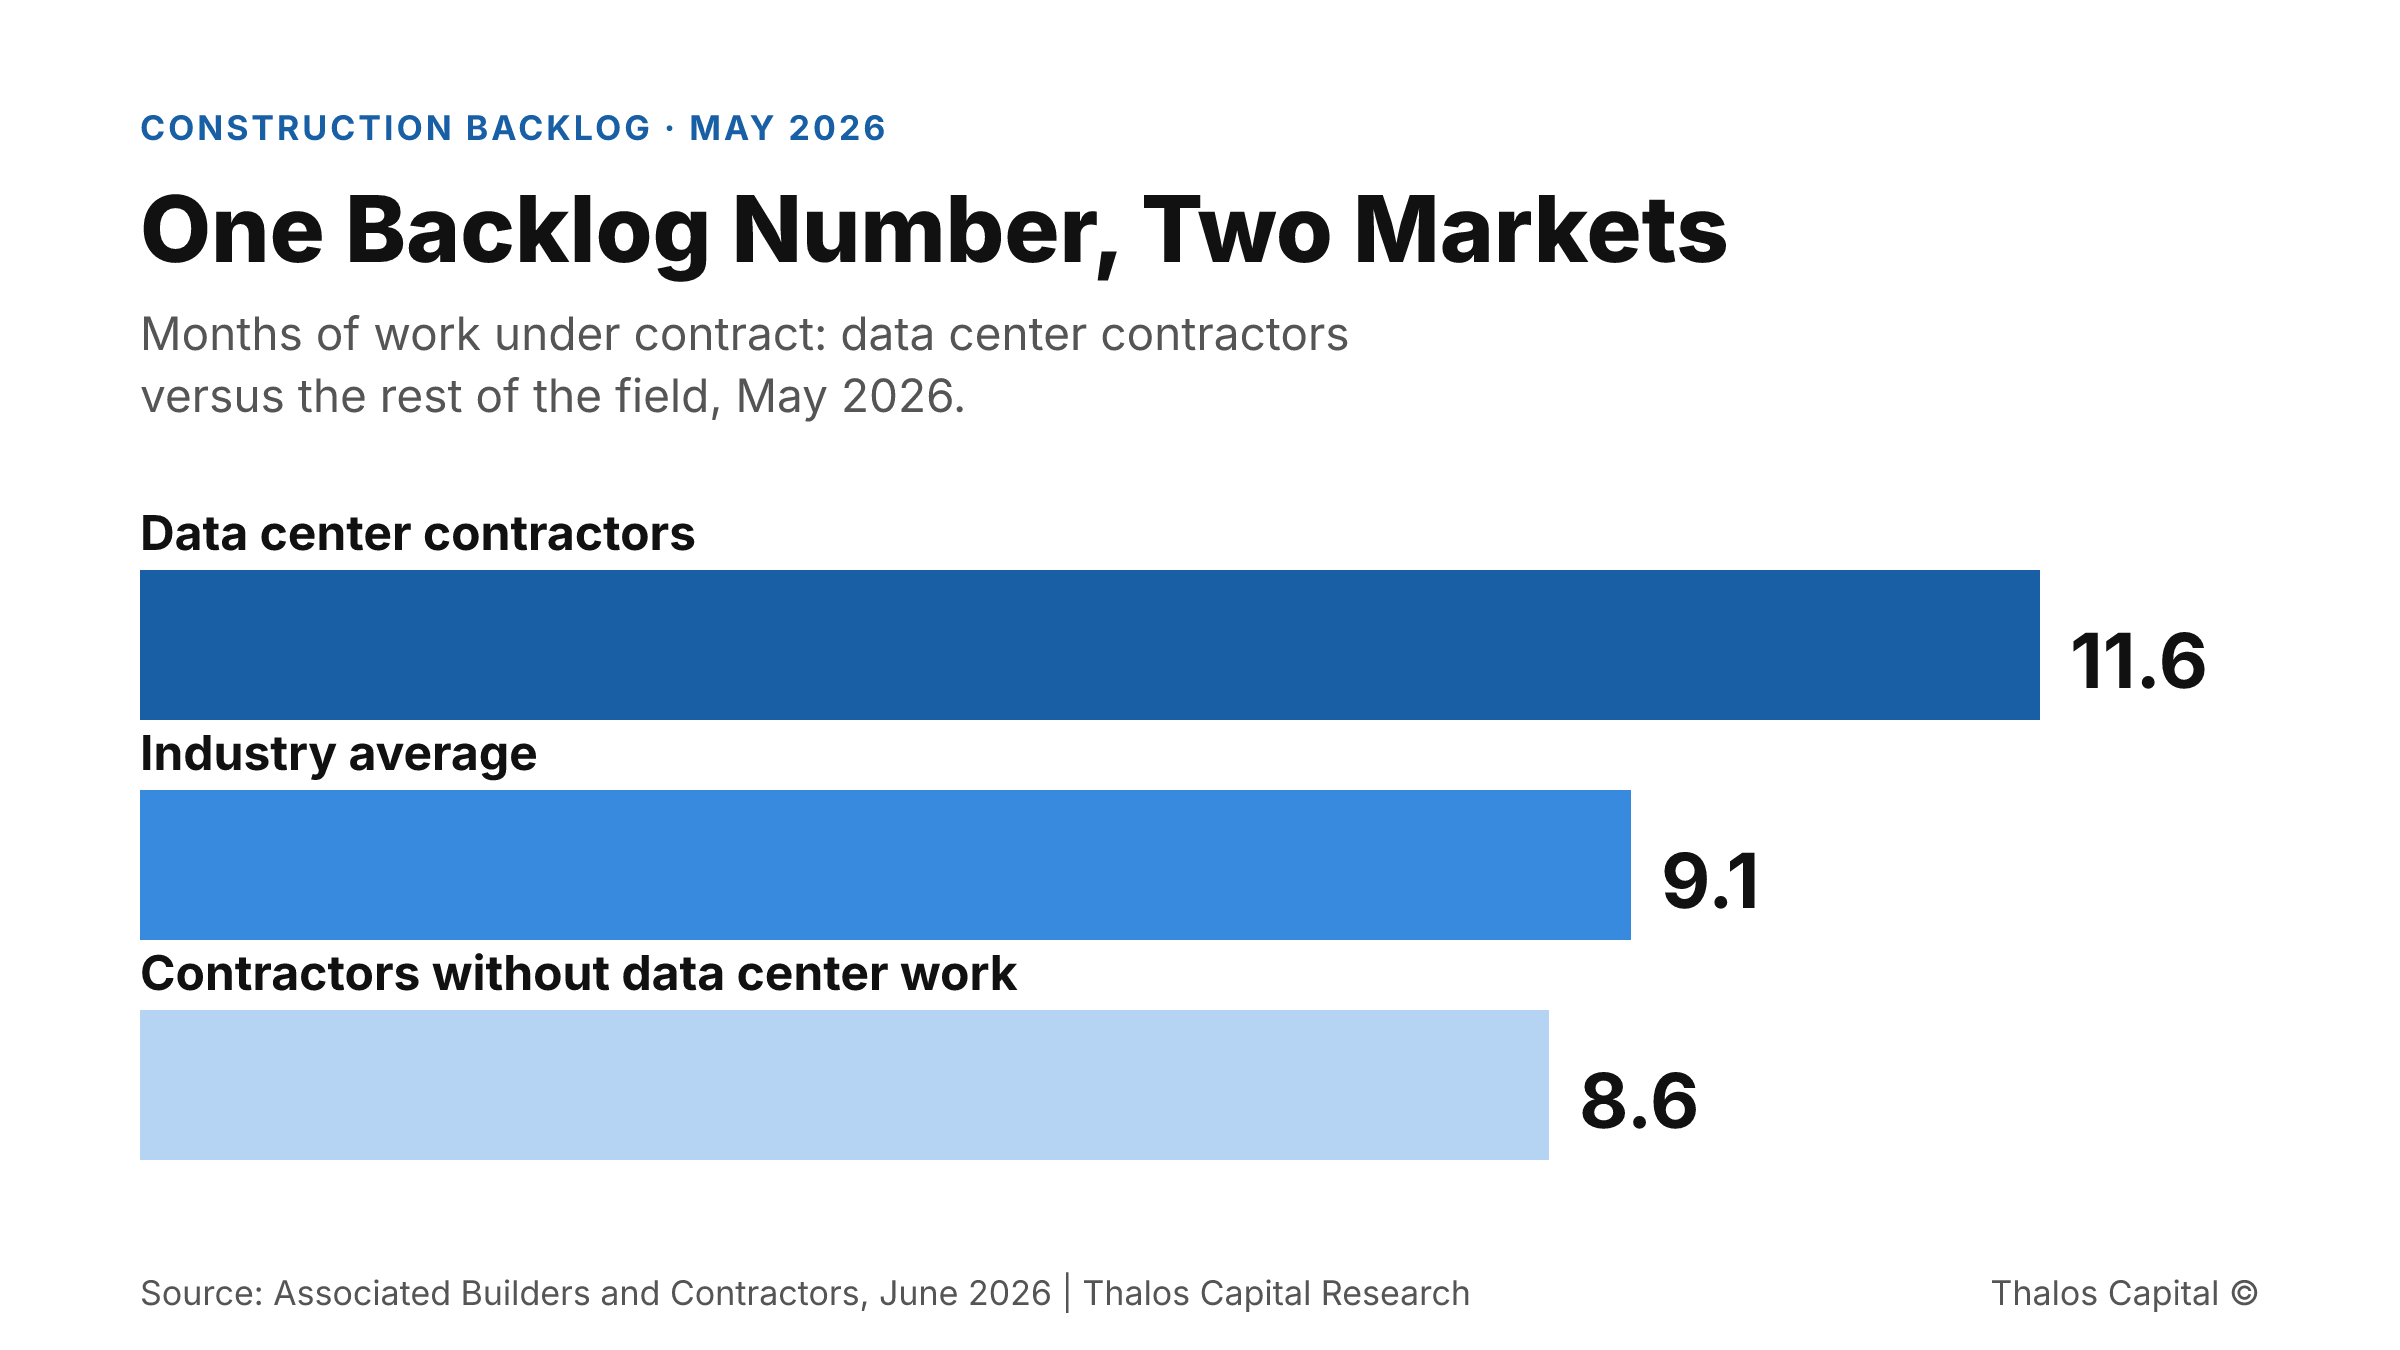
Horizontal bar chart showing construction backlog of 11.6 months for data center contractors, 9.1 months industry average, and 8.6 months for contractors without data center work, May 2026

The Three-Month Backlog Gap Now Splitting the Construction Market

Construction backlog hit a three-year high in May, but the gain is concentrated in data center work. Why the 86% of contractors outside that lane risk being priced off a market they do not occupy.
Read More
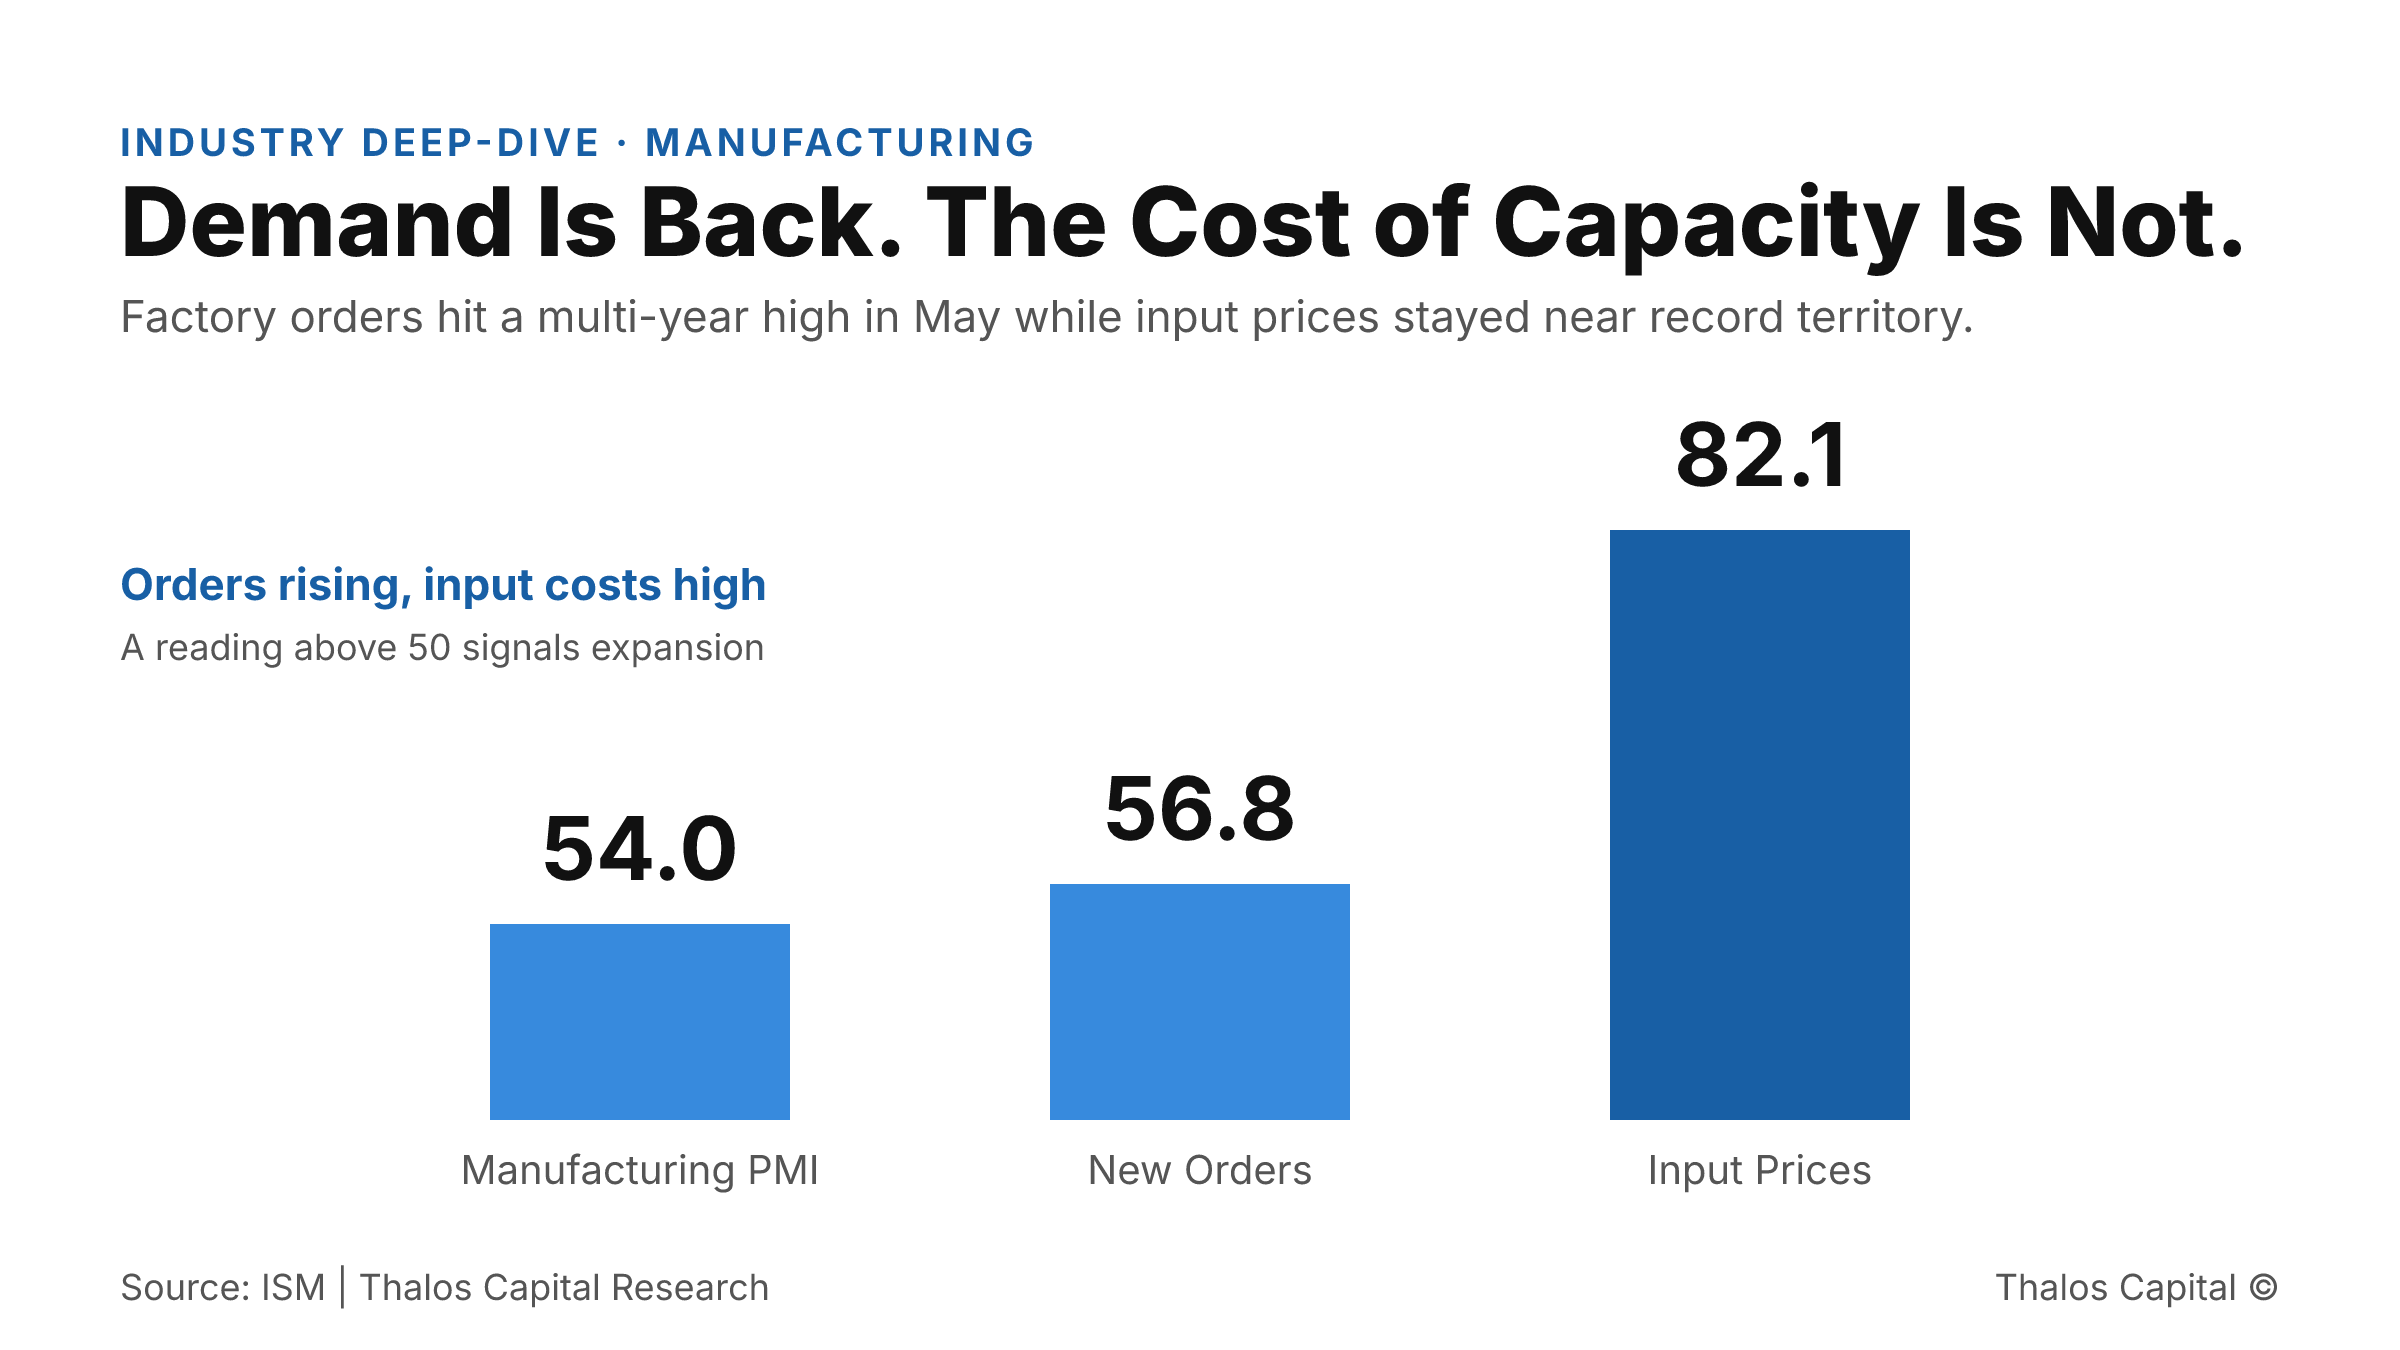
Bar chart of May 2026 ISM manufacturing readings showing the PMI at 54.0, New Orders at 56.8, and the Prices Index at 82.1, with demand expanding while input prices stay elevated.

The Order Came In. The Cash to Fill It Did Not.

Manufacturing demand hit a multi-year high in May while input prices stayed near record levels. Why funding capacity now depends on how equipment and working capital financing is structured and sourced.
Read More
Working through a financing decision?
Insights are a starting point. A conversation maps your actual options.
Tell us what you are financing and we will map the structures and sources that fit.
Submit your financing request →
Explore our financing solutions
Equipment FinancingWorking CapitalAsset-Based LendingStrategic Debt