Tag

capital stack

2 insights

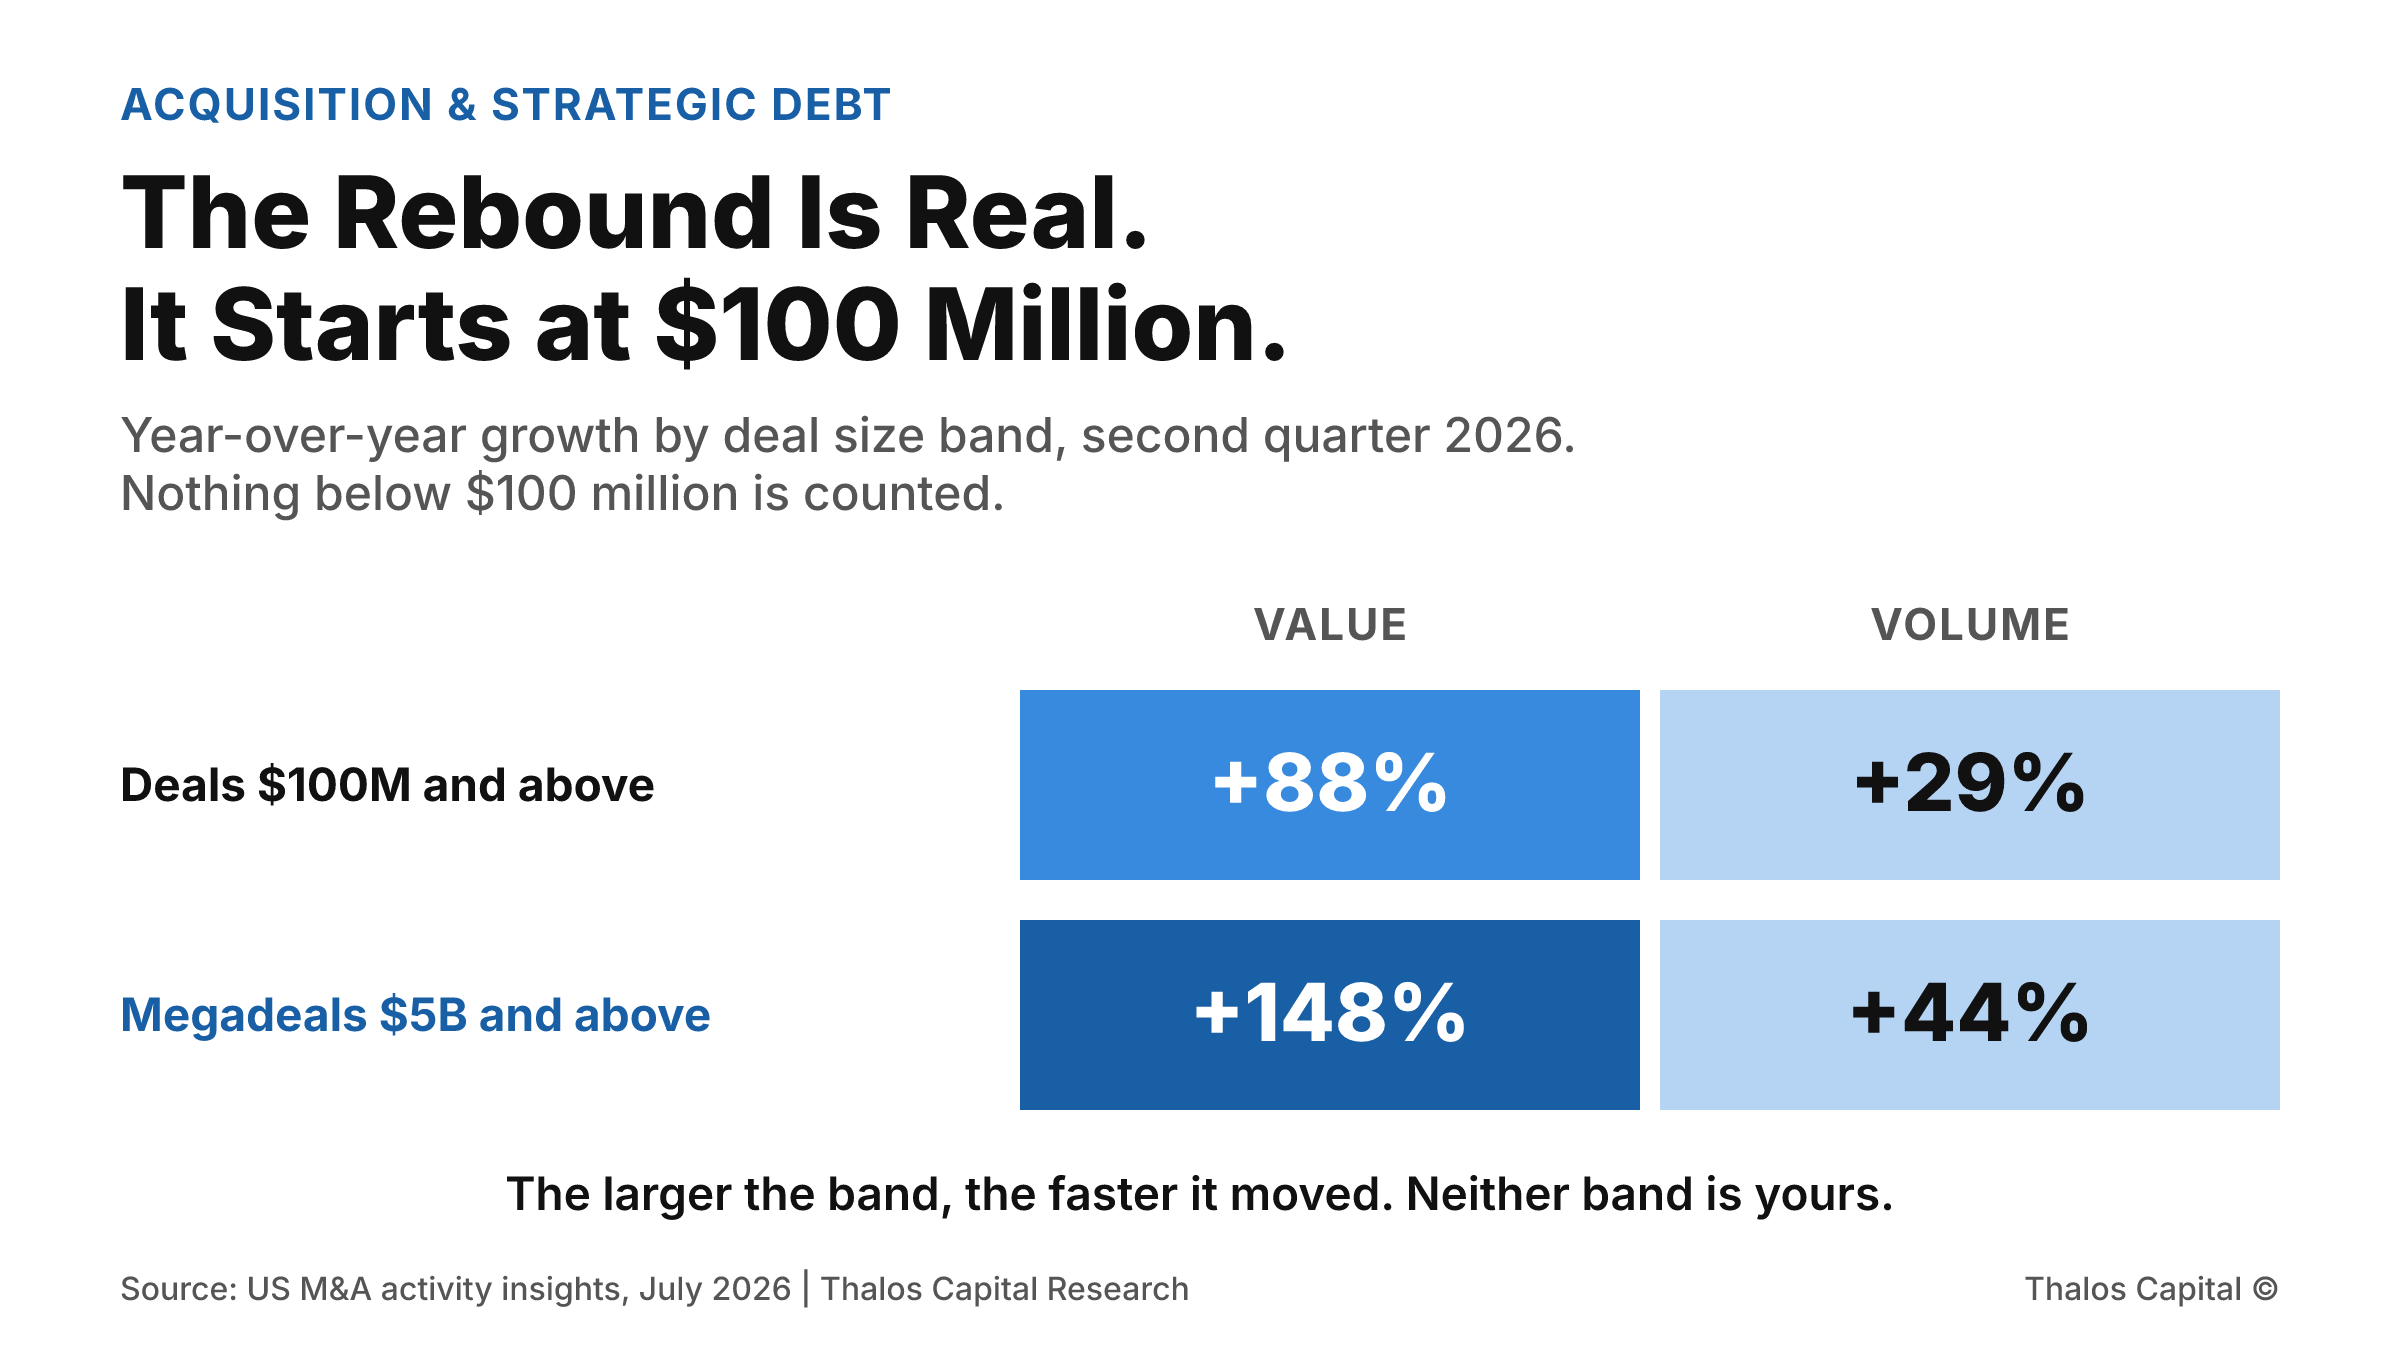
Shaded grid comparing year-over-year growth in the second quarter of 2026 for two deal size bands: transactions of $100 million or more grew 88 percent in value and 29 percent in volume, while megadeals of $5 billion or more grew 148 percent in value and 44 percent in volume, with the 148 percent figure shown in the darkest navy.

The Rebound Is Real. It Starts at $100 Million.

Second-quarter deals of $100 million or more rose 88 percent in value and 29 percent in volume, and the data that reports it does not count anything smaller. What that means for a buyer working a $5 to $50 million acquisition.
Read More
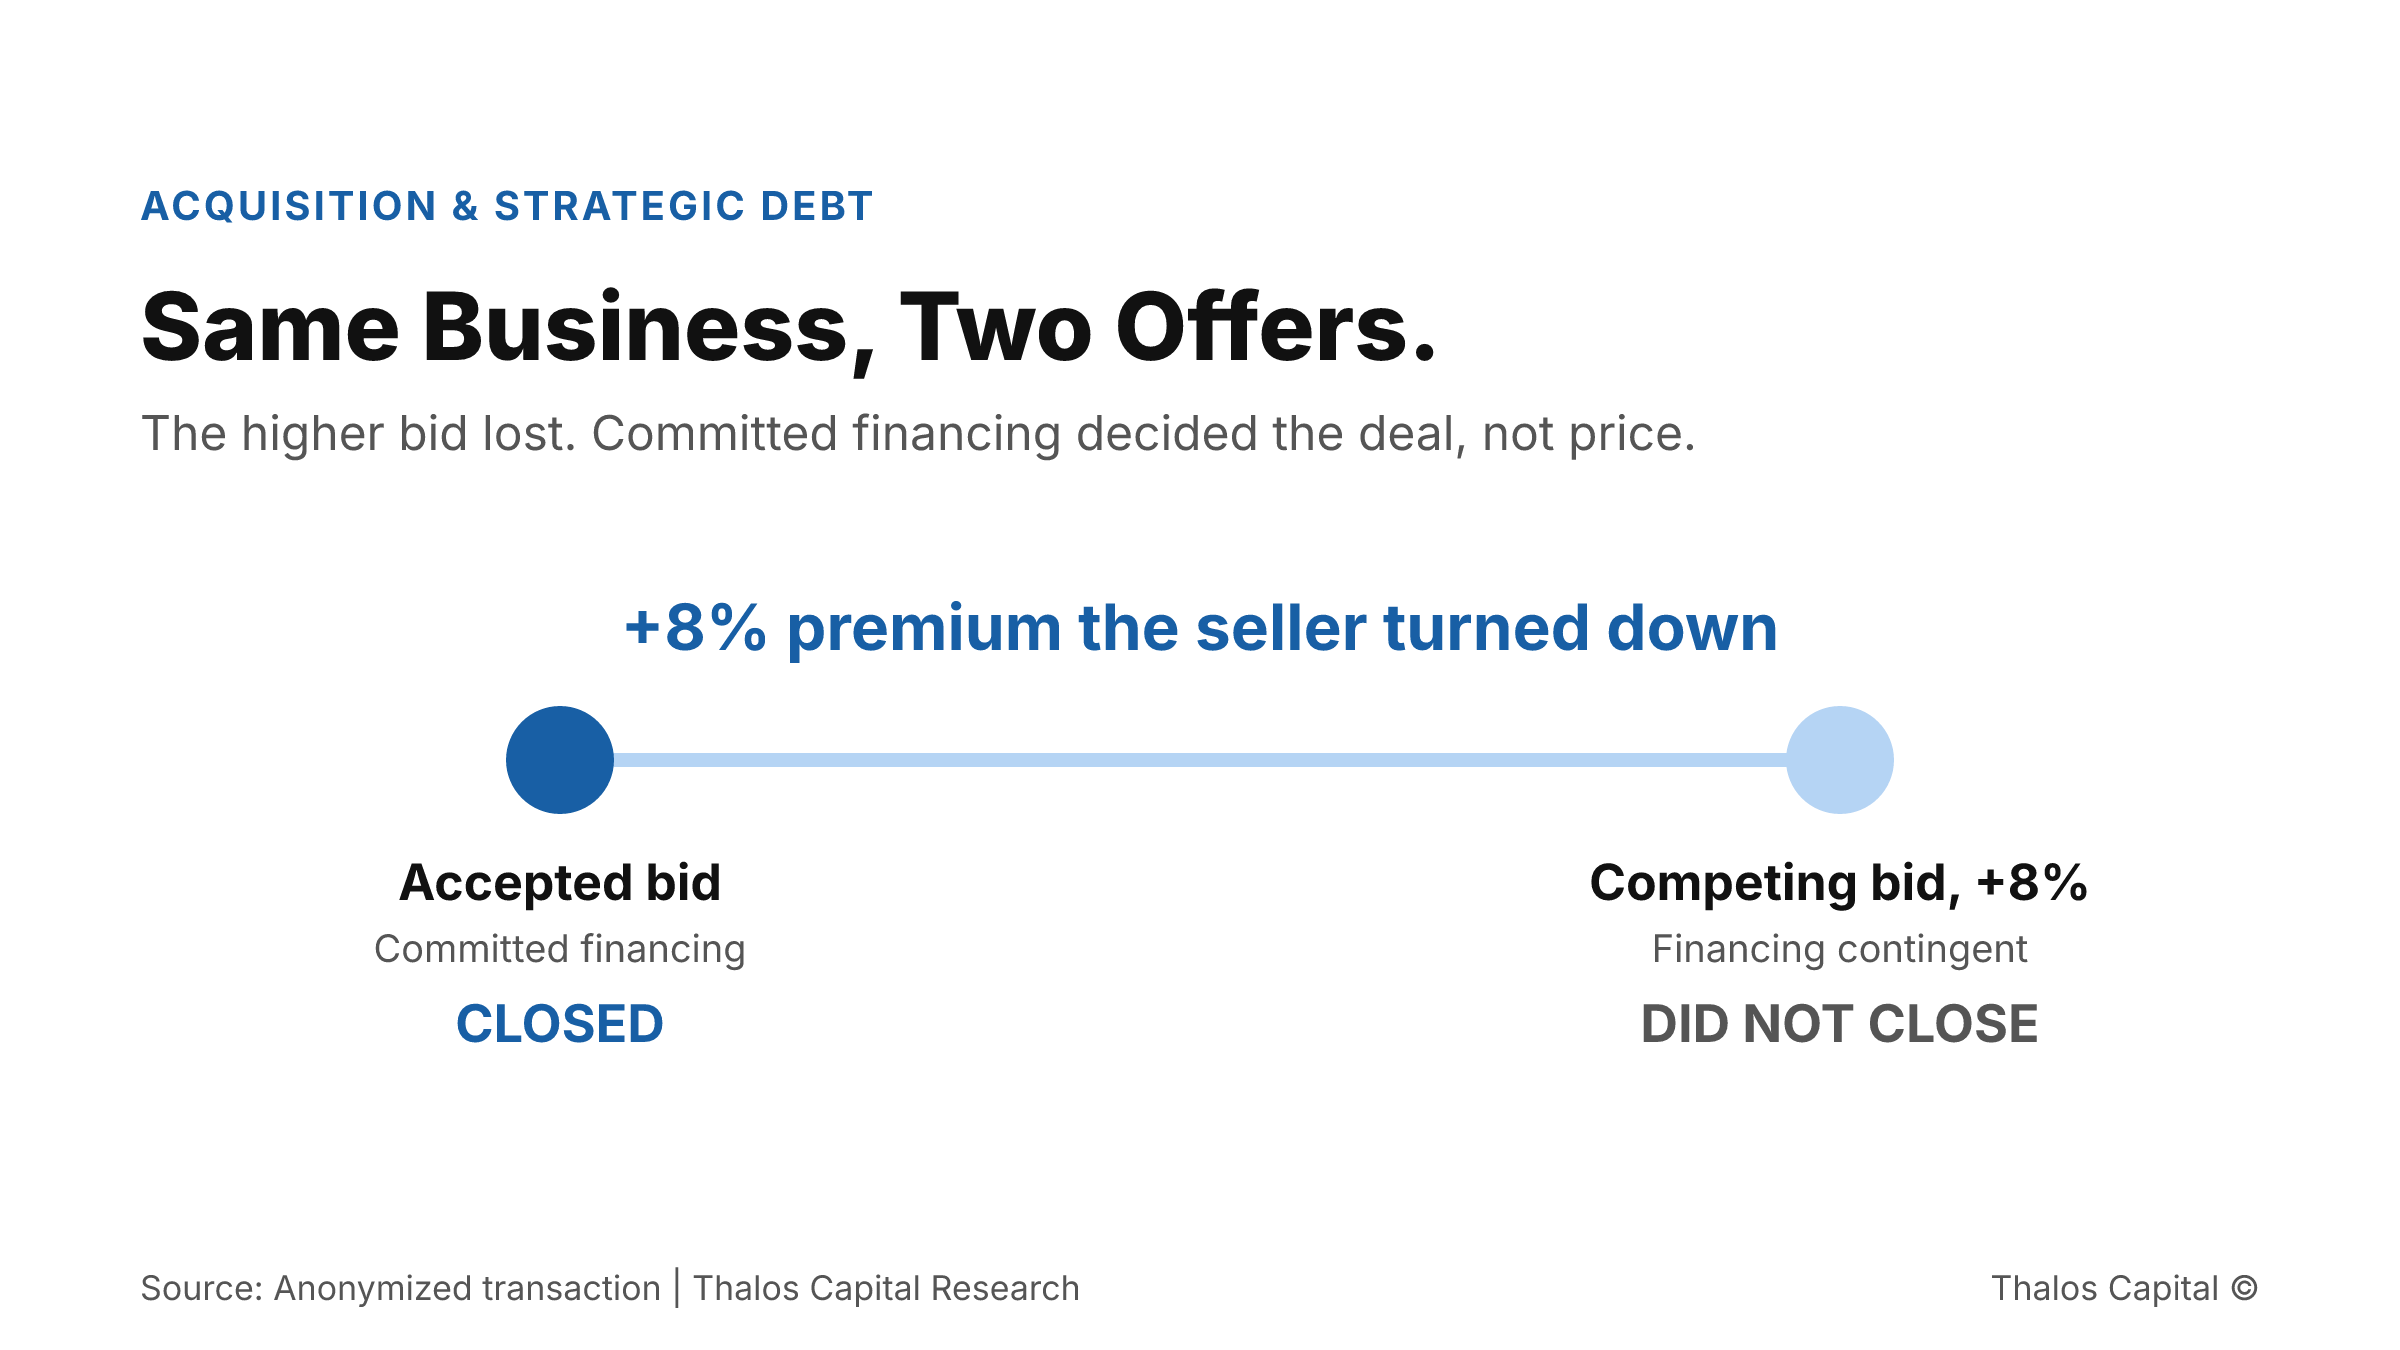
Two-point range comparing two offers for the same business, showing an accepted bid with committed financing that closed and a competing bid roughly 8 percent higher with a financing contingency that did not close.

Same Business, Two Offers: Why the Lower Bid Won

A higher bid lost to a lower one backed by committed financing. In 2026's busy M&A market, structure and certainty of close decide which acquisition offer a seller actually takes.
Read More
Working through a financing decision?
Insights are a starting point. A conversation maps your actual options.
Tell us what you are financing and we will map the structures and sources that fit.
Submit your financing request →
Explore our financing solutions
Equipment FinancingWorking CapitalAsset-Based LendingStrategic Debt